Abstract
In bacterial translational initiation, three initiation factors (IFs 1-3) enable the selection of initiator tRNA and the start codon in the P site of the 30S ribosomal subunit. Here, we report 11 single-particle cryo-electron microscopy (cryoEM) reconstructions of the complex of bacterial 30S subunit with initiator tRNA, mRNA, and IFs 1-3, representing different steps along the initiation pathway. IF1 provides key anchoring points for IF2 and IF3, thereby enhancing their activities. IF2 positions a domain in an extended conformation appropriate for capturing the formylmethionyl moiety charged on tRNA. IF3 and tRNA undergo large conformational changes to facilitate the accommodation of the formylmethionyl-tRNA (fMet-tRNA(fMet)) into the P site for start codon recognition.
🔬 Techniques
🔭 Microscopes
🧬 Organisms
💻 Software
✨ Fluorophores
🧪 Sample Preparation
🔬 Cell Lines
🏭 Microscope Brands
🧪 Reagent Suppliers
📷 Detectors
💻 Software Details
💾 Data Repositories
🏛️ Research Organizations (ROR)
Affiliated research institutions:
📋 Methods
Key Resources Table
REAGENT or RESOURCE SOURCE IDENTIFIER Chemicals, Peptides, and Recombinant Proteins IF1 Thermus thermophilus Carter et al., 2001 N/A IF2 Thermus thermophilus This paper N/A IF3 Thermus thermophilus This paper N/A fMet-tRNA Escherichia coli Schmitt et al., 1998 N/A Deposited Data EMD-4073 Electron Microscopy Data Bank (EMDB) http://www.emdatabank.org/ EMD-4074 EMDB http://www.emdatabank.org/ EMD-4075 EMDB http://www.emdatabank.org/ EMD-4076 EMDB http://www.emdatabank.org/ EMD-4077 EMDB http://www.emdatabank.org/ EMD-4078 EMDB http://www.emdatabank.org/ EMD-4079 EMDB http://www.emdatabank.org/ EMD-4080 EMDB http://www.emdatabank.org/ EMD-4081 EMDB http://www.emdatabank.org/ EMD-4082 EMDB http://www.emdatabank.org/ EMD-4083 EMDB http://www.emdatabank.org/ 5LMN Protein Data Bank (PDB) http://www.wwpdb.org/ 5LMO PDB http://www.wwpdb.org/ 5LMP PDB http://www.wwpdb.org/ 5LMQ PDB http://www.wwpdb.org/ 5LMR PDB http://www.wwpdb.org/ 5LMS PDB http://www.wwpdb.org/ 5LMT PDB http://www.wwpdb.org/ 5LMU PDB http://www.wwpdb.org/ 5LMV PDB http://www.wwpdb.org/ Experimental Models: Organisms/Strains Escherichia coli BL21(DE3) Invitrogen Cat#C600003 Thermus thermophilus N/A Escherichia coli K12 N/A Recombinant DNA pBStRNA Y f Met Schmitt et al., 1998 N/A pET13a Gerchman et al., 1994 N/A pET30a Merck Millipore, Novagen Cat#69909 Sequence-Based Reagents mRNA sequence: 5′GCUCUUUUAACAAUUUAUCAGGCAAGGAGGUAAAA AUG UUCA-3′ Integrated DNA Technologies N/A Software and Algorithms MotionCorr Li et al., 2013 http://cryoem.ucsf.edu/software/driftcorr.html CTFFIND3 Mindell and Grigorieff, 2003 http://grigoriefflab.janelia.org/ctf Relion-1.4 Scheres, 2012 http://www2.mrc-lmb.cam.ac.uk/relion/index.php/Main_Page Eman2 Tang et al., 2007 http://blake.bcm.edu/emanwiki/EMAN2 Chimera Pettersen et al., 2004 https://www.cgl.ucsf.edu/chimera/ Coot v0.8 Emsley et al., 2010 http://www2.mrc-lmb.cam.ac.uk/personal/pemsley/coot/ Refmac v5.8 Brown et al., 2015 https://www2.mrc-lmb.cam.ac.uk/groups/murshudov/content/refmac/refmac.html Molprobity Chen et al., 2010 http://molprobity.biochem.duke.edu/ Pymol DeLano, 2006 http://www.pymol.org Contact for Reagents and Resource Sharing Further information ad requests for reagents may be directed to, and will be fulfilled by the corresponding author V. Ramakrishnan ( ramak@mrc-lmb.cam.ac.uk ).
Show full methods section
Key Resources Table
REAGENT or RESOURCE SOURCE IDENTIFIER Chemicals, Peptides, and Recombinant Proteins IF1 Thermus thermophilus Carter et al., 2001 N/A IF2 Thermus thermophilus This paper N/A IF3 Thermus thermophilus This paper N/A fMet-tRNA Escherichia coli Schmitt et al., 1998 N/A Deposited Data EMD-4073 Electron Microscopy Data Bank (EMDB) http://www.emdatabank.org/ EMD-4074 EMDB http://www.emdatabank.org/ EMD-4075 EMDB http://www.emdatabank.org/ EMD-4076 EMDB http://www.emdatabank.org/ EMD-4077 EMDB http://www.emdatabank.org/ EMD-4078 EMDB http://www.emdatabank.org/ EMD-4079 EMDB http://www.emdatabank.org/ EMD-4080 EMDB http://www.emdatabank.org/ EMD-4081 EMDB http://www.emdatabank.org/ EMD-4082 EMDB http://www.emdatabank.org/ EMD-4083 EMDB http://www.emdatabank.org/ 5LMN Protein Data Bank (PDB) http://www.wwpdb.org/ 5LMO PDB http://www.wwpdb.org/ 5LMP PDB http://www.wwpdb.org/ 5LMQ PDB http://www.wwpdb.org/ 5LMR PDB http://www.wwpdb.org/ 5LMS PDB http://www.wwpdb.org/ 5LMT PDB http://www.wwpdb.org/ 5LMU PDB http://www.wwpdb.org/ 5LMV PDB http://www.wwpdb.org/ Experimental Models: Organisms/Strains Escherichia coli BL21(DE3) Invitrogen Cat#C600003 Thermus thermophilus N/A Escherichia coli K12 N/A Recombinant DNA pBStRNA Y f Met Schmitt et al., 1998 N/A pET13a Gerchman et al., 1994 N/A pET30a Merck Millipore, Novagen Cat#69909 Sequence-Based Reagents mRNA sequence: 5′GCUCUUUUAACAAUUUAUCAGGCAAGGAGGUAAAA AUG UUCA-3′ Integrated DNA Technologies N/A Software and Algorithms MotionCorr Li et al., 2013 http://cryoem.ucsf.edu/software/driftcorr.html CTFFIND3 Mindell and Grigorieff, 2003 http://grigoriefflab.janelia.org/ctf Relion-1.4 Scheres, 2012 http://www2.mrc-lmb.cam.ac.uk/relion/index.php/Main_Page Eman2 Tang et al., 2007 http://blake.bcm.edu/emanwiki/EMAN2 Chimera Pettersen et al., 2004 https://www.cgl.ucsf.edu/chimera/ Coot v0.8 Emsley et al., 2010 http://www2.mrc-lmb.cam.ac.uk/personal/pemsley/coot/ Refmac v5.8 Brown et al., 2015 https://www2.mrc-lmb.cam.ac.uk/groups/murshudov/content/refmac/refmac.html Molprobity Chen et al., 2010 http://molprobity.biochem.duke.edu/ Pymol DeLano, 2006 http://www.pymol.org Contact for Reagents and Resource Sharing Further information ad requests for reagents may be directed to, and will be fulfilled by the corresponding author V. Ramakrishnan ( ramak@mrc-lmb.cam.ac.uk ).
Experimental Model and Subject Details
Thermus thermophilus (strain HB8) was grown in ATCC 697 medium consisting of yeast extract, polypeptone peptone, sodium chloride and agar; and adjusted to pH 7.5. The ATCC 697 medium was supplemented with Castenholz salts and the cells were grown under vigorous aeration at 72-75°C in the University of Georgia fermentation facility. Methods Details Purification of Ribosomes, mRNA, tRNA, and Initiation Factors The complete purification of Thermus thermophilus 30S ribosomes ( McCutcheon et al., 1999 ) was done at 0-4°C and all buffers contained 6 mM 2-mercaptoethanol, 0.1 mM benzamidine and 0.5 mM phenyl-methyl-sulfonyl fluoride added just before use. The cells were resuspended in buffer (20 mM HEPES, pH 7.5, 10.5 mM Mg(OAc) 2 , 100 mM NH 4 Cl and 0.5 mM EDTA). The cells were passed through the cell disrupter (Emulsiflex) once at 25,000 Psi and the cell lysate was run (centrifugation) in a 45Ti rotor for 30 min at 30,000 rpm. After the spin, the supernatant was carefully collected without disturbing the pellet consisting of cell debris and layered over a sucrose cushion (1.1 M sucrose, 500 mM KCl, 10.5 mM Mg(OAc) 2 , 0.5 mM EDTA and 20 mM HEPES, pH 7.5 in 45Ti tubes. The ribosomes were pelleted overnight at 43,000 rpm for 18.5 hr. The supernatant was removed and the pellet obtained contained ribosomes. The pellet was washed with buffer (1.5 M (NH 4 ) 2 SO 4 , 10 mM Mg(OAc) 2 , 400 mM KCl and 20 mM Tris-Cl, pH 7.5) and then resuspended and loaded onto Toyopearl butyl-650S column equilibrated with the same buffer. The 70S was eluted by an inverse gradient of (NH 4 ) 2 SO 4 . The fractions containing 70S were collected, pooled and pelleted overnight at 43,000 rpm for 18.5 hr in a sucrose cushion. The 70S pellet was resuspended and loaded on 15%–30% sucrose gradient. This gradient was centrifuged in SW28 rotor at 20,000 rpm for 20.5 hr. After the run, the gradient was fractionated and the 70S containing fractions were collected. Care was taken to remove any 50S containing fractions. The 70S containing fractions were again pelleted overnight at 43,000 rpm for 18.5 hr in a sucrose cushion. The purified 70S was then resuspended in a buffer with only 2.25 mM Mg(OAc) 2 and loaded on 10%–30% sucrose gradient. This gradient was centrifuged in SW28 rotor at 28,500 rpm for 19 hr to separate out 30S and 50S peaks. After the run, the gradient was fractionated and the 30S containing fractions were collected. Care was taken to remove any 50S containing fractions. The purified 30S was buffer exchanged to a storage buffer (5 mM HEPES, pH 7.5, 50 mM KCl, 10 mM NH 4 Cl and 10 mM Mg(OAc) 2 and stored as small aliquots in −80°C after flash freezing in liquid nitrogen. The mRNA oligonucleotide was purchased from Integrated DNA Technologies. The sequence of mRNA was 5′GCUCUUUUAACAAUUUAUCAGGCAAGGAGGUAAAA AUG UUCA-3′ (the codon for fMet is underlined). This sequence is modified from that of Z4C in ( Yusupova et al., 2001 ). The cells overexpressing fMet-tRNA ( Schmitt et al., 1998 , Selmer et al., 2006 ) were grown in LB broth and collected after 16 hr. The pellet was resuspended in lysis buffer (1mM Tris-HCl pH 7.5 and 10mM Mg(OAc) 2 ) and routine phenol extraction was performed where the tRNA was ethanol precipitated in the final step. The precipitate was dissolved in Q-sepharose buffer (20 mM tris pH 7.5, 8 mM MgCl 2 , 200mM NaCl and 0.1 mM EDTA) and loaded on Q-sepharose column [pre-equilibrated with the same buffer. The tRNA was eluted with an increasing gradient of NaCl and the fractions containing the tRNA were pooled and dialyzed in the aminoacylation buffer (20 mM tris pH 7.5, 7 mM MgCl 2 and 150 mM KCl). The tRNA was charged with methionine using methionyl-tRNA synthetase at 37°C for 30 min. The aminoacylation reaction mixture contained 4mM ATP and 200 μM Met. The charged tRNA was formylated with a formyl donor (N 5 -N 10 -methenyl-tetrahydrofolic acid) at a final concentration of 250 μM by addition of 5μM formylase (Methionyl tRNA f Met formyl transferase). This reaction was allowed for 30 min at 37°C and then quenched by ethanol precipitation. The formylmethionyl-tRNA pellet was dissolved in buffer containing 10mM NH 4 OAc pH 6.3 and 1.7M (NH 4 ) 2 SO 4 and loaded on TSK Phenyl 5PW column equilibrated with the same buffer. The formylmethionyl-tRNA was eluted with an inverse gradient of (NH 4 ) 2 SO 4 . The fractions containing the purified formylmethionyl-tRNA was pooled and dialyzed against storage buffer (10mM NH 4 OAc pH 4.5 and 50mM KCl). Small aliquots were made and flash frozen in liquid nitrogen and stored in −80°C. IF1 was expressed ( Carter et al., 2001 ) in BL21(DE3) cells grown to A600 = 0.6. The cells were induced with 0.4 mM IPTG and grown for another 3 hr. The cells were collected by centrifugation at 4200 rpm for 20 min and resuspended in lysis buffer (50 mM Tris pH 8.0, 1mM EDTA and protease inhibitor tablet from Roche) and cells were sonicated. The cell lysate was incubated at 65°C to precipitate out the Escherichia coli proteins. The precipitate was removed by centrifugation at 20,000 rpm for 30 min. The supernatant, which largely contained IF1 was diluted with ion-exchange loading buffer (50 mM MES pH 6.8, 50 mM KCl and 1 mM DTT) and loaded on an ion-exchange column. The protein was eluted by an increasing KCl gradient. The fractions containing IF1 were collected, pooled and diluted with buffer without KCl and loaded on hydroxylapatite column at pH 6.5. The protein was again eluted by KCl gradient and the fractions containing IF1 were pooled. Finally purified IF1 was buffer exchanged to storage buffer (30 mM HEPES-KOH pH 7.5, 100 mM KCl, 1 mM DTT) and stored as small aliquots in −80°C after flash freezing in liquid nitrogen. The same protocol was used for expression and purification of IF3. His-tagged IF2 was overexpressed using the T7 expression system (modified pET30a to include a TEV cleavage site) by inducing BL21(DE3) with 1 mM IPTG cells for 4 hr. The cells were collected and resuspended in lysis buffer (0.1 M Tris pH 8, 500 mM KCl, 5 mM BME and Roche protease inhibitor tablet) and cell lysis was carried out by sonication. The sonicated cell lysate was incubated for 30 min at 65°C. Most of the endogenous proteins precipitated and were removed by centrifugation at 10,000 rpm for 25 min. Imidazole was added to supernatant (containing IF2) to 20 mM and pH was adjusted to ∼7.5. It was then loaded onto a Ni-NTA column pre-equilibrated with Ni-NTA loading buffer (50 mM HEPES pH 7.6, 20 mM imidazole, 500 mM KCl and 5 mM BME). The protein was eluted by imidazole gradient and fractions containing IF2 were pooled. The TEV protease was added to remove the N-terminal tag and dialyzed overnight into 50 mM HEPES-KOH pH 7.5, 5 mM BME without KCl. Next, it was loaded onto HiTrap Q column pre-equilibrated with 50 mM HEPES-KOH pH 7.5, 25 mM KCl and 1 mM DTT. IF2 was eluted with a KCl gradient and the fractions containing IF2 were pooled and buffer exchanged to storage buffer (30 mM HEPES-KOH pH 7.5, 30 mM NH4Cl, 5 mM Mg(OAc) 2 , and 1 mM DTT). It was frozen as small aliquots in liquid nitrogen and stored −80°C till further use. Reconstitution of Bacterial Initiation Complexes A complex at 120 nM (Sample1) was reconstituted by mixing T. thermophilus 30S, IF1, IF3, mRNA and fMet-tRNA, in molar ratio of 1:4:4:3:3, in buffer (5 mM HEPES pH 7.5, 10 mM MgAc, 50 mM KCl, 10 mM NH 4 Cl, 6 mM 2-mercaptoethanol). A second complex (Sample2) at 100 nM was prepared by additionally including IF2. In this case, IF2 was preincubated with GDPCP (0.2 mM) and mixed in 30S:IF1:IF2:IF3:tRNA:mRNA molar ratios of 1:3:3:3:3:3, in buffer (10 mM MES pH 6.5, 5 mM MgOAc, 50 mM KCL, 10 mM NH4Cl, 6 mM BME). The samples were used directly to make cryo-EM grids without further purification. Electron Microscopy 3 μl of each complex were applied onto glow-discharged Quantifoil R2/2 cryo-EM grids covered with continuous carbon (of around 50 Å thick) at 4°C and 100% ambient humidity. After a 30 s incubation, the grids were blotted for 3-3.5 s and vitrified in liquid ethane using a Vitrobot Mk3 (FEI). Automated data acquisitions (EPU software, FEI) were done on Tecnai F30 Polara and Titan Krios microscopes (FEI) at 300 kV for the Sample1 dataset and the Sample2 (IF2-containing dataset), respectively. For the Sample1 dataset, images of 1.1 s/exposure and 17 movie frames were recorded on a Falcon III direct electron detector (FEI) at a calibrated magnification of 104,478 (yielding a pixel size of 1.34 Å). For the Sample2 dataset, images of 1.5 s/exposure and 25 movie frames were recorded on a Falcon II direct electron detector (FEI) at a calibrated magnification of 104,478, resulting in a pixel size of 1.34 Å. For both datasets, dose rates of 27-30 electrons per Å 2 per second and ranges from 1.5 to 3.0 μm defocus values were used. Micrographs that showed noticeable signs of astigmatism or drift were discarded.
Image Processing and Structure Determination
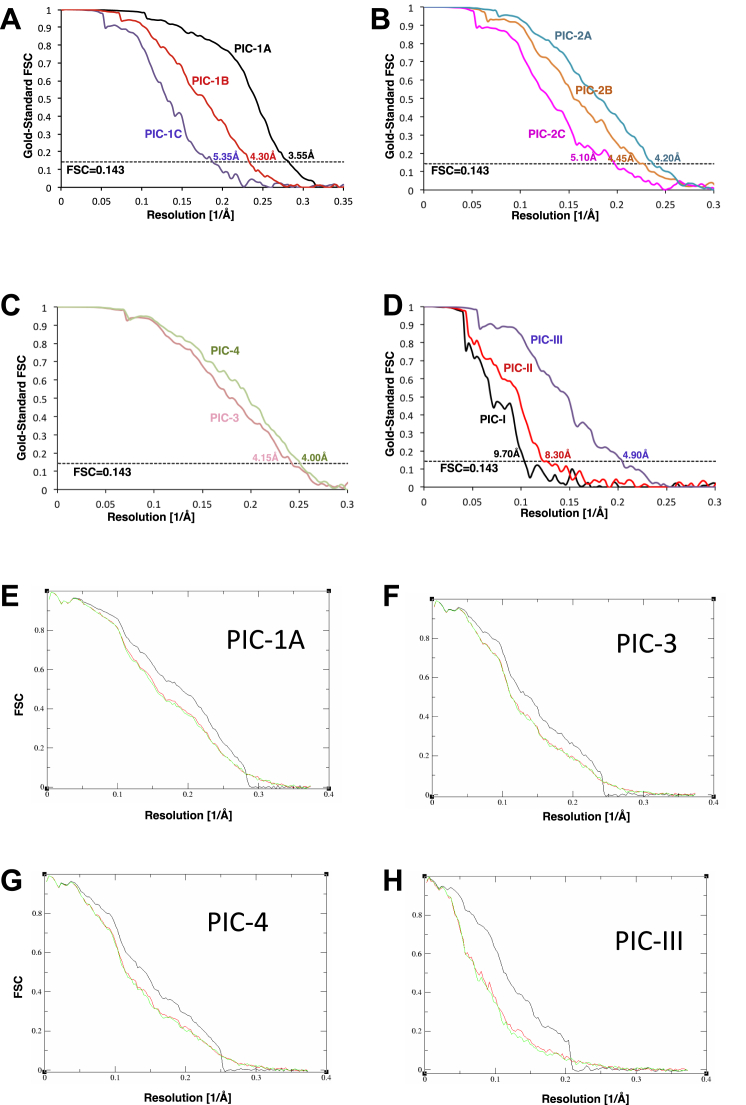
The movie frames were aligned with MOTIONCORR ( Li et al., 2013 ) for whole-image motion correction. Contrast transfer function parameters for the micrographs were estimated using CTFFIND3 ( Mindell and Grigorieff, 2003 ). Particles were picked using RELION ( Scheres, 2012 ). References for template-based particle picking ( Scheres, 2015 ) were obtained from 2D class averages that were calculated from particles picked with EMAN2 ( Tang et al., 2007 ) from a subset of the micrographs. 2D class averaging, 3D classification and refinements were done using RELION-1.4 ( Scheres, 2012 ). Sample 1 For the Sample1 dataset about 4400 images were recorded from five independent data acquisition sessions, and 666,610 particles were selected after two-dimensional classification. The crystal structure of the 30S of T. thermophilus bound to IF1 (PDB: 1HR0 ) low-pass filtered to 40 Å was used as an initial model for the three-dimensional refinement. After an initial 3D refinement, two consecutive rounds of 3D classification with fine angular sampling and local searches were performed to remove bad particles/empty 30S particles from the data and to get an initial understanding of the conformational heterogeneity of the sample. In the second round of 3D classification, only 3 classes were selected (303,344 particles, 46% of the total) and refined to high resolution. The preliminary 3D rounds of classification showed 30S in different conformations and tentative positions of IFs and tRNA. Next, we decided to apply a strategy based on the recently reported method of masked classifications with subtraction of the residual signal ( Bai et al., 2015 ), by creating a mask hereafter termed as ‘ligands mask’ based on the densities attributed to the tRNA and IFs in all possible conformations observed in preliminary 3D classification rounds. We used a ‘focused’ 3D classification with this mask to isolate three well-defined types of complexes: A) Class A showing presence of mRNA, IF1 and IF3 (in Position1) without tRNA [162,654 particles], B) Class B showing density for mRNA, tRNA, IF1 and IF3 (in Position1) [56,962 particles], and C) Class C containing mRNA, tRNA, IF1 and IF3 (in Position2 in low occupancy) [83,728 particles]. Class ‘A’ (30S with mRNA, IF1 and IF3 without tRNA) was further classified by standard 3D classification in three classes: 1) 30S in a closed conformation (PIC-1A: 86,892 particles, 3.55 Å) 2) 30S in a closed conformation but with head swiveled (PIC-1B: 57,382 particles, 4.3 Å) and 3) 30S in an open conformation (PIC-1C: 18,380 particles, 5.35 Å). Class B (30S with mRNA, tRNA, IF1 and in Position1) was also further classified in 3 classes as: 1) 30S in an open conformation (PIC-2A: 31,888 particles, 4.2 Å), 2) 30S in a closed conformation but with head swiveled (PIC-2B: 17,176 particles, 4.45 Å) and 3) 30S in a closed conformation (PIC-2C: 7,898 particles, 5.1 Å). Class C (30S with mRNA, tRNA, IF1 and in Position2) was further classified into 3 classes using ‘ligand mask’: 1) 30S PIC with mRNA, tRNA, IF1 and IF3 in Position1’ (PIC-3: 24,771 particles; 4.15 Å), 2) 30S PIC with mRNA, tRNA, and IF3 in Position2 (PIC-4: 26,949 particles; 4.0 Å) and 3) 30S PIC with mRNA and tRNA (32,008 particles; 3.8 Å; not discussed in this study) Sample 2 The Sample2 dataset contained about 3200 images and 803,433 particles were selected after 2D classification. An initial 3D refinement was done using the same reference (PDB: 1HR0 ) as in Sample1 low-pass filtered to 40 Å. Next a masked 3D classification into 10 classes was carried out. The mask around the region on the ribosome where IF2 binds (‘IF2 mask’) based on the low-resolution cryoEM structure of 30S-IF2 ( Simonetti et al., 2008 ); EMD-2448) was used for this 3D classification. Only two classes showed density for IF2 and were subsequently refined to high resolution (42,618 particles, 5.3% of the total, 4.8 Å). We followed a similar strategy of ‘focused’ 3D classification with ‘ligand mask’ to isolate three well-defined types of complexes: A) 30S with IF1, IF3 (in Position1) and mRNA without tRNA (PIC-I: 7,431, 9.7 Å), B) 30S with IF1, IF3 (in Position1), mRNA and tRNA (PIC-II: 8,423 particles, 8.3 Å), and C) 30S with IF1, IF3 (in Position2), mRNA and tRNA (PIC-III: 26,324 particles 4.9 Å). Both movie processing ( Bai et al., 2013 ) in RELION-1.4 and particle “polishing” ( Scheres, 2014 ) was performed for all selected particles for 3Drefinement. Resolutions reported here are based on the gold-standard FSC = 0.143 criterion ( Scheres and Chen, 2012 ). All maps were further processed for the modulation transfer function of the detector, and sharpened by applying negative B factors estimated using automated procedures ( Rosenthal and Henderson, 2003 ). Local resolution was estimated using Relion. Naming of Complexes Maps of PICs obtained from Sample1 (i.e., without IF2) are named from PIC-1 to 4. Maps of PICs obtained from Sample2 (with IF2) are named as PIC-I to III.) The various PIC structures are named in an order that represents one possible initiation pathway in which mRNA binding precedes tRNA binding. The primary criterion for ordering the structures was to minimize compositional and conformational differences between successive states (see below for details). In such an “mRNA-first” pathway, at least one of the tRNA-free states must occur first, and the final state must be the one with a tRNA fully accommodated in the 30S P site, where “fully accommodated” is defined by comparing with other reported structures. Things taken into consideration while naming the complexes: 1) 30S conformation: open/closed conformations and swivel of the head 2) Presence or absence of tRNA & its accommodation in the P site 3) IF3-CTD position and conformational changes like position of its β- hairpin relative to ASL 4) Must be more closely related to the previous state or subsequent state than the other complexes 5) Must result in a consistent and reasonable pathway for initiation with minimal conformational excursions Sample 1 PIC-1A contains 30S, IF1, IF3 and mRNA. IF1 is at the A site. IF3- NTD is at the platform while the CTD is at the P site (Position1). The 30S is in the closed conformation with compressed h28. The 30S head is observed in canonical position as in 70S ribosomes ( Selmer et al., 2006 ). The P site is incompatible for the loading of tRNA as it will have a steric hindrance with CTD in Position1. PIC-1B contains 30S, IF1, IF3 and mRNA. IF1 is at the A site. IF3- NTD is at the platform while the CTD is at the P site (Position1). The 30S is in the closed conformation but h28 is relaxed and the 30S head is swiveled. The P site would be compatible for the loading of tRNA with minor rearrangements. However, the mRNA latch is closed and the P site is narrow. PIC-1C contains 30S, IF1, IF3 and mRNA. IF1 is at the A site. IF3- NTD is at the platform while the CTD is at the P site (Position1). The 30S is in the open conformation with relaxed h28 and the head is not swiveled. The P site is compatible for the loading of tRNA due to the presence of a widened P site with no obstruction from CTD at Position1. PIC-2A contains 30S, IF1, IF3, mRNA and fMet-tRNA fMet . IF1 is at the A site. IF3- NTD is away from platform and now in contact with elbow of fMet-tRNA fMet while the CTD is at the P site (Position1). The 30S is in the open conformation with a relaxed h28 and the head is not swiveled. The P site is widened. The ASL is tilted away from the 30S body. The CTD is in Position1 with a subtle movement of β- hairpin of IF3 away from ASL. PIC-2B contains 30S, IF1, IF3, mRNA and fMet-tRNA fMet . IF1 is at the A site. IF3- NTD is away from platform and in contact with elbow of fMet-tRNA fMet while the CTD is at the P site (Position1). The 30S is in the closed conformation but h28 is still relaxed and the 30S head is swiveled. The P site is relatively narrowed. The ASL is moved toward the E site. The CTD is in Position1. We have named it as PIC-2B after PIC-2A because a head swivel in PIC-2A would enable the PIC-2B conformation. PIC-2C contains 30S, IF1, IF3, mRNA and fMet-tRNA fMet . IF1 is at the A site. IF3- NTD is away from platform and now is contact with elbow of fMet-tRNA fMet while the CTD is at the P site (Position1). The 30S head is observed in the canonical conformation as in 70S ribosomes ( Selmer et al., 2006 ). The 30S is in closed conformation with h28 compressed. The P site is now narrow. The ASL shows a small tilt toward the body. The CTD is in Position1 with a movement of the β- hairpin of IF3 away from ASL. This movement of the β- hairpin is more than that observed in PIC-2A. PIC-3 contains 30S, IF1, IF3, mRNA and fMet-tRNA fMet . IF1 is at the A site. IF3- NTD is away from platform and in contact with elbow of fMet-tRNA fMet while the CTD is relocated to a slightly different position at the P site (Position1’). The 30S head is observed in canonical position as in 70S ribosomes ( Selmer et al., 2006 ). The 30S is in the closed conformation with h28 compressed. The P site is narrow. The ASL is more accommodated in the P site with a tilt toward the body. The CTD is repositioned to Position1′. PIC-4 contains 30S, IF3, mRNA and fMet-tRNA fMet . IF3-NTD is away from the platform and in contact with elbow of fMet-tRNA fMet while the CTD is relocated away from the P site (Position2). The 30S head is observed in canonical position as in 70S ribosomes ( Selmer et al., 2006 ). The 30S is in the closed conformation with h28 compressed. The P site is narrow. The ASL is most accommodated in this PIC with a maximum tilt toward the body. The CTD is moved to Position2. Sample 2 PIC-I contains 30S, IF1, IF2, IF3 and mRNA. IF1 is at the A site. IF3- NTD is on the platform while the CTD is at the P site (Position1). The 30S head is observed in canonical position as in 70S ribosomes ( Selmer et al., 2006 ). PIC-II contains 30S, IF1, IF2, IF3, mRNA and fMet-tRNA fMet . IF1 is at the A site. IF3- NTD is away from platform and in contact with elbow of fMet-tRNA fMet while the CTD is at the P site (Position1). PIC-III contains 30S, IF1, IF2, IF3, mRNA and fMet-tRNA fMet . IF1 is at the A site. IF3- NTD is in contact with elbow of fMet-tRNA fMet while the CTD is relocated away from P site (Position2). The 30S head is observed in canonical position as in 70S ribosomes ( Selmer et al., 2006 ). Model Building, Validation, and Refinement The initial model building was done in EM maps with best resolution for the 30S, mRNA or tRNA and for specific IFs. Then this model was used as a reference for model building in EM maps with lower resolution. The head and the body of the atomic model of 30S of T. thermophilus (PDB: 1HR0 ) ( Carter et al., 2001 ) were placed independently into density of each class by rigid-body fitting using Chimera ( Pettersen et al., 2004 ). Next, the crystal structures of IF1 (PDB: 1HR0 ) ( Carter et al., 2001 ), the N and C-terminal domains of Geobacillus stearothermophilus IF3 (PDB: 1TIF and PDB: 1TIG ) ( Biou et al., 1995 ), T. thermophilus IF2 (PDBs: 3J4J and PDB: 4KJZ ) ( Simonetti et al., 2013 ) ( Eiler et al., 2013 ) and tRNA (PDB: 4WZO ) ( Rozov et al., 2015 ) were docked into density using Chimera. Then, each chain of the model (including ribosomal proteins, rRNA segments, protein factors and tRNA and mRNA) was rigid-body fitted in Coot ( Emsley et al., 2010 ) and further model building was also done in Coot v0.8. The availability of crystal structures of N and C-terminal domains of IF3 (PDB: 1TIF and PDB: 1TIG ) helped in the model building almost complete IF3 (residue 3 to 170) with the helical linker joining the two domains. Special attention was devoted toward modeling of domain C2 of IF2. Rigid body fitting the NMR structure of C2 of IF2 from Bacillus stearothermophilus (PDB: 1D1N ) ( Meunier et al., 2000 ) was carried out into the density. Orientation of the C2 domain agrees with previous biochemical data ( Guenneugues et al., 2000 ). It is also in agreement with EM data of its eukaryotic homolog eIF5B ( Yamamoto et al., 2014 ) and with the orientation of C2 resulting from the superimposition on domain C1 of the crystal structure of its archaeal counterpart (PDB: 1G7T ) ( Meunier et al., 2000 ). In PIC-III, CCA of tRNA and fMet were taken from (PDB: 1ZO1 ) ( Sprink et al., 2016 ). Refinement for all but PICs-I and II was carried out in Refmac v5.8 optimized for electron microscopy ( Brown et al., 2015 ), using external restraints generated by ProSMART and LIBG ( Brown et al., 2015 ). Average FSC was monitored during refinement. Final model was validated using MolProbity ( Chen et al., 2010 ). Cross-validation against overfitting was calculated as previously described ( Brown et al., 2015 , Amunts et al., 2014 ). Refinement statistics are given in Table S1 . All figures were generated using PyMOL ( DeLano, 2006 ) or Chimera.
Quantification and Statistical Analysis
IF1 concentration was measured by the method of Bradford using commercial reagent from Bio-Rad and bovine serum albumin as a standard. For accurate estimation of the molar concentration of IF2 and IF3, these proteins were quantitated from its optical absorption at 280 nm, using an A 280 1% of 4.10 and 5.77, respectively. The molar absorption value was estimated from the amino acid sequences, using the ProtParam tool of the Expasy database. The 30S ribosomal subunit was measured by its optical absorption at 260 nm. Resolutions reported here are based on the gold-standard FSC = 0.143 criterion ( Scheres and Chen, 2012 ). All maps were further processed for the modulation transfer function of the detector, and sharpened by applying negative B factors estimated using automated procedures ( Rosenthal and Henderson, 2003 ). Local resolution was also estimated using Relion, using masks of 4 Å around the region of interest, and the same gold-standard FSC = 0.143 criterion. Refinement statistics for each structure, including average FSCs were obtained by Refmac v5.8, optimized for electron microscopy ( Brown et al., 2015 ). Validation statistics were obtained by using MolProbity ( Chen et al., 2010 ). The 30S head rotation was measured by using h28 (at the neck) as rotation axis and C1030b, at the 30S beak, as the reference point. Data and Software Availability Data Resources Eleven maps have been deposited in the EMDB with accession codes EMDB: 4073, EMDB: 4074, EMDB: 4075, EMDB: 4076, EMDB: 4077, EMDB: 4078, EMDB: 4079, EMDB: 4080, EMDB: 4081, EMDB: 4082 and EMDB: 4083 for PIC-1A, PIC-1B, PIC-1C, PIC-2A, PIC-2B, PIC-2C, PIC-3, PIC-4, PIC-I, PIC-II and PIC-III, respectively. Atomic coordinates have been deposited in the PDB with accession codes PDB: 5LMN , PDB: 5LMO , PDB: 5LMP , PDB: 5LMQ , PDB: 5LMR , PDB: 5LMS , PDB: 5LMT , PDB: 5LMU and PDB: 5LMV for PIC-1A, PIC-1B, PIC-1C, PIC-2A, PIC-2B, PIC-2C, PIC-3, PIC-4 and PIC-III, respectively.
Experimental Model and Subject Details
Thermus thermophilus (strain HB8) was grown in ATCC 697 medium consisting of yeast extract, polypeptone peptone, sodium chloride and agar; and adjusted to pH 7.5. The ATCC 697 medium was supplemented with Castenholz salts and the cells were grown under vigorous aeration at 72-75°C in the University of Georgia fermentation facility.
Methods Details Purification of Ribosomes, mRNA, tRNA, and Initiation Factors The complete purification of Thermus thermophilus 30S ribosomes ( McCutcheon et al., 1999 ) was done at 0-4°C and all buffers contained 6 mM 2-mercaptoethanol, 0.1 mM benzamidine and 0.5 mM phenyl-methyl-sulfonyl fluoride added just before use. The cells were resuspended in buffer (20 mM HEPES, pH 7.5, 10.5 mM Mg(OAc) 2 , 100 mM NH 4 Cl and 0.5 mM EDTA). The cells were passed through the cell disrupter (Emulsiflex) once at 25,000 Psi and the cell lysate was run (centrifugation) in a 45Ti rotor for 30 min at 30,000 rpm. After the spin, the supernatant was carefully collected without disturbing the pellet consisting of cell debris and layered over a sucrose cushion (1.1 M sucrose, 500 mM KCl, 10.5 mM Mg(OAc) 2 , 0.5 mM EDTA and 20 mM HEPES, pH 7.5 in 45Ti tubes. The ribosomes were pelleted overnight at 43,000 rpm for 18.5 hr. The supernatant was removed and the pellet obtained contained ribosomes. The pellet was washed with buffer (1.5 M (NH 4 ) 2 SO 4 , 10 mM Mg(OAc) 2 , 400 mM KCl and 20 mM Tris-Cl, pH 7.5) and then resuspended and loaded onto Toyopearl butyl-650S column equilibrated with the same buffer. The 70S was eluted by an inverse gradient of (NH 4 ) 2 SO 4 . The fractions containing 70S were collected, pooled and pelleted overnight at 43,000 rpm for 18.5 hr in a sucrose cushion. The 70S pellet was resuspended and loaded on 15%–30% sucrose gradient. This gradient was centrifuged in SW28 rotor at 20,000 rpm for 20.5 hr. After the run, the gradient was fractionated and the 70S containing fractions were collected. Care was taken to remove any 50S containing fractions. The 70S containing fractions were again pelleted overnight at 43,000 rpm for 18.5 hr in a sucrose cushion. The purified 70S was then resuspended in a buffer with only 2.25 mM Mg(OAc) 2 and loaded on 10%–30% sucrose gradient. This gradient was centrifuged in SW28 rotor at 28,500 rpm for 19 hr to separate out 30S and 50S peaks. After the run, the gradient was fractionated and the 30S containing fractions were collected. Care was taken to remove any 50S containing fractions. The purified 30S was buffer exchanged to a storage buffer (5 mM HEPES, pH 7.5, 50 mM KCl, 10 mM NH 4 Cl and 10 mM Mg(OAc) 2 and stored as small aliquots in −80°C after flash freezing in liquid nitrogen. The mRNA oligonucleotide was purchased from Integrated DNA Technologies. The sequence of mRNA was 5′GCUCUUUUAACAAUUUAUCAGGCAAGGAGGUAAAA AUG UUCA-3′ (the codon for fMet is underlined). This sequence is modified from that of Z4C in ( Yusupova et al., 2001 ). The cells overexpressing fMet-tRNA ( Schmitt et al., 1998 , Selmer et al., 2006 ) were grown in LB broth and collected after 16 hr. The pellet was resuspended in lysis buffer (1mM Tris-HCl pH 7.5 and 10mM Mg(OAc) 2 ) and routine phenol extraction was performed where the tRNA was ethanol precipitated in the final step. The precipitate was dissolved in Q-sepharose buffer (20 mM tris pH 7.5, 8 mM MgCl 2 , 200mM NaCl and 0.1 mM EDTA) and loaded on Q-sepharose column [pre-equilibrated with the same buffer. The tRNA was eluted with an increasing gradient of NaCl and the fractions containing the tRNA were pooled and dialyzed in the aminoacylation buffer (20 mM tris pH 7.5, 7 mM MgCl 2 and 150 mM KCl). The tRNA was charged with methionine using methionyl-tRNA synthetase at 37°C for 30 min. The aminoacylation reaction mixture contained 4mM ATP and 200 μM Met. The charged tRNA was formylated with a formyl donor (N 5 -N 10 -methenyl-tetrahydrofolic acid) at a final concentration of 250 μM by addition of 5μM formylase (Methionyl tRNA f Met formyl transferase). This reaction was allowed for 30 min at 37°C and then quenched by ethanol precipitation. The formylmethionyl-tRNA pellet was dissolved in buffer containing 10mM NH 4 OAc pH 6.3 and 1.7M (NH 4 ) 2 SO 4 and loaded on TSK Phenyl 5PW column equilibrated with the same buffer. The formylmethionyl-tRNA was eluted with an inverse gradient of (NH 4 ) 2 SO 4 . The fractions containing the purified formylmethionyl-tRNA was pooled and dialyzed against storage buffer (10mM NH 4 OAc pH 4.5 and 50mM KCl). Small aliquots were made and flash frozen in liquid nitrogen and stored in −80°C. IF1 was expressed ( Carter et al., 2001 ) in BL21(DE3) cells grown to A600 = 0.6. The cells were induced with 0.4 mM IPTG and grown for another 3 hr. The cells were collected by centrifugation at 4200 rpm for 20 min and resuspended in lysis buffer (50 mM Tris pH 8.0, 1mM EDTA and protease inhibitor tablet from Roche) and cells were sonicated. The cell lysate was incubated at 65°C to precipitate out the Escherichia coli proteins. The precipitate was removed by centrifugation at 20,000 rpm for 30 min. The supernatant, which largely contained IF1 was diluted with ion-exchange loading buffer (50 mM MES pH 6.8, 50 mM KCl and 1 mM DTT) and loaded on an ion-exchange column. The protein was eluted by an increasing KCl gradient. The fractions containing IF1 were collected, pooled and diluted with buffer without KCl and loaded on hydroxylapatite column at pH 6.5. The protein was again eluted by KCl gradient and the fractions containing IF1 were pooled. Finally purified IF1 was buffer exchanged to storage buffer (30 mM HEPES-KOH pH 7.5, 100 mM KCl, 1 mM DTT) and stored as small aliquots in −80°C after flash freezing in liquid nitrogen. The same protocol was used for expression and purification of IF3. His-tagged IF2 was overexpressed using the T7 expression system (modified pET30a to include a TEV cleavage site) by inducing BL21(DE3) with 1 mM IPTG cells for 4 hr. The cells were collected and resuspended in lysis buffer (0.1 M Tris pH 8, 500 mM KCl, 5 mM BME and Roche protease inhibitor tablet) and cell lysis was carried out by sonication. The sonicated cell lysate was incubated for 30 min at 65°C. Most of the endogenous proteins precipitated and were removed by centrifugation at 10,000 rpm for 25 min. Imidazole was added to supernatant (containing IF2) to 20 mM and pH was adjusted to ∼7.5. It was then loaded onto a Ni-NTA column pre-equilibrated with Ni-NTA loading buffer (50 mM HEPES pH 7.6, 20 mM imidazole, 500 mM KCl and 5 mM BME). The protein was eluted by imidazole gradient and fractions containing IF2 were pooled. The TEV protease was added to remove the N-terminal tag and dialyzed overnight into 50 mM HEPES-KOH pH 7.5, 5 mM BME without KCl. Next, it was loaded onto HiTrap Q column pre-equilibrated with 50 mM HEPES-KOH pH 7.5, 25 mM KCl and 1 mM DTT. IF2 was eluted with a KCl gradient and the fractions containing IF2 were pooled and buffer exchanged to storage buffer (30 mM HEPES-KOH pH 7.5, 30 mM NH4Cl, 5 mM Mg(OAc) 2 , and 1 mM DTT). It was frozen as small aliquots in liquid nitrogen and stored −80°C till further use. Reconstitution of Bacterial Initiation Complexes A complex at 120 nM (Sample1) was reconstituted by mixing T. thermophilus 30S, IF1, IF3, mRNA and fMet-tRNA, in molar ratio of 1:4:4:3:3, in buffer (5 mM HEPES pH 7.5, 10 mM MgAc, 50 mM KCl, 10 mM NH 4 Cl, 6 mM 2-mercaptoethanol). A second complex (Sample2) at 100 nM was prepared by additionally including IF2. In this case, IF2 was preincubated with GDPCP (0.2 mM) and mixed in 30S:IF1:IF2:IF3:tRNA:mRNA molar ratios of 1:3:3:3:3:3, in buffer (10 mM MES pH 6.5, 5 mM MgOAc, 50 mM KCL, 10 mM NH4Cl, 6 mM BME). The samples were used directly to make cryo-EM grids without further purification. Electron Microscopy 3 μl of each complex were applied onto glow-discharged Quantifoil R2/2 cryo-EM grids covered with continuous carbon (of around 50 Å thick) at 4°C and 100% ambient humidity. After a 30 s incubation, the grids were blotted for 3-3.5 s and vitrified in liquid ethane using a Vitrobot Mk3 (FEI). Automated data acquisitions (EPU software, FEI) were done on Tecnai F30 Polara and Titan Krios microscopes (FEI) at 300 kV for the Sample1 dataset and the Sample2 (IF2-containing dataset), respectively. For the Sample1 dataset, images of 1.1 s/exposure and 17 movie frames were recorded on a Falcon III direct electron detector (FEI) at a calibrated magnification of 104,478 (yielding a pixel size of 1.34 Å). For the Sample2 dataset, images of 1.5 s/exposure and 25 movie frames were recorded on a Falcon II direct electron detector (FEI) at a calibrated magnification of 104,478, resulting in a pixel size of 1.34 Å. For both datasets, dose rates of 27-30 electrons per Å 2 per second and ranges from 1.5 to 3.0 μm defocus values were used. Micrographs that showed noticeable signs of astigmatism or drift were discarded.
Image Processing and Structure Determination
The movie frames were aligned with MOTIONCORR ( Li et al., 2013 ) for whole-image motion correction. Contrast transfer function parameters for the micrographs were estimated using CTFFIND3 ( Mindell and Grigorieff, 2003 ). Particles were picked using RELION ( Scheres, 2012 ). References for template-based particle picking ( Scheres, 2015 ) were obtained from 2D class averages that were calculated from particles picked with EMAN2 ( Tang et al., 2007 ) from a subset of the micrographs. 2D class averaging, 3D classification and refinements were done using RELION-1.4 ( Scheres, 2012 ). Sample 1 For the Sample1 dataset about 4400 images were recorded from five independent data acquisition sessions, and 666,610 particles were selected after two-dimensional classification. The crystal structure of the 30S of T. thermophilus bound to IF1 (PDB: 1HR0 ) low-pass filtered to 40 Å was used as an initial model for the three-dimensional refinement. After an initial 3D refinement, two consecutive rounds of 3D classification with fine angular sampling and local searches were performed to remove bad particles/empty 30S particles from the data and to get an initial understanding of the conformational heterogeneity of the sample. In the second round of 3D classification, only 3 classes were selected (303,344 particles, 46% of the total) and refined to high resolution. The preliminary 3D rounds of classification showed 30S in different conformations and tentative positions of IFs and tRNA. Next, we decided to apply a strategy based on the recently reported method of masked classifications with subtraction of the residual signal ( Bai et al., 2015 ), by creating a mask hereafter termed as ‘ligands mask’ based on the densities attributed to the tRNA and IFs in all possible conformations observed in preliminary 3D classification rounds. We used a ‘focused’ 3D classification with this mask to isolate three well-defined types of complexes: A) Class A showing presence of mRNA, IF1 and IF3 (in Position1) without tRNA [162,654 particles], B) Class B showing density for mRNA, tRNA, IF1 and IF3 (in Position1) [56,962 particles], and C) Class C containing mRNA, tRNA, IF1 and IF3 (in Position2 in low occupancy) [83,728 particles]. Class ‘A’ (30S with mRNA, IF1 and IF3 without tRNA) was further classified by standard 3D classification in three classes: 1) 30S in a closed conformation (PIC-1A: 86,892 particles, 3.55 Å) 2) 30S in a closed conformation but with head swiveled (PIC-1B: 57,382 particles, 4.3 Å) and 3) 30S in an open conformation (PIC-1C: 18,380 particles, 5.35 Å). Class B (30S with mRNA, tRNA, IF1 and in Position1) was also further classified in 3 classes as: 1) 30S in an open conformation (PIC-2A: 31,888 particles, 4.2 Å), 2) 30S in a closed conformation but with head swiveled (PIC-2B: 17,176 particles, 4.45 Å) and 3) 30S in a closed conformation (PIC-2C: 7,898 particles, 5.1 Å). Class C (30S with mRNA, tRNA, IF1 and in Position2) was further classified into 3 classes using ‘ligand mask’: 1) 30S PIC with mRNA, tRNA, IF1 and IF3 in Position1’ (PIC-3: 24,771 particles; 4.15 Å), 2) 30S PIC with mRNA, tRNA, and IF3 in Position2 (PIC-4: 26,949 particles; 4.0 Å) and 3) 30S PIC with mRNA and tRNA (32,008 particles; 3.8 Å; not discussed in this study) Sample 2 The Sample2 dataset contained about 3200 images and 803,433 particles were selected after 2D classification. An initial 3D refinement was done using the same reference (PDB: 1HR0 ) as in Sample1 low-pass filtered to 40 Å. Next a masked 3D classification into 10 classes was carried out. The mask around the region on the ribosome where IF2 binds (‘IF2 mask’) based on the low-resolution cryoEM structure of 30S-IF2 ( Simonetti et al., 2008 ); EMD-2448) was used for this 3D classification. Only two classes showed density for IF2 and were subsequently refined to high resolution (42,618 particles, 5.3% of the total, 4.8 Å). We followed a similar strategy of ‘focused’ 3D classification with ‘ligand mask’ to isolate three well-defined types of complexes: A) 30S with IF1, IF3 (in Position1) and mRNA without tRNA (PIC-I: 7,431, 9.7 Å), B) 30S with IF1, IF3 (in Position1), mRNA and tRNA (PIC-II: 8,423 particles, 8.3 Å), and C) 30S with IF1, IF3 (in Position2), mRNA and tRNA (PIC-III: 26,324 particles 4.9 Å). Both movie processing ( Bai et al., 2013 ) in RELION-1.4 and particle “polishing” ( Scheres, 2014 ) was performed for all selected particles for 3Drefinement. Resolutions reported here are based on the gold-standard FSC = 0.143 criterion ( Scheres and Chen, 2012 ). All maps were further processed for the modulation transfer function of the detector, and sharpened by applying negative B factors estimated using automated procedures ( Rosenthal and Henderson, 2003 ). Local resolution was estimated using Relion. Naming of Complexes Maps of PICs obtained from Sample1 (i.e., without IF2) are named from PIC-1 to 4. Maps of PICs obtained from Sample2 (with IF2) are named as PIC-I to III.) The various PIC structures are named in an order that represents one possible initiation pathway in which mRNA binding precedes tRNA binding. The primary criterion for ordering the structures was to minimize compositional and conformational differences between successive states (see below for details). In such an “mRNA-first” pathway, at least one of the tRNA-free states must occur first, and the final state must be the one with a tRNA fully accommodated in the 30S P site, where “fully accommodated” is defined by comparing with other reported structures. Things taken into consideration while naming the complexes: 1) 30S conformation: open/closed conformations and swivel of the head 2) Presence or absence of tRNA & its accommodation in the P site 3) IF3-CTD position and conformational changes like position of its β- hairpin relative to ASL 4) Must be more closely related to the previous state or subsequent state than the other complexes 5) Must result in a consistent and reasonable pathway for initiation with minimal conformational excursions Sample 1 PIC-1A contains 30S, IF1, IF3 and mRNA. IF1 is at the A site. IF3- NTD is at the platform while the CTD is at the P site (Position1). The 30S is in the closed conformation with compressed h28. The 30S head is observed in canonical position as in 70S ribosomes ( Selmer et al., 2006 ). The P site is incompatible for the loading of tRNA as it will have a steric hindrance with CTD in Position1. PIC-1B contains 30S, IF1, IF3 and mRNA. IF1 is at the A site. IF3- NTD is at the platform while the CTD is at the P site (Position1). The 30S is in the closed conformation but h28 is relaxed and the 30S head is swiveled. The P site would be compatible for the loading of tRNA with minor rearrangements. However, the mRNA latch is closed and the P site is narrow. PIC-1C contains 30S, IF1, IF3 and mRNA. IF1 is at the A site. IF3- NTD is at the platform while the CTD is at the P site (Position1). The 30S is in the open conformation with relaxed h28 and the head is not swiveled. The P site is compatible for the loading of tRNA due to the presence of a widened P site with no obstruction from CTD at Position1. PIC-2A contains 30S, IF1, IF3, mRNA and fMet-tRNA fMet . IF1 is at the A site. IF3- NTD is away from platform and now in contact with elbow of fMet-tRNA fMet while the CTD is at the P site (Position1). The 30S is in the open conformation with a relaxed h28 and the head is not swiveled. The P site is widened. The ASL is tilted away from the 30S body. The CTD is in Position1 with a subtle movement of β- hairpin of IF3 away from ASL. PIC-2B contains 30S, IF1, IF3, mRNA and fMet-tRNA fMet . IF1 is at the A site. IF3- NTD is away from platform and in contact with elbow of fMet-tRNA fMet while the CTD is at the P site (Position1). The 30S is in the closed conformation but h28 is still relaxed and the 30S head is swiveled. The P site is relatively narrowed. The ASL is moved toward the E site. The CTD is in Position1. We have named it as PIC-2B after PIC-2A because a head swivel in PIC-2A would enable the PIC-2B conformation. PIC-2C contains 30S, IF1, IF3, mRNA and fMet-tRNA fMet . IF1 is at the A site. IF3- NTD is away from platform and now is contact with elbow of fMet-tRNA fMet while the CTD is at the P site (Position1). The 30S head is observed in the canonical conformation as in 70S ribosomes ( Selmer et al., 2006 ). The 30S is in closed conformation with h28 compressed. The P site is now narrow. The ASL shows a small tilt toward the body. The CTD is in Position1 with a movement of the β- hairpin of IF3 away from ASL. This movement of the β- hairpin is more than that observed in PIC-2A. PIC-3 contains 30S, IF1, IF3, mRNA and fMet-tRNA fMet . IF1 is at the A site. IF3- NTD is away from platform and in contact with elbow of fMet-tRNA fMet while the CTD is relocated to a slightly different position at the P site (Position1’). The 30S head is observed in canonical position as in 70S ribosomes ( Selmer et al., 2006 ). The 30S is in the closed conformation with h28 compressed. The P site is narrow. The ASL is more accommodated in the P site with a tilt toward the body. The CTD is repositioned to Position1′. PIC-4 contains 30S, IF3, mRNA and fMet-tRNA fMet . IF3-NTD is away from the platform and in contact with elbow of fMet-tRNA fMet while the CTD is relocated away from the P site (Position2). The 30S head is observed in canonical position as in 70S ribosomes ( Selmer et al., 2006 ). The 30S is in the closed conformation with h28 compressed. The P site is narrow. The ASL is most accommodated in this PIC with a maximum tilt toward the body. The CTD is moved to Position2. Sample 2 PIC-I contains 30S, IF1, IF2, IF3 and mRNA. IF1 is at the A site. IF3- NTD is on the platform while the CTD is at the P site (Position1). The 30S head is observed in canonical position as in 70S ribosomes ( Selmer et al., 2006 ). PIC-II contains 30S, IF1, IF2, IF3, mRNA and fMet-tRNA fMet . IF1 is at the A site. IF3- NTD is away from platform and in contact with elbow of fMet-tRNA fMet while the CTD is at the P site (Position1). PIC-III contains 30S, IF1, IF2, IF3, mRNA and fMet-tRNA fMet . IF1 is at the A site. IF3- NTD is in contact with elbow of fMet-tRNA fMet while the CTD is relocated away from P site (Position2). The 30S head is observed in canonical position as in 70S ribosomes ( Selmer et al., 2006 ). Model Building, Validation, and Refinement The initial model building was done in EM maps with best resolution for the 30S, mRNA or tRNA and for specific IFs. Then this model was used as a reference for model building in EM maps with lower resolution. The head and the body of the atomic model of 30S of T. thermophilus (PDB: 1HR0 ) ( Carter et al., 2001 ) were placed independently into density of each class by rigid-body fitting using Chimera ( Pettersen et al., 2004 ). Next, the crystal structures of IF1 (PDB: 1HR0 ) ( Carter et al., 2001 ), the N and C-terminal domains of Geobacillus stearothermophilus IF3 (PDB: 1TIF and PDB: 1TIG ) ( Biou et al., 1995 ), T. thermophilus IF2 (PDBs: 3J4J and PDB: 4KJZ ) ( Simonetti et al., 2013 ) ( Eiler et al., 2013 ) and tRNA (PDB: 4WZO ) ( Rozov et al., 2015 ) were docked into density using Chimera. Then, each chain of the model (including ribosomal proteins, rRNA segments, protein factors and tRNA and mRNA) was rigid-body fitted in Coot ( Emsley et al., 2010 ) and further model building was also done in Coot v0.8. The availability of crystal structures of N and C-terminal domains of IF3 (PDB: 1TIF and PDB: 1TIG ) helped in the model building almost complete IF3 (residue 3 to 170) with the helical linker joining the two domains. Special attention was devoted toward modeling of domain C2 of IF2. Rigid body fitting the NMR structure of C2 of IF2 from Bacillus stearothermophilus (PDB: 1D1N ) ( Meunier et al., 2000 ) was carried out into the density. Orientation of the C2 domain agrees with previous biochemical data ( Guenneugues et al., 2000 ). It is also in agreement with EM data of its eukaryotic homolog eIF5B ( Yamamoto et al., 2014 ) and with the orientation of C2 resulting from the superimposition on domain C1 of the crystal structure of its archaeal counterpart (PDB: 1G7T ) ( Meunier et al., 2000 ). In PIC-III, CCA of tRNA and fMet were taken from (PDB: 1ZO1 ) ( Sprink et al., 2016 ). Refinement for all but PICs-I and II was carried out in Refmac v5.8 optimized for electron microscopy ( Brown et al., 2015 ), using external restraints generated by ProSMART and LIBG ( Brown et al., 2015 ). Average FSC was monitored during refinement. Final model was validated using MolProbity ( Chen et al., 2010 ). Cross-validation against overfitting was calculated as previously described ( Brown et al., 2015 , Amunts et al., 2014 ). Refinement statistics are given in Table S1 . All figures were generated using PyMOL ( DeLano, 2006 ) or Chimera.
Supplemental Information Document S1. Tables S1–S3 Movie S1. Movie Showing Density for Ligands in the Various EM Maps: PICs 1A, 2A, 4, and III, Related to Figure 1 Densities for all ligands are shown. In PIC-1A, a zoom to the P site is shown along with the density of mRNA and surrounding residues. In PIC-4 we also zoom into the codon:anticodon density. In PIC-III we show a zoomed view of C2 of IF2. Movie S2. Morphing of PICs 1C, 2B, and 4 to Highlight the Conformational Changes in the 30S Head with Respect to the Body, Related to Figure 2 Both head swivel as well as upward movement of head (which opens up the mRNA latch) is shown. An mRNA (magenta) has been modeled in the mRNA channel. A zoomed view of opening (in PIC-1C) and closing of latch (PIC-2B and 4) is shown. In the neck of the 30S, h28, which relaxes (in PIC-1C) and compresses (PIC-4) during the 30S head movement is also shown. Movie S3. Movie Highlighting the Conformational Changes in IF3 along the Initiation Pathway, Related to Figures 3 and 4 The 30S head is not shown for the sake of clarity. A zoom to the P site shows the close positioning of IF3 to the mRNA in the absence of tRNA. The β-hairpin closer to tRNA is colored blue to highlight its movement. Surface representations of IF3 and tRNA in a few of the frames show the close positioning of these two ligands in certain steps. Movie S4. Morphing of PICs 2A, 2B, and 2C to Highlight the Head Swivel, Leading to Movement of tRNA/mRNA toward the E Site, Related to Figure 5 In the zoomed view a canonical E-site tRNA is shown in gray. During the transition from PIC-2A to 2B and subsequently to 2C, the codon in PIC-2A is shown in gray to highlight the movement of codon in PICs-2B and 2C. Movie S5. Movie Showing the Complete Initiation Pathways, Related to Figures 6 and 7 The movie starts with PIC-I. Thereafter we show the morph of PICs in this order: PIC- 1A, 1B, 1C, 2A, 2B, 2C, 3 and 4. In the end we show PIC-III and how C2 moves when 50S binds taking clue from recent 70S IC structure (Sprink et al., 2016).
📊 Figures
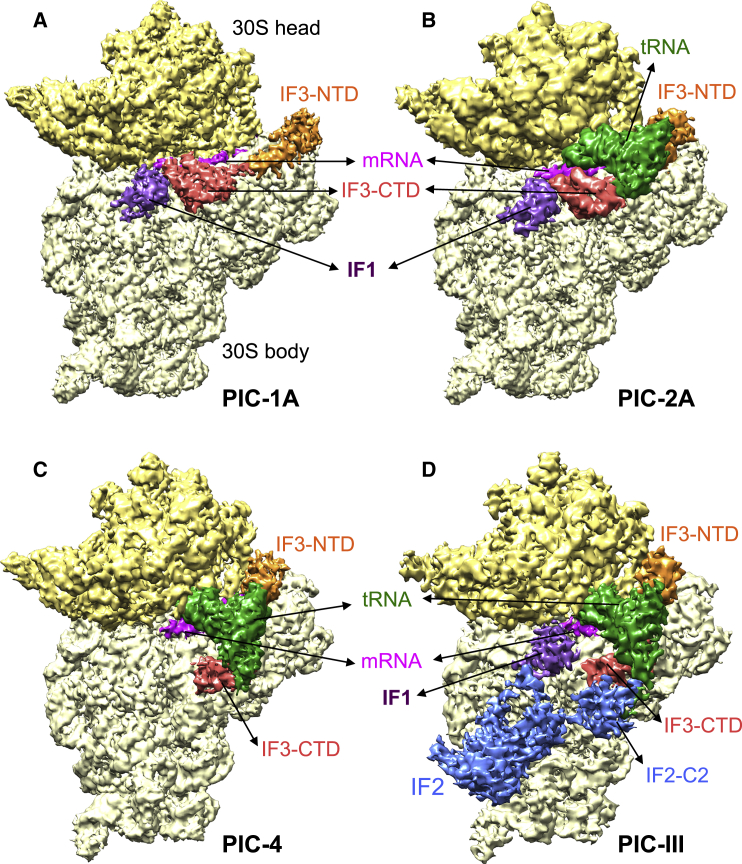
Figureu00a01
Cryo-EM Maps of 30S PICs (A) PIC-1A containing IF1 (purple), IF3 (NTD, orange; CTD, brick red), and mRNA (magenta). The 30S head is shown in a darker yellow compared to the body. The same color scheme...
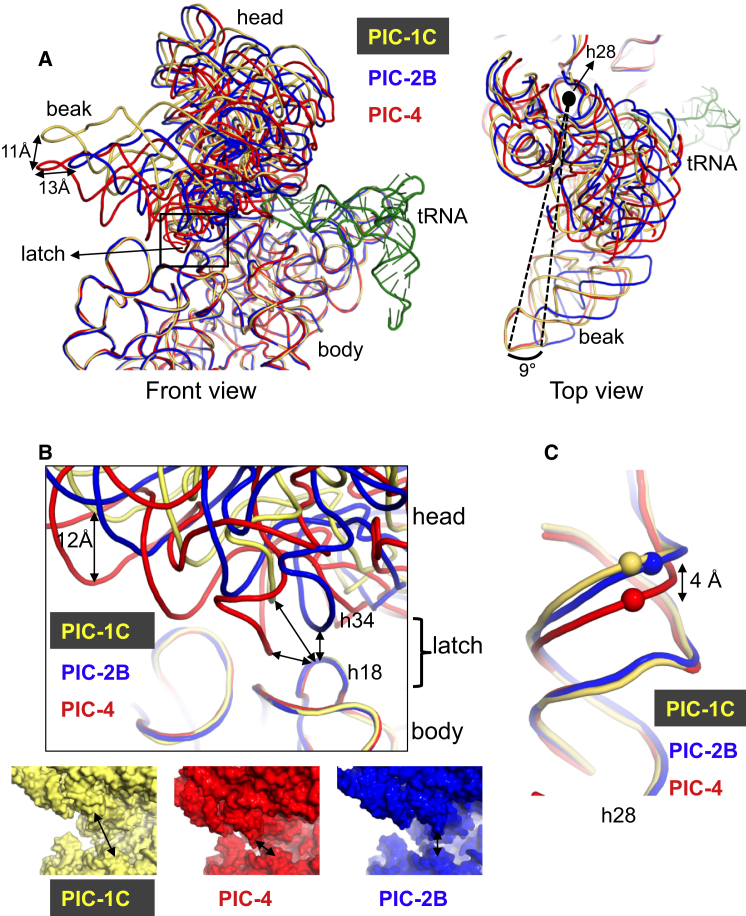
Figureu00a02
Movement of the 30S Head Widens the mRNA Entry Channel and Opens the Latch (A) Front view of the orientation of the 30S head in PIC-1C (yellow), PIC-2B (blue), and PIC-4 (red), using the 30S body for ...
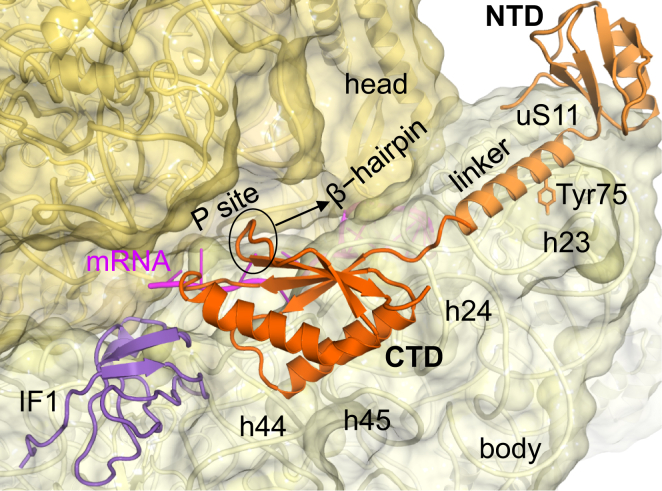
Figureu00a03
Contacts of IF3 with 30S Ribosomal Subunit The CTD binds next to IF1 at the P site on top of h44 (position 1), and the NTD extends to the platform, while the linker lies on h23 and h24. Tyr75 ( E.u00a...
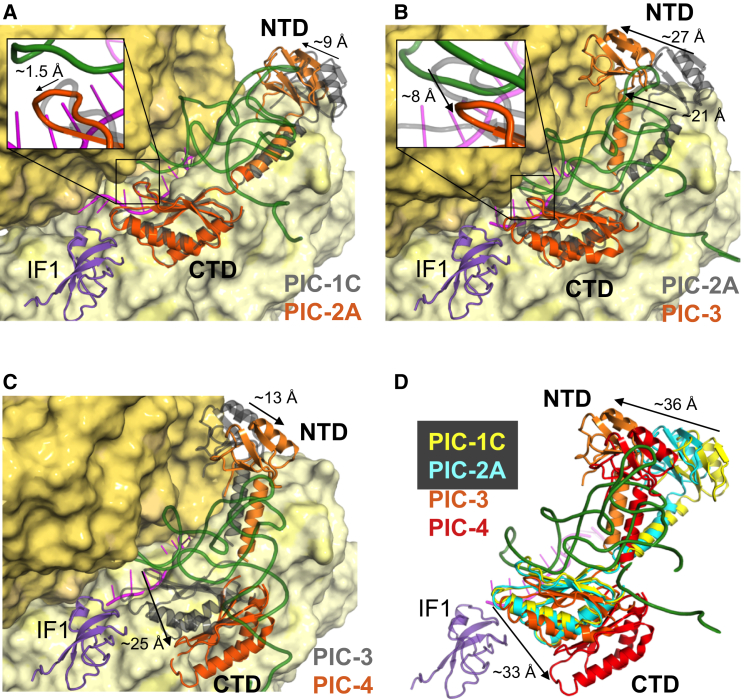
Figureu00a04
Three Distinct Conformations of IF3 on 30S PICs (A) In PIC-2A, the CTD is in position 1 at the P site, while the NTD moves away (arrow; NTD movement is measured using Arg36 as the reference point) fro...
Figureu00a05
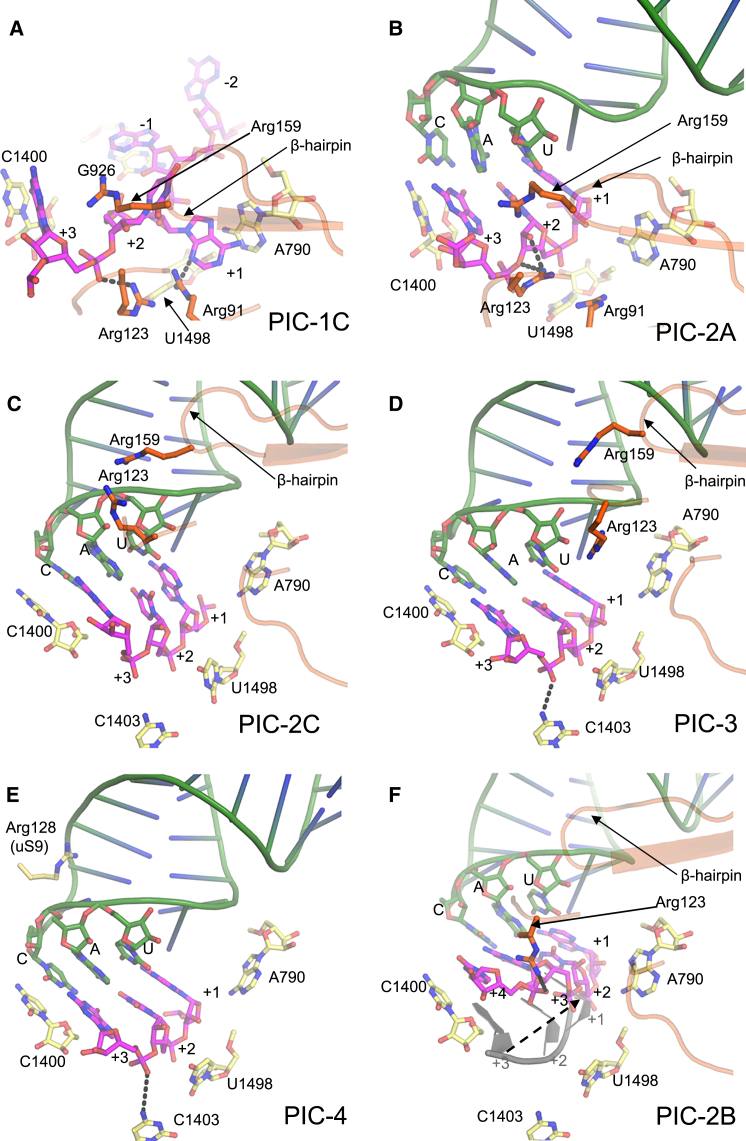
Contacts of IF3 at the P Site (A) In PIC-1C, the A+1 base stacks with A790, while the u22121 base stacks with G926. C1400 and U1498 are also shown. Residues of IF3 close to the codon are shown. (B) In...
Figureu00a06
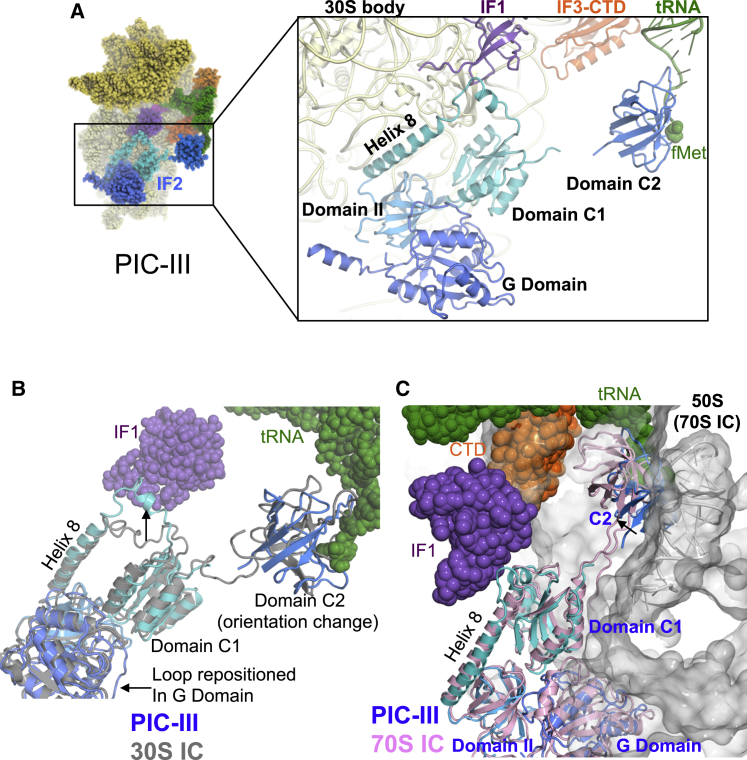
IF2 in 30S PICs (A) Ribbon representation of IF2 in PIC-III highlighting the four domains of IF2 seen in the structures. Each domain is shown is in different shades of blue and labeled. The C-terminal...
Figureu00a07
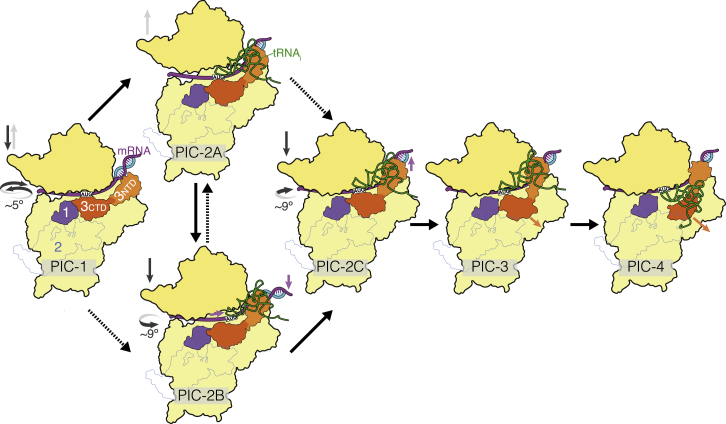
Schematic of Major Conformational Changes during Initiation The various PIC structures are summarized in an order that represents one possible initiation pathway in which mRNA binding precedes tRNA bi...
Figureu00a0S1
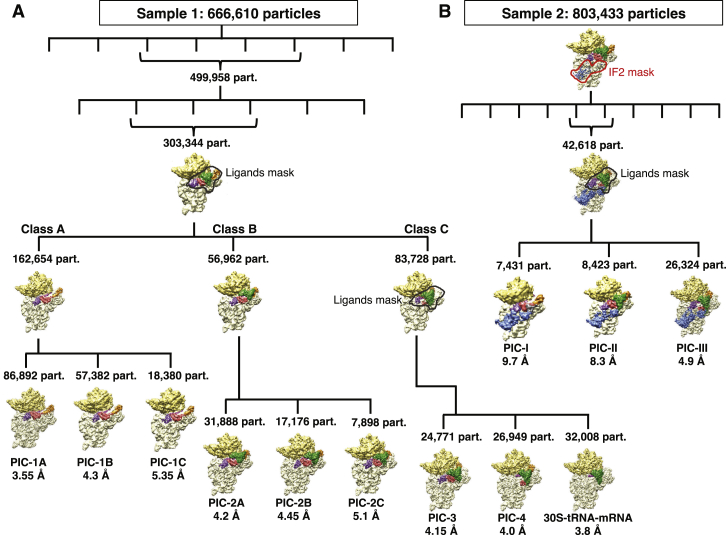
Scheme of 3D Classification of Data, Related to Figureu00a01 (A) For Sample1 (without IF2) 666,610 particles were selected after 2D classification and an initial 3D refinement was done. The u2018ligan...
Figureu00a0S2
Validation of the PICs, Related to Figureu00a01 (A) Gold-standard Fourier Shell Correlation (FSC) curves for PICs u22121A, 1B and 1C. (B) Gold-standard Fourier Shell Correlation (FSC) curves for PICs ...
Figureu00a0S3
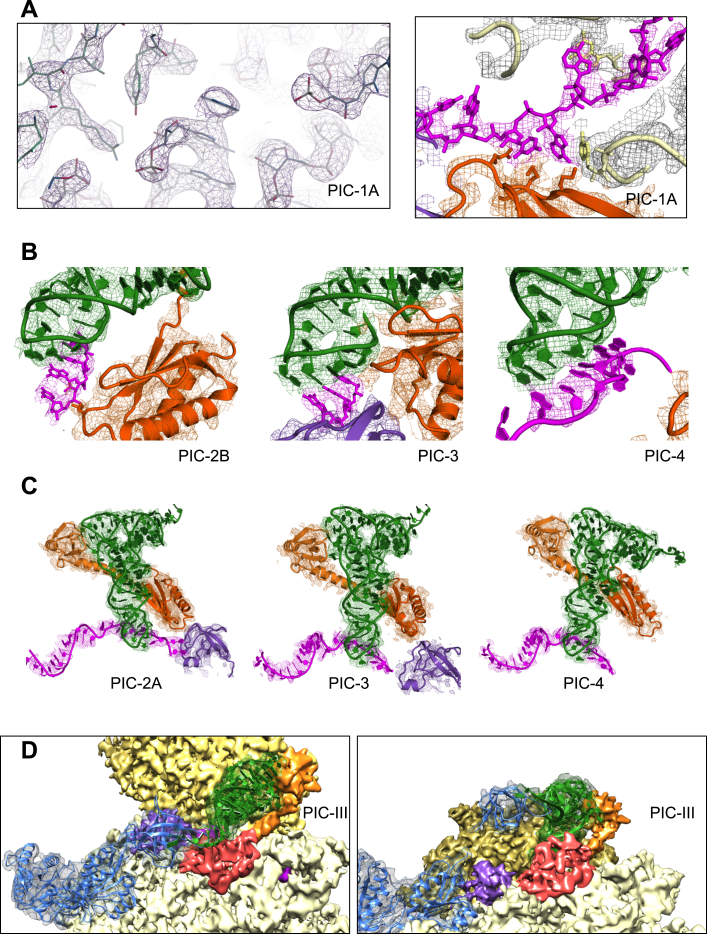
Fitting of Ligands in Density Maps, Related to Figureu00a01 (A) Left: Representative snapshot showing side chains of ribosomal protein and rRNA fitting in PIC-1A. Right: Fitting of mRNA (magenta), CTD...
Figureu00a0S4
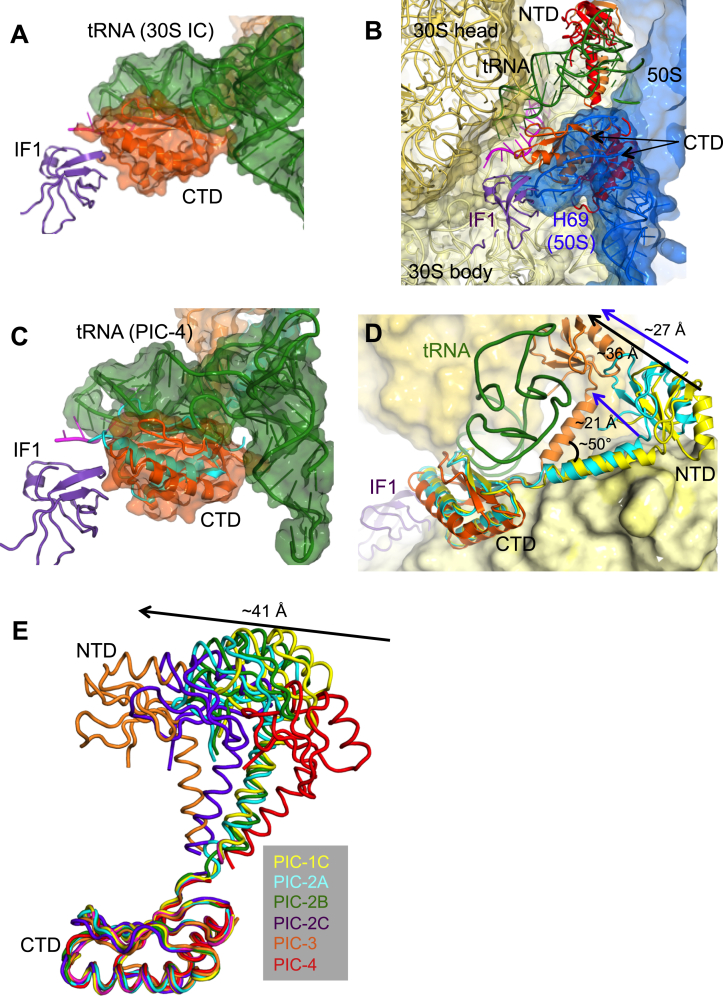
IF3 on 30S, Related to Figures 3 and 4 (A) The CTD in Position1 would clash with fMet-tRNA fMet in a previously reported 30S initiation complex ( Simonetti etu00a0al., 2008 ). Only one fMet-tRNA fMet ...
Figureu00a0S5
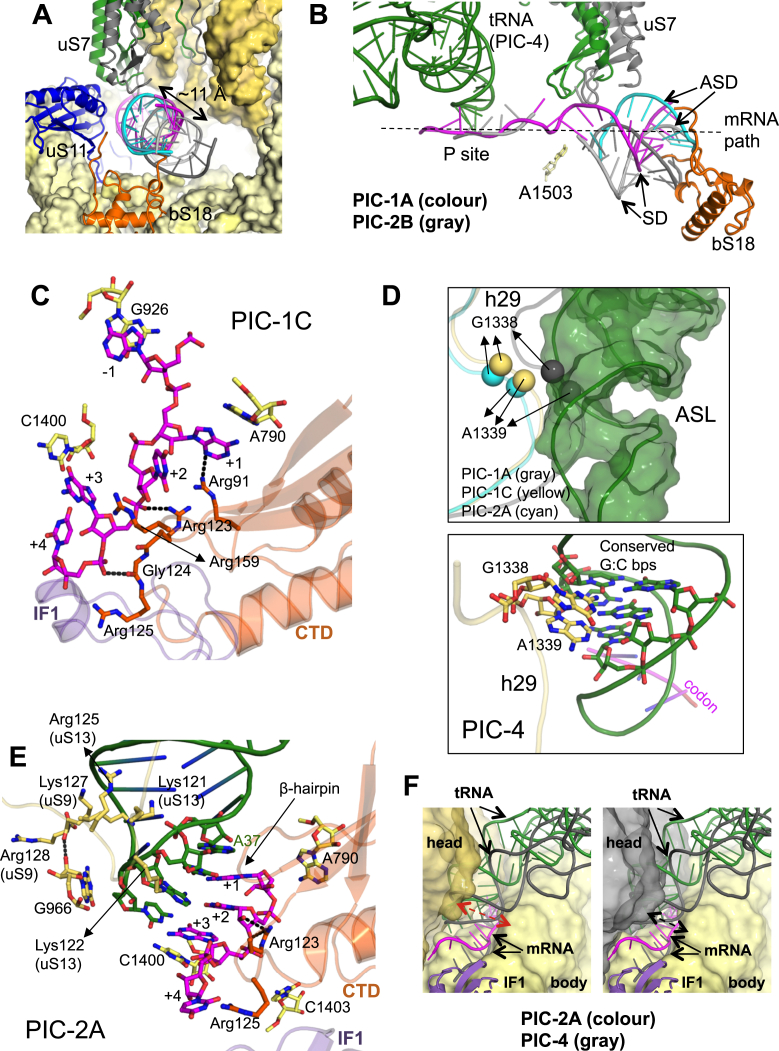
SD/ASD and PICs 1C and 2A, Related to Figureu00a05 (A) The SD:ASD helix with SD (magenta) and ASD in PIC-1A and PIC-4 (both cyan) and PIC-2B (gray). The SD/ASD in PIC-2B moves u223c11u00a0u00c5 relati...
Figureu00a0S6
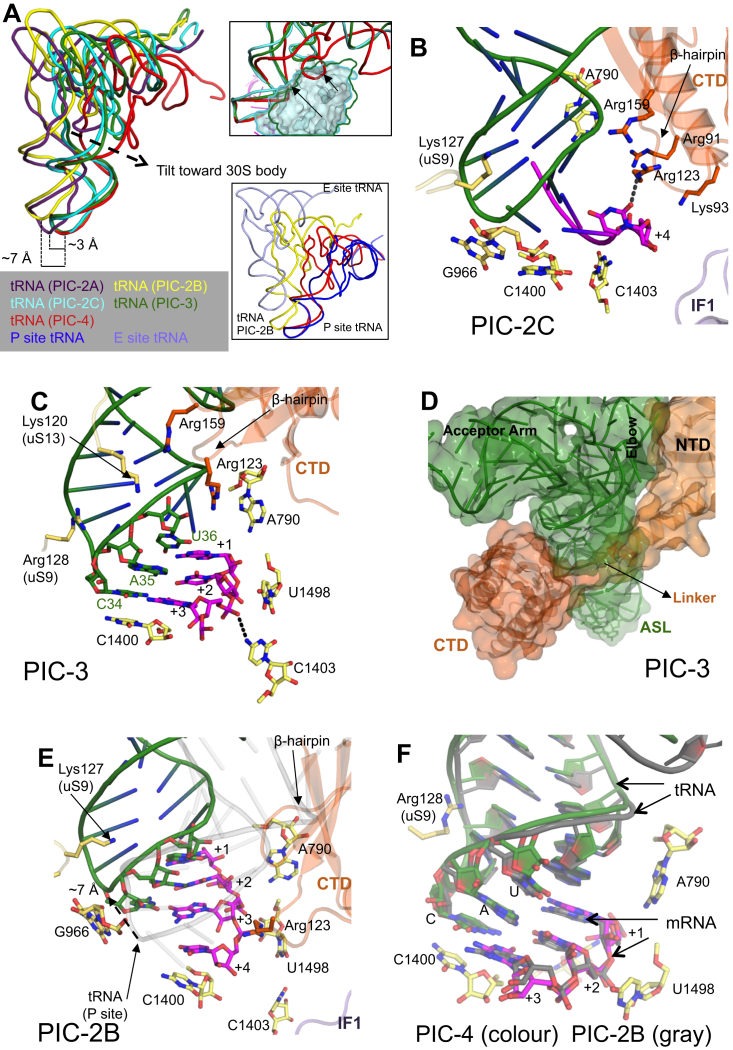
tRNA and IF3 in PICs, Related to Figureu00a05 (A) The relative movement of the initiator tRNA in the various PICs as deduced by a superposition using the 30S body. The tip of the ASL in PIC-2A (purple...
Figureu00a0S7
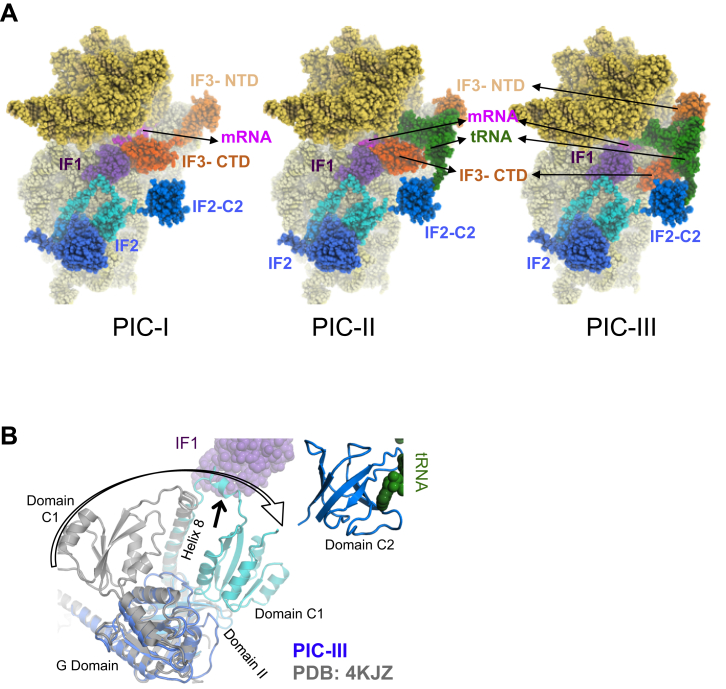
IF2 in 30S PICs, Related to Figureu00a06 (A) Space filling model of PIC-I, II and III. IF2 is in the same position and conformation in all PICs. (B) Superposition of the crystal structure of Thermus I...
Figure images are served from the NIH/NLM PubMed Central Open Access Subset or Europe PMC; copyright remains with the publishers and authors.
💬 Discussion
0 commentsNo comments yet. Be the first to start a discussion!
Leave a Comment