Abstract
Neutrophil extracellular traps (NETs) have been implicated in the pathogenesis of systemic Lupus erythematosus (SLE), since netting neutrophils release potentially immunogenic autoantigens including histones, LL37, human neutrophil peptide (HNP), and self-DNA. In turn, these NETs activate plasmacytoid dendritic cells resulting in aggravation of inflammation and disease. How suppression of NET formation can be targeted for treatment has not been reported yet. Signal Inhibitory Receptor on Leukocytes-1 (SIRL-1) is a surface molecule exclusively expressed on phagocytes. We recently identified SIRL-1 as a negative regulator of human neutrophil function. Here, we determine whether ligation of SIRL-1 prevents the pathogenic release of NETs in SLE. Peripheral blood neutrophils from SLE patients with mild to moderate disease activity and healthy donors were freshly isolated. NET release was assessed spontaneously or after exposure to anti-neutrophil antibodies or plasma obtained from SLE patients. The formation of NETs was determined by microscopic evaluation using DNA dyes and immunostaining of NET components, as well as by live cell imaging. We show that SLE neutrophils spontaneously release NETs. NET formation is enhanced by stimulation with antibodies against LL37. Inhibition of nicotinamide adenine dinucleotide phosphate (NADPH) oxidase activity and MEK-ERK signaling prevents NET release in response to these antibodies. Signaling via the inhibitory receptor SIRL-1 was induced by ligation with anti-SIRL-1 specific antibodies. Both spontaneous and anti-neutrophil antibody-induced NET formation is suppressed by engagement of SIRL-1. Furthermore, NET release by healthy neutrophils exposed to SLE plasma is inhibited by SIRL-1 ligation. Thus, SIRL-1 engagement can dampen spontaneous and anti-neutrophil antibody-induced NET formation in SLE, likely by suppressing NAPDH oxidase and MEK-ERK activity. Together, these findings reveal a regulatory role for SIRL-1 in NET formation, potentially providing a novel therapeutic target to break the pathogenic loop in SLE.
🔬 Techniques
✨ Fluorophores
🧪 Sample Preparation
🔬 Cell Lines
🏭 Microscope Brands
🧪 Reagent Suppliers
📷 Detectors
🔎 Objectives
💻 Software Details
🏛️ Research Organizations (ROR)
Affiliated research institutions:
📋 Methods
Patient information This study was undertaken after the approval of the Medical University of Utrecht institutional review board. All patients and healthy controls gave written informed consent. Seventeen patients meeting the ACR criteria for SLE [ 9 ] were enrolled in the study. Sixteen patients were female (94%). Sex-matched healthy controls were used. Disease activity was measured according to the SELENA-SLEDAI score at the day of blood collection [ 10 ]. Patients had mild to moderate disease activity with the SELENA-SLEDAI ranging from 0-8 and a mean SLEDAI of 3.6 (± 2 SD). Mostly, disease activity consisted of an elevated titer of dsDNA antibodies. Specific patient characteristics including medication are listed in Table 1 . 10.1371/journal.pone.0078459.t001 Table 1 Patient characteristics and ongoing treatment * . Age Gender SLEDAI Disease activity at visit: organ dsDNA (IU/ml) ENA Medication History of nephritis 46 F 8,0 serology, alopecia, kidney (dysmorphic erythrocytes) 75,0 SS-A, SS-B, nucleosomes, PM-Scl HCQ, Aza, Pred (10mg) yes 46 F 2,0 serology 0,0 SS-A, SS-B HCQ no 33 F 2,0 serology 100,0 none none no 53 F 2,0 serology 80,0 none HCQ, Aza, Pred (10mg) yes 39 F 2,0 serology 12,0 none HCQ, Pred (7,5mg) no 39 F 7,0 serology, hematology, skin 200,0 SS-A, histones, nucleosomes, Sm, RibP HCQ, Aza, Pred (5mg) no 58 F 0,0 none 0,6 SS-A HCQ, Aza, Pred (5mg) yes 32 F 4,0 serology, skin 25,0 SS-A, SS-B, histones, Sm, RibP Aza, Pred (5mg) yes 51 F 6,0 serology, kidney (dysmorphic erythrocytes) 1,8 none Aza, Pred (5mg) yes 36 F 4,0 serology 65,0 none Aza, Pred (10mg) yes 53 F 3,0 serology, hematolgoy 8,9 SS-A, SS-B HCQ no 27 F 5,0 serology, hematology, skin 3,6 SS-A HCQ no 55 F 4,0 serology 22,0 none MMF, Pred (10mg) yes 30 F 2,0 serology 39,0 none Pred (5mg) yes 21 F 4,0 serology 75,0 histones, Sm HCQ, Aza, Pred (10mg) yes 52 M 3,0 serology, hematology 8,9 none HCQ, Aza, Pred (10mg) no 51 F 4,0 serology 16,0 SS-A, nucleosomes HCQ, MTX (15mg) no * SLEDAI: SLE disease activity index, dsDNA: double-stranded DNA, ENA: extractable nuclear antigens, Sm: Smith antigen, SS-A: Sjoegren Syndrome Antigen A, SS-B: Sjoegren Syndrome Antigen B, PM-Scl: Polymyositis-Scleroderma, RibP: Ribosomal antigen P, HCQ: Hydroxychloroquine, Aza: Azathioprine, Pred: Prednisone, MMF: Mycophenolate Mofetil, MTX: Methotrexate Neutrophil isolation Human normal-density neutrophils were isolated from heparinized venous blood of healthy donors or SLE patients by density gradient centrifugation with Histopaque 1119 (Sigma Aldrich) and Ficoll (Amersham Biosciences). Plasma was collected and used for stimulation of neutrophils. If not stated otherwise, cells were resuspended in RPMI 1640 medium supplemented with 2% heat-inactivated FCS. Neutrophils (5 x 10 5 ) were seeded on uncoated glass for live cell imaging or glass coverslips for fluorescence microscopy pretreated with 0.001% poly-L-lysine (Sigma Aldrich). Incubations were performed at 37°C in the presence of 5% CO 2 . Stimulation and inhibition of NET formation Neutrophils were stimulated with anti-LL37 (10 µg/ml; Hycult biotech), anti-HNP (10 µg/ml; Novus Biological), 10 µg/ml irrelevant surface-binding control antibodies (anti-MHCI; in-house) or 25 ng/ml PMA (Sigma Aldrich) as described previously [ 2 ]. Previous experiments (results not shown) confirmed that the use of irrelevant surface-binding control antibodies did not differ from that of nonbinding isotype-matched IgG1 (eBioscience). Plasma from SLE patients and healthy controls was used at a concentration of 20% to induce NET formation. In some experiments, neutrophils were incubated with inhibitors 30 min before stimulation. The NADPH oxidase inhibitor diphenylenoiodonium (DPI; Sigma Aldrich) was used at 10 µM and the MEK inhibitor U0126 (Cell Signaling Technology) at 50 µM. DMSO was used as vehicle control. Where indicated, neutrophils were incubated at 4°C with 10 µg/ml anti-SIRL-1 (clone 1A5) or irrelevant control antibodies followed by 20 µg/ml goat anti-mouse F(ab’) 2 fragments (SouthernBiotech) for 30 min prior to the induction of NET formation.
Show full methods section
Patient information This study was undertaken after the approval of the Medical University of Utrecht institutional review board. All patients and healthy controls gave written informed consent. Seventeen patients meeting the ACR criteria for SLE [ 9 ] were enrolled in the study. Sixteen patients were female (94%). Sex-matched healthy controls were used. Disease activity was measured according to the SELENA-SLEDAI score at the day of blood collection [ 10 ]. Patients had mild to moderate disease activity with the SELENA-SLEDAI ranging from 0-8 and a mean SLEDAI of 3.6 (± 2 SD). Mostly, disease activity consisted of an elevated titer of dsDNA antibodies. Specific patient characteristics including medication are listed in Table 1 . 10.1371/journal.pone.0078459.t001 Table 1 Patient characteristics and ongoing treatment * . Age Gender SLEDAI Disease activity at visit: organ dsDNA (IU/ml) ENA Medication History of nephritis 46 F 8,0 serology, alopecia, kidney (dysmorphic erythrocytes) 75,0 SS-A, SS-B, nucleosomes, PM-Scl HCQ, Aza, Pred (10mg) yes 46 F 2,0 serology 0,0 SS-A, SS-B HCQ no 33 F 2,0 serology 100,0 none none no 53 F 2,0 serology 80,0 none HCQ, Aza, Pred (10mg) yes 39 F 2,0 serology 12,0 none HCQ, Pred (7,5mg) no 39 F 7,0 serology, hematology, skin 200,0 SS-A, histones, nucleosomes, Sm, RibP HCQ, Aza, Pred (5mg) no 58 F 0,0 none 0,6 SS-A HCQ, Aza, Pred (5mg) yes 32 F 4,0 serology, skin 25,0 SS-A, SS-B, histones, Sm, RibP Aza, Pred (5mg) yes 51 F 6,0 serology, kidney (dysmorphic erythrocytes) 1,8 none Aza, Pred (5mg) yes 36 F 4,0 serology 65,0 none Aza, Pred (10mg) yes 53 F 3,0 serology, hematolgoy 8,9 SS-A, SS-B HCQ no 27 F 5,0 serology, hematology, skin 3,6 SS-A HCQ no 55 F 4,0 serology 22,0 none MMF, Pred (10mg) yes 30 F 2,0 serology 39,0 none Pred (5mg) yes 21 F 4,0 serology 75,0 histones, Sm HCQ, Aza, Pred (10mg) yes 52 M 3,0 serology, hematology 8,9 none HCQ, Aza, Pred (10mg) no 51 F 4,0 serology 16,0 SS-A, nucleosomes HCQ, MTX (15mg) no * SLEDAI: SLE disease activity index, dsDNA: double-stranded DNA, ENA: extractable nuclear antigens, Sm: Smith antigen, SS-A: Sjoegren Syndrome Antigen A, SS-B: Sjoegren Syndrome Antigen B, PM-Scl: Polymyositis-Scleroderma, RibP: Ribosomal antigen P, HCQ: Hydroxychloroquine, Aza: Azathioprine, Pred: Prednisone, MMF: Mycophenolate Mofetil, MTX: Methotrexate Neutrophil isolation Human normal-density neutrophils were isolated from heparinized venous blood of healthy donors or SLE patients by density gradient centrifugation with Histopaque 1119 (Sigma Aldrich) and Ficoll (Amersham Biosciences). Plasma was collected and used for stimulation of neutrophils. If not stated otherwise, cells were resuspended in RPMI 1640 medium supplemented with 2% heat-inactivated FCS. Neutrophils (5 x 10 5 ) were seeded on uncoated glass for live cell imaging or glass coverslips for fluorescence microscopy pretreated with 0.001% poly-L-lysine (Sigma Aldrich). Incubations were performed at 37°C in the presence of 5% CO 2 . Stimulation and inhibition of NET formation Neutrophils were stimulated with anti-LL37 (10 µg/ml; Hycult biotech), anti-HNP (10 µg/ml; Novus Biological), 10 µg/ml irrelevant surface-binding control antibodies (anti-MHCI; in-house) or 25 ng/ml PMA (Sigma Aldrich) as described previously [ 2 ]. Previous experiments (results not shown) confirmed that the use of irrelevant surface-binding control antibodies did not differ from that of nonbinding isotype-matched IgG1 (eBioscience). Plasma from SLE patients and healthy controls was used at a concentration of 20% to induce NET formation. In some experiments, neutrophils were incubated with inhibitors 30 min before stimulation. The NADPH oxidase inhibitor diphenylenoiodonium (DPI; Sigma Aldrich) was used at 10 µM and the MEK inhibitor U0126 (Cell Signaling Technology) at 50 µM. DMSO was used as vehicle control. Where indicated, neutrophils were incubated at 4°C with 10 µg/ml anti-SIRL-1 (clone 1A5) or irrelevant control antibodies followed by 20 µg/ml goat anti-mouse F(ab’) 2 fragments (SouthernBiotech) for 30 min prior to the induction of NET formation.
Quantification of extracellular NET-DNA
Cells were stimulated to induce the release of NETs. After 3 h, cells were stained with Sytox Green (0.5 µM; Invitrogen), a cell-impermeable DNA dye, gently washed, fixed with 4% paraformaldehyde (PFA) and stained with Hoechst 33342 (1 µM; Invitrogen). For quantification of NET release, at least 4 fields of view (each 659 x 659 µm) per condition were captured using a 20x objective lens. NETs were quantified using previously described methodology [ 11 ]. In short, the area of positive Sytox staining for each microscopic field was measured by analyzing the images using ImageJ software (NIH). Contrast was adjusted to minimize background autofluorescence and a fluorescent threshold was set to result in positive staining only. The same contrast and fluorescence threshold were applied to all images from all conditions within the experiment. The Sytox-positive pixel counts were divided by the total number of pixels of thresholded 8-bit images using ImageJ software, and expressed as the percentage of image area covered by positive fluorescence staining in each field of view.
Immunostaining and quantification of released NET constituents
Neutrophils were seeded on glass coverslips treated with 0.001% poly-L-lysine, allowed to settle, and treated with anti-LL37 antibodies (10 µg/ml) or irrelevant control antibodies (10 µg/ml). Myeloperoxidase (MPO) and neutrophil elastase (NE) were immunostained as described elsewhere [ 12 ]. After 3 h, cells were fixed with 4% PFA, permeabilized with 0.25% Triton X-100 in PBS, blocked (1% BSA and 0.1% Tween 20 in PBS) and incubated overnight with primary antibodies anti-MPO (ab45977; Abcam); anti-NE (sc-9518; Santa Cruz Biotechnology), which were detected with F(ab’) 2 fragments of secondary antibodies coupled to Alexa Fluor 488 (Molecular Probes) or DyLight 594 (Jackson ImmunoResearch Laboratories). For DNA detection, Hoechst 33342 was used. Specimens were mounted in Fluoromount-G (SouthernBiotech) and analyzed with a UPlanSApo 20x/0.75 air objective on a widefield inverted microscope (IX71; Olympus). To quantify the release of NET constituents, the same fluorescence threshold was applied to all images from all conditions within the experiment. The MPO-stained (green channel) and NE-stained (red channel) areas were measured using ImageJ software.
Microscopy
Fixed cells were imaged using an Olympus IX71 widefield inverted microscope with a UPlanSApo 20x/0.75 air objective in Fluoromount-G (SouthernBiotech). Two or three of the appropriate band pass excitation filters (360/40, blue channel; 490/20, green channel or 555/28, red channel) were used in succession and fluorescence in blue, green and red channels was visualized with the appropriate emission filters. To minimize differences in fluorescence, the same exposure times for excitation filters were applied between experiments. Typical exposure times for fluorescence channels are as follows. For immunostaining of NET components: blue channel (DNA, 150 ms), green channel (MPO, 250 ms) and red channel (NE, 200 ms). For quantification of extracellular NET-DNA: blue channel (Hoechst, 200 ms), green channel (Sytox Green, 100 ms). Fluorescence was detected using a Photometrics EMCCD 1024 x 1024 pixel camera and Softworx acquisition software. Images were processed using ImageJ.
Flow cytometry
For measurement of SIRL-1 expression, human neutrophils (1 x 10 5 ) in PBS supplemented with 10% BSA were stained with anti-SIRL-1 or isotype-matched control antibodies conjugated to FITC, in the dark for 30 min at 4°C. Neutrophils were then washed twice and finally resuspended in PBS supplemented with 10% BSA. Fluorescence was read on a BD FACS Calibur flow cytometer (BD Biosciences) and analyzed using CellQuest software (BD Immunocytometry Systems).
Live cell imaging
NET release was followed as described elsewhere [ 13 ]. In short, 2-5 x 10 5 neutrophils were labelled with 1 µM Hoechst 33342 in RMPI 1640 medium (phenol red-free) supplemented with 10 mM Hepes and seeded into culture plates equipped with glass bottoms (Mattek). To record the presence of extracellular DNA, the medium contained Sytox Green at a concentration of 0.5 µM. Neutrophils were stimulated with 20% SLE plasma and monitored at 37°C on a microscope (LSM720; Carl Zeiss) with a Plan-Neofluar 40x/0.6 objective over a period of 3 h. Every minute, a set of two images (blue and green fluorescence) was obtained. Laser excitation at 405 and 488nm was used in succession and fluorescence in blue and green channel was visualized with the appropriate filters. Exposure time for both wavelengths was 60 ms. The system was controlled by the Zen 2009 software (Carl Zeiss). Individual frame overlays and videos were processed using ImageJ software.
Statistical analysis
Measurements were analyzed in GraphPad Prism 5. Paired Student’s t test or Student’s t test were used to compare 2 samples. The comparison of 3 samples was performed by ANOVA and Dunnett’s multiple comparison tests. Correlation was established by two-tailed Pearson’s correlation test. Correlation coefficient (r 2 ) and significance (p) are given in the figure.
Supporting Information Video S1 NETs are released by healthy neutrophils in response to SLE plasma. Time lapse of NET formation (related to Fig 4A in which individual frames are shown) shows that NETs detected with Sytox Green, a cell-impermeable, DNA-specific dye, are released when neutrophils are exposed to SLE plasma. Using fluorescence microscopy neutrophils (blue – labelled with Hoechst 33342) were visualized releasing NET-DNA (green - dyed with Sytox Green) within 3 h. (MOV) Click here for additional data file.
📊 Figures
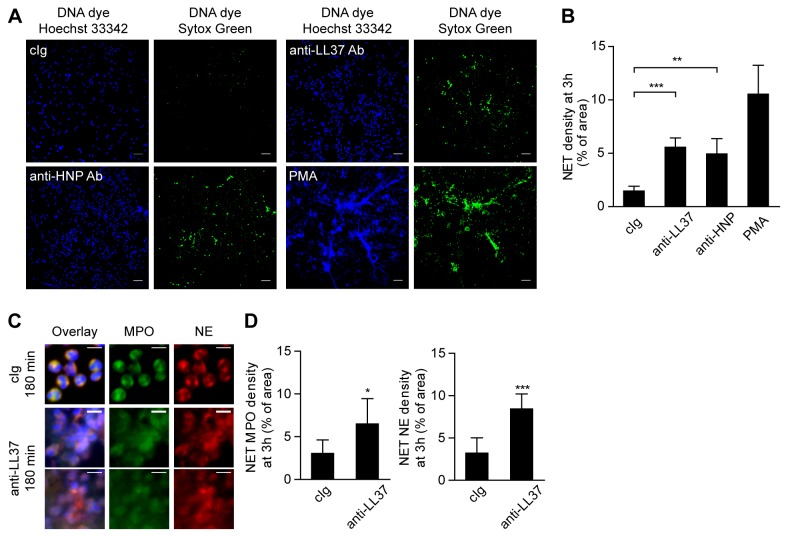
Figure 1
Localization of MPO and NE on extracellular DNA upon NET release in response to anti-neutrophil antibodies.
A) Fluorescence imaging of healthy neutrophils cultured with 10 u00b5g/ml control IgG, 10 u00b5g/ml anti-LL37 antibody, 10 u00b5g/ml anti-HNP antibody or 25 ng/ml PMA as positive control and stained f...
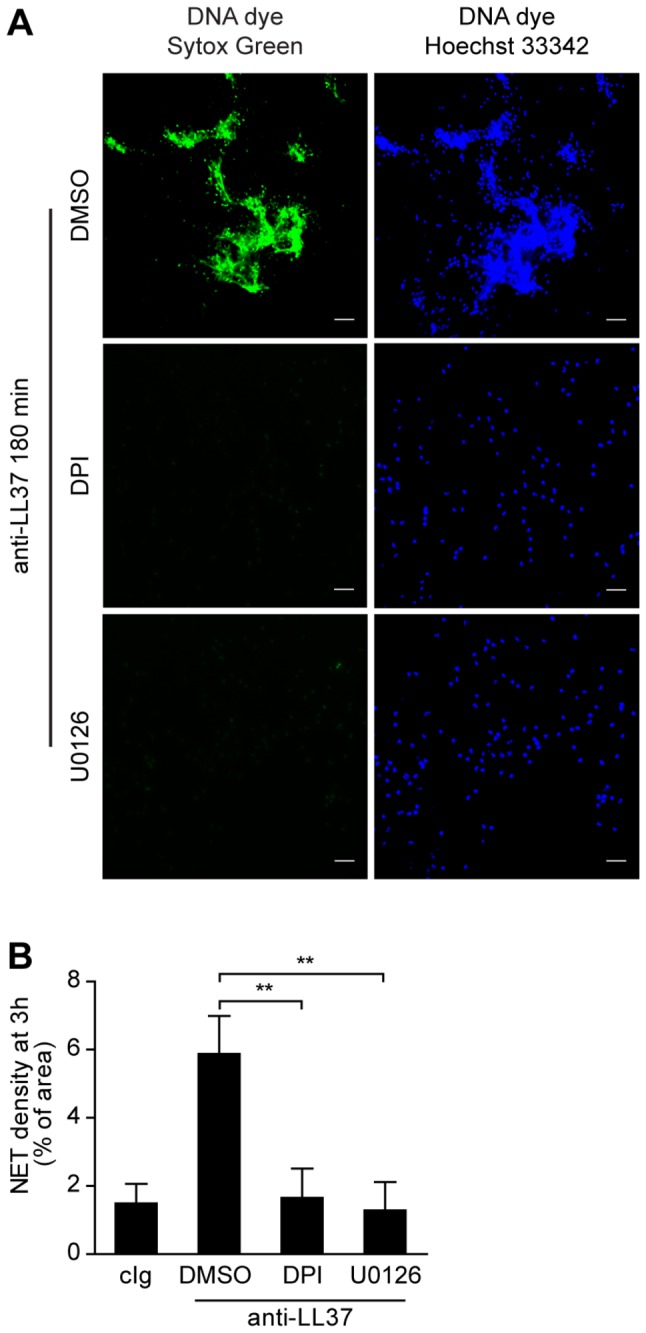
Figure 2
NADPH oxidase activity and MAPK signaling are required for NET formation in response to antibodies against LL37.
Healthy neutrophils were pretreated for 30 min with or without the NADPH oxidase inhibitor DPI (10 u00b5M) or U0126 (50 u00b5M), a specific mitogen-activated protein/extracellular signal-regulated kin...
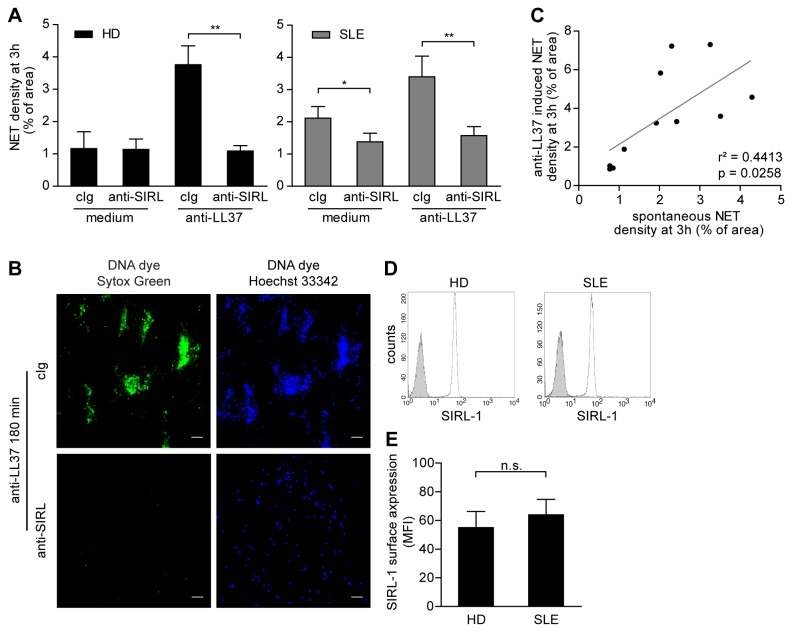
Figure 3
Ligation of SIRL-1 suppresses both spontaneous and anti-LL37-triggered NET release by SLE neutrophils.
A) Healthy (HD) or SLE neutrophils were incubated with anti-LL37 antibodies with or without pretreatment with anti-SIRL-1 mAb. NET-DNA release was quantified after 3 h in multiple experiments by fluor...
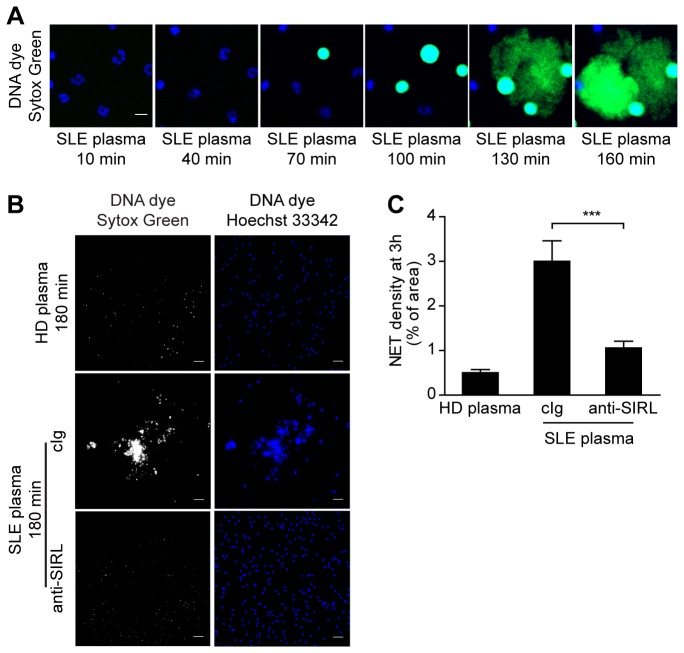
Figure 4
Engagement of SIRL-1 prevents NETosis in response to SLE plasma.
A) NET release from healthy neutrophils exposed to SLE plasma visualized as extracellular DNA (Sytox Green) by live cell imaging (Video S1) (neutrophils are blue; NETs are green). Individual frames ar...
Figure images are served from the NIH/NLM PubMed Central Open Access Subset or Europe PMC; copyright remains with the publishers and authors.
💬 Discussion
0 commentsNo comments yet. Be the first to start a discussion!
Leave a Comment