Abstract
Abstract Background Multicellular tumor spheroids are models of increasing interest for cancer and cell biology studies. They allow considering cellular interactions in exploring cell cycle and cell division mechanisms. However, 3D imaging of cell division in living spheroids is technically challenging and has never been reported. Results Here, we report a major breakthrough based on the engineering of multicellular tumor spheroids expressing an histone H2B fluorescent nuclear reporter protein, and specifically designed sample holders to monitor live cell division dynamics in 3D large spheroids using an home-made selective-plane illumination microscope. Conclusions As illustrated using the antimitotic drug, paclitaxel, this technological advance paves the way for studies of the dynamics of cell divion processes in 3D and more generally for the investigation of tumor cell population biology in integrated system as the spheroid model.
🔬 Techniques
🧬 Organisms
✨ Fluorophores
🧪 Sample Preparation
🔬 Cell Lines
🏭 Microscope Brands
🧪 Reagent Suppliers
📷 Detectors
💻 Software Details
🏛️ Research Organizations (ROR)
Affiliated research institutions:
📋 Methods
The SPIM setup Additional file 1 shows the selective-plane illumination microscope used in this work. The setup consisted of two horizontal optical axes perpendicular to each other: a light-sheet illumination axis for selective plane excitation and a detection axis. This homemade SPIM setup was equipped with a compact laser launch (Errol, France) comprising the outputs of three DPSS lasers (491 nm, 532 nm and 595 nm) combined with dichroic mirrors into a single multi-wavelength beam. A four-channel acoustico-optical tuneable filter (AOTF) with a separate blanking channel provided precise control over each laser's illumination intensity. The output of the AOTF was coupled into a fibre. The light sheet was obtained by using a cylindrical lens conjugated to an illumination objective (10× NA 0.25). The sample was positioned in the light sheet inside a chamber filled with aqueous medium. The light was collected by means of an immersion objective (10× NA 0.3). The detection objective was fitted into a physiological chamber connected to a filter wheel and a cooled CCD camera (Roper Scientific). The physiological chamber was manufactured by stereolithography of a photosensitive epoxy resin (Cresilas). Movements of the sample holder (x, y, z and rotation) were performed by a fully motorized stage (Physics Instruments), thus allowing multiview imaging. An incubator was fitted above the instrument to control the temperature and CO2 concentration around the sample (PECON controllers). The whole system was fully controlled by AMISPIM software that we developed specifically for this task by using the Labview development environment. This software allows manual or automated control of all the parameters and devices connected to the instrument (three lasers, motorized stage, camera, shutter, filter wheel, temperature monitoring, CO2 control, data acquisition and management).
Show full methods section
The SPIM setup Additional file 1 shows the selective-plane illumination microscope used in this work. The setup consisted of two horizontal optical axes perpendicular to each other: a light-sheet illumination axis for selective plane excitation and a detection axis. This homemade SPIM setup was equipped with a compact laser launch (Errol, France) comprising the outputs of three DPSS lasers (491 nm, 532 nm and 595 nm) combined with dichroic mirrors into a single multi-wavelength beam. A four-channel acoustico-optical tuneable filter (AOTF) with a separate blanking channel provided precise control over each laser's illumination intensity. The output of the AOTF was coupled into a fibre. The light sheet was obtained by using a cylindrical lens conjugated to an illumination objective (10× NA 0.25). The sample was positioned in the light sheet inside a chamber filled with aqueous medium. The light was collected by means of an immersion objective (10× NA 0.3). The detection objective was fitted into a physiological chamber connected to a filter wheel and a cooled CCD camera (Roper Scientific). The physiological chamber was manufactured by stereolithography of a photosensitive epoxy resin (Cresilas). Movements of the sample holder (x, y, z and rotation) were performed by a fully motorized stage (Physics Instruments), thus allowing multiview imaging. An incubator was fitted above the instrument to control the temperature and CO2 concentration around the sample (PECON controllers). The whole system was fully controlled by AMISPIM software that we developed specifically for this task by using the Labview development environment. This software allows manual or automated control of all the parameters and devices connected to the instrument (three lasers, motorized stage, camera, shutter, filter wheel, temperature monitoring, CO2 control, data acquisition and management).
Spheroid production and staining
Capan-2 pancreatic cancer cells were cultured in DMEM/F12 (Invitrogen, France) containing 10% FCS with 2 mmol/l glutamine and 1% penicillin/streptomycin in a humidified atmosphere of 5% CO2 at 37°C. Spheroids were prepared as previously described [ 30 ]. Briefly, 100 μl of a suspension of 10,000 cells/ml in DMEM/F12 supplemented with 2 nM EGF (Invitrogen) and 2% B27 (Invitrogen) was placed in each well of poly-HEMA-coated 96-well plates (10 mg/ml, Sigma). The plates were centrifuged at 200 g for 6 min and then incubated at 37°C. The diameter of the spheroids was measured with a calibrated eyepiece reticule. When the spheroids reached 400 μm in diameter, they were rinsed with PBS and fixed in 4% neutral-buffered formalin (Sigma) for 2-20 h then incubated in DRAQ5 (Ozyme, 1:1000) diluted in PBS, in the presence of RNAse A (Sigma)(1 mg/ml). We constructed a pcDNA3 plasmid encoding an H2B-tandem HcRed fusion protein and a hygromycin resistance gene. This plasmid was transfected in HCT116 cells (Jet PEI reagent, Polyplus Transfection). One day after transfection, hygromycin (0.2 mg/ml) was added to select cells that had stably incorporated the plasmid. Spheroids from this cell line were obtained as described above. Fixed sample mounting for SPIM The spheroid was placed in 1% low-melting-point agarose cooled to 40°C. This mixture was drawn into a 50 μl glass capillary (Sigma) and cooled for few minutes at 4°C. The capillary was then fixed onto the theta-stage and placed in the PBS-filled physiological chamber (Additional file 1 ). The column of agarose was then extruded from the capillary with an adapted plunger and the agarose-embedded sample was placed in front of the objective lens.
Sample holder preparation for time-lapse data acquisition
Sample holders were made from Phytagel™ (also known as Appliedgel or Gelrite, Sigma), an anionic linear tetrasaccharide that polymerizes into a gel in the presence of salt ions. A 10 g/l solution of Phytagel was prepared in PBS and autoclaved. Prior to use, the Phytagel solution was melted in a microwave then used to fill a tip-less Combitip syringe (1250 μl, Gilson) as described in Additional file 8 . The molded chamber obtained was then filled with Optimem (Invitrogen) culture medium containing 10% FCS and 1% penicillin/streptomycin. The spheroid was placed in the molded chamber then fixed to a Combitip from which the tip had been excised (Additional file 8 ). More information is available at http://www.ip3d.fr/IP3D/SPIM/SPIM.html . This assembly was then placed in the physiological chamber filled with Optimem culture medium containing 10% FCS and penicillin/streptomycin. Prior time-lapse acquisition, the physiological chamber was soaked in bleach solution in order to avoid any contamination. To study the effect of taxol treatment, spheroids were incubated in medium containing 100 nM Paclitaxel (Sigma) for a few hours before time-lapse data acquisition then transferred to sample holders filled with medium containing 100 nM Paclitaxel. The physiological chamber was also filled with the same medium. Data acquisition A 10× NA 0.3 water immersion lens (Leica) was used to provide suitable working distances for imaging entire spheroids and 3D resolution sufficient to see individual nuclei. Exposure times were 200-500 ms. DRAQ5 or HcRed fluorescence was excited with a 595 nm laser and detected by using a 593 long-pass filter. The voxel size was 0.645 × 0.645 × 1 μm. Live imaging was performed at 37°C and 5% CO2.
Image processing
Images were processed with the open-source image-processing package Fiji software. Multiviews registration and fusion were performed using the SPIM registration plugin (Additional file 14 ) [ 16 ]. 3D visualization of the fused stacks was obtained by using the 3D stitching and 3D viewer plug-ins. Drift that occurs between the different time points during time-lapse acquisition was compensated by using the TJ shift transform plug-in. To perform 3D reconstruction, the stripes that impair SPIM images were first removed using a dedicated algorithm. The stripes are modelled as the convolution product of a white noise by an elementary stripe-like pattern. The images are then denoised using a Maximum A Posteriori model, leading to a nonlinear optimization problem. This software is available on demand. The 3D reconstruction of mitotic cells was performed with the IMARIS 7.0.0 software (Bitplane).
Supplementary Material Additional file 1 The Selective Plane Illumination Microscopy (SPIM) setup . A: Schematics of the SPIM system. Lateral (B) and top (C) views of the SPIM setup. The green path corresponds to the illumination axis and the perpendicular red path corresponds to the detection axis. The sample is suspended through the theta-stage (θS) in the physiological chamber (PC) and is positioned in the focal plane of the detection objective. It can be moved in the x, y and z axis and rotated (θ axis, blue arrow in c). T: telescope; M: mirror; CL: cylindrical lens; TL: tube lens; IO: illumination objective; PC: physiological chamber; XS: X-stage; YS: Y-stage; ZS: Z-stage, θS: θstage; F and FW: filter wheel. D: The physiological chamber was designed using the Open source Blender software (top) and then manufactured by stereolithography of a photosensitive epoxy resin (bottom). The two tinny holes on the top of the chamber (red circles) allow to inject CO2 directly in the physiological chamber at the surface of the culture medium. Click here for file Additional file 2 SPIM images of a spheroid of Capan-2 human pancreatic cancer cells labelled with DRAQ5™ . A: Raw images corresponding to the XY optical sections at the indicated depths inside the spheroid. Scale bar 50 μm. The white arrows show dividing cells located at several cell layers of depth inside the spheroid. B: The XY plane at 130 μm depth is shown with the XZ and ZY planes, parallel to the detection axis, at the Y and X positions indicated by the dashed lines (Scale bar 50 μm). The inserts correspond to the enlargement of the region in the white square on the XY section that displays a mitotic cell. Scale bar 5 μm. The progressive loss of signal observed along the x-axis results from light scattering and absorption by the spheroid that attenuates the light sheet illumination. Horizontal stripes parallel to the light sheet (x-axis) are sample-dependent artifacts specific to SPIM technology. C: 3D visualisation of a multiview reconstruction of four stacks recorded at various angles (0-315°) at incremental steps of 90°. The corresponding stack is shown in Additional file 14 . Click here for file Additional file 3 Three-dimensional SPIM imaging of a Capan-2 cell spheroid labelled with DRAQ5™ . This movie shows a z-stack of 250 slices at a slice spacing of 1 μm. Arrows show mitotic cells. Laser 595 nm; illumination objective 10× NA = 0.25; detection objective 10× NA = 0.3. Scale bar 50 μm. Click here for file Additional file 4 Three-dimensional SPIM imaging of an H2B-HcRed-expressing spheroid . Movie showing two merged z-stacks at 0° and 180°. For each z-stack, 200 slices were recorded with a slice spacing of 1 μm. Arrows show mitotic cells. Click here for file Additional file 5 Three-dimensional SPIM imaging of mitoic cell inside an H2B-HcRed-expressing spheroid . This movie shows 28 slices through a mitotic cell. The images correspond to a region from the z-stack shown in Additional file 4 . Click here for file Additional file 6 Three-dimensional visualization of two regions of the stack shown in Additional file 5 . Arrows show mitotic cells. This visualization was obtained with the 3D viewer plug-in of Fiji software. Click here for file Additional file 7 3D reconstruction of a mitotic cell inside an H2B-HcRed-expressing spheroid . Visualization of the 3D reconstruction of the stack shown in the right part of the Additional file 6 (blue isosurfaces, interphase nuclei; red isosurfaces, mitotic condensed chromosomes). Click here for file Additional file 8 Sample holder preparation for time-lapse acquisitions . A: Sample holders were prepared using a 1.25 ml Combitip from which the tip has been removed. A Phytagel solution (10 g/l in PBS) is aspirated in the Combitip and formed after polymerisation the sample holder. B: The sample holder (shaded grey) was uncast by applying gentle pressure then suspended on a plunger for transfer into the physiological chamber of the microscope. The plunger was made from a Combitip with the tip cut off to leave an empty space (light grey). C: Enlargement of the Phytagel sample holder showing the cavity generated by the shape of the tip of the Combitip plunger. Culture medium was placed in this cavity, in which a spheroid can grow. For more details on sample holder preparation an illustrated protocol is available for downloading here: http://www.ip3d.fr/IP3D/SPIM/SPIM.html Click here for file Additional file 9 SPIM imaging of a live spheroid . SPIM imaging of a live spheroid expressing H2B-HcRed. Z-stacks of 100 slices at slice spacing of 1 μm were recorded every three minutes (10× objective, NA = 0.3). The maximum projection of the z-stacks is shown for each time point. Click here for file Additional file 10 3D visualization of the division of two cells . Three-dimensional visualization of an enlarged region of Additional file 9 showing the progress of two cells through mitosis. This visualization was obtained with the 3D viewer plug-in of Fiji software. Arrows show the two dividing cells. Click here for file Additional file 11 3D reconstruction of the division of two cells . Visualisation of the isosurfaces corresponding to the 3D reconstruction of the mitotic chromosomes (red) and interphase nuclei (blue) in a region of the stack shown in Additional file 9 . Click here for file Additional file 12 SPIM imaging of a live H2B-HcRed-expressing spheroid treated with Paclitaxel . Z-stacks of 200 slices at slice spacing of 1 μm were recorded every three minutes. For each time point, the maximum projection of an enlarged region of each stack is shown (10× objective, NA = 0.3). Arrows indicate mitotic cells. Click here for file Additional file 13 3D reconstruction of arrested mitotic cells following taxol treatment . Visualisation of the isosurfaces corresponding to the 3D reconstruction of a region of the stack shown in Additional file 12 . Click here for file Additional file 14 Stack of the registered and fused multiviews through a spheroid stained with DRAQ5 . Single planes of the stack of the reconstructed spheroid showed in the Additional file 2C . Click here for file
📊 Figures
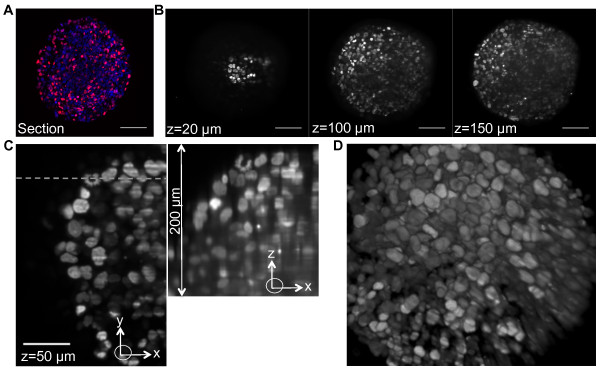
Figure 1
SPIM imaging of spheroids of HCT116 colon carcinoma cells expressing a histone H2B-HcRed fusion protein . A: A frozen section from the center of an H2B-HcRed-expressing HCT116 cell spheroid. DNA is st...
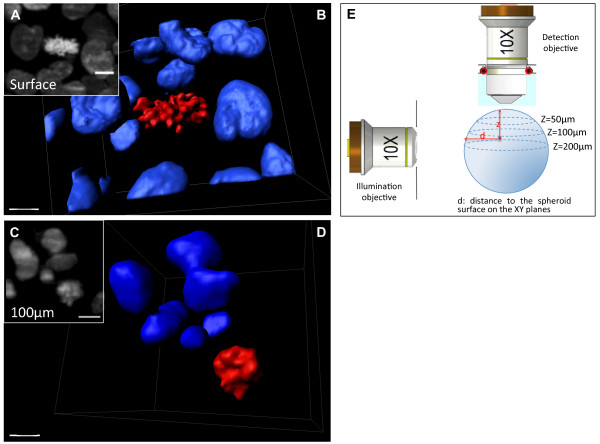
Figure 2
Imaging and 3D reconstruction of interphase and mitotic nuclei within a fixed H2B-HcRed-expressing spheroid . A: Magnification of one frame of the z-stack presented in Additional file 4 showing a mito...
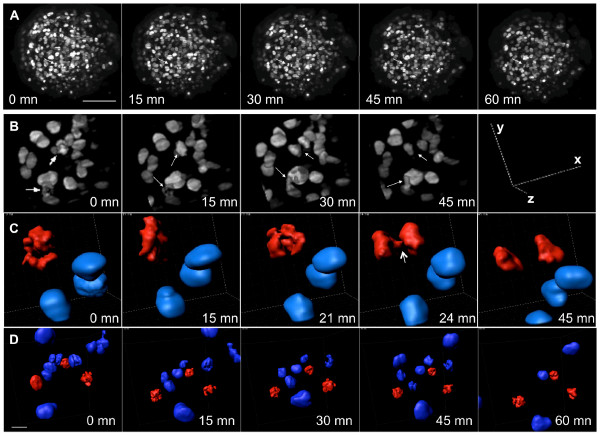
Figure 3
Live spheroid imaging by SPIM . A: Maximum projection of z-stacks of an H2B-HcRed-expressing spheroid recorded at the indicated times. The images are taken from Additional file 9 . Stacks of 100 slice...
Figure images are served from the NIH/NLM PubMed Central Open Access Subset or Europe PMC; copyright remains with the publishers and authors.
💬 Discussion
0 commentsNo comments yet. Be the first to start a discussion!
Leave a Comment