Abstract
AbstractThe maintenance of sensory hair cell stereocilia is critical for lifelong hearing; however, mechanisms of structural homeostasis remain poorly understood. Conflicting models propose that stereocilia F-actin cores are either continually renewed every 24–48 h via a treadmill or are stable, exceptionally long-lived structures. Here to distinguish between these models, we perform an unbiased survey of stereocilia actin dynamics in more than 500 utricle hair cells. Live-imaging EGFP-β-actin or dendra2-β-actin reveal stable F-actin cores with turnover and elongation restricted to stereocilia tips. Fixed-cell microscopy of wild-type and mutant β-actin demonstrates that incorporation of actin monomers into filaments is required for localization to stereocilia tips. Multi-isotope imaging mass spectrometry and live imaging of single differentiating hair cells capture stereociliogenesis and explain uniform incorporation of 15N-labelled protein and EGFP-β-actin into nascent stereocilia. Collectively, our analyses support a model in which stereocilia actin cores are stable structures that incorporate new F-actin only at the distal tips.
🔬 Techniques
✨ Fluorophores
🧪 Sample Preparation
🏭 Microscope Brands
🧪 Reagent Suppliers
💻 Software Details
🏛️ Research Organizations (ROR)
Affiliated research institutions:
📋 Methods
Plasmids and biolistic transfection
For live-cell imaging experiments, human ACTB cDNA ( NM_001101.3 , identical amino acid sequence to mouse β-actin) cloned into the Green FP expression vector (BD Biosciences, San Jose, CA) was used to prepare gold particles for biolistic transfection as previously described 42 with minor modifications. Specifically, we used antibiotics in the culture media (see Organ culture and live imaging below) and reduced the BioRad Helios Gene Gun firing pressure to 100 p.s.i. in order to reduce damage caused by biolistic transfection. The p.G13R and p.G63D substitutions of β-actin were introduced into pEGFP-β-actin using site-directed mutagenesis (Stratagene, La Jolla, CA) with primers 5′-CGTCGTCGACAAC C GCTCCGGCATGTG-3′, 5′-CACATGCCGGAGC G GTTGTCGACGACG-3′, 5′-CCCAGAGCAAGAGAG A CATCCTCACCCTGAA-3′ and 5′-TTCAGGGTGAGGATG T CTCTCTTGCTCTGGG-3′, respectively (point mutation in bold). pDendra2-β-actin was cloned using InFusion (Clontech, Mountain View, CA) with primers 5′-GTGTACAAGACTCGAGCCACCATGGATGATGATATCG-3′ and 5′-TAGATCCGGTGGATCCCTAGAAGCATTTGCGGT-3′ to amplify the cDNA of ACTB and insert it between the XhoI and BamHI sites of pDendra2-C (Clontech, Mountain View, CA). The DNA sequences of all plasmid inserts were verified by Sanger sequencing.
Organ culture and live imaging
C57Bl6/J pups were killed by decapitation at postnatal day 2–5 in accordance with National Institutes of Health Institutional Animal Care and Use Committee-approved guidelines under animal study protocol #1263. Utricles were dissected in L-15 media (Life Technologies, Carlsbad, CA, USA) and cultured on 2 mg ml −1 collagen matrices in DMEM/F-12 with 20 mM L -glutamine, 7% fetal bovine serum, and 1 unit per ml penicillin-G. One hour before biolistic transfection, growth media was replaced with antibiotic-free media. Transfections were done using a Helios gene gun and endotoxin-free plasmid DNA (NucleoBond Xtra EF, Macharey-Nagel). Twenty-four hours post transfection, cultures were transferred to phenol-red free media supplemented with penicillin-G and mounted under a platinum and nylon harp 46 at 37 °C in a humidified 6% CO 2 atmosphere with the stereocilia facing the coverglass and objective. Cells transfected with pEGFP-β-actin were live-imaged on a Zeiss Cell Observer spinning disc microscope (× 63 plan-apochromat, NA 1.4) for 62–92 h. Z-stack volumes (138 × 0.4 μm) were captured at 1-h intervals. For photoconversion experiments with pDendra2-β-actin, transfected cultured cells were imaged for 24 h and z-stack volumes were captured at 30 min intervals. Dendra2-β-actin was converted by exposing a defined region of interest to 405 nm laser light for 15 × 1-ms bursts at 6% of the total laser power (UltraView, Perkin Elmer, Akron, OH, Laser Module 2). Post-acquisition image analyses were performed using ImageJ ( http://imagej.nih.gov/ij/ ) and Volocity (Perkin Elmer, Akron, OH, USA). For automated analysis of dendra2-β-actin experiments ( Fig. 5d ), the red photoconverted populations of dendra2-β-actin and the green non-photoconverted dendra2-β-actin cuticular plate were identified mathematically. The distance from the centroid of the red population to the edge of the cuticular plate was measured for each time point.
Show full methods section
Plasmids and biolistic transfection
For live-cell imaging experiments, human ACTB cDNA ( NM_001101.3 , identical amino acid sequence to mouse β-actin) cloned into the Green FP expression vector (BD Biosciences, San Jose, CA) was used to prepare gold particles for biolistic transfection as previously described 42 with minor modifications. Specifically, we used antibiotics in the culture media (see Organ culture and live imaging below) and reduced the BioRad Helios Gene Gun firing pressure to 100 p.s.i. in order to reduce damage caused by biolistic transfection. The p.G13R and p.G63D substitutions of β-actin were introduced into pEGFP-β-actin using site-directed mutagenesis (Stratagene, La Jolla, CA) with primers 5′-CGTCGTCGACAAC C GCTCCGGCATGTG-3′, 5′-CACATGCCGGAGC G GTTGTCGACGACG-3′, 5′-CCCAGAGCAAGAGAG A CATCCTCACCCTGAA-3′ and 5′-TTCAGGGTGAGGATG T CTCTCTTGCTCTGGG-3′, respectively (point mutation in bold). pDendra2-β-actin was cloned using InFusion (Clontech, Mountain View, CA) with primers 5′-GTGTACAAGACTCGAGCCACCATGGATGATGATATCG-3′ and 5′-TAGATCCGGTGGATCCCTAGAAGCATTTGCGGT-3′ to amplify the cDNA of ACTB and insert it between the XhoI and BamHI sites of pDendra2-C (Clontech, Mountain View, CA). The DNA sequences of all plasmid inserts were verified by Sanger sequencing.
Organ culture and live imaging
C57Bl6/J pups were killed by decapitation at postnatal day 2–5 in accordance with National Institutes of Health Institutional Animal Care and Use Committee-approved guidelines under animal study protocol #1263. Utricles were dissected in L-15 media (Life Technologies, Carlsbad, CA, USA) and cultured on 2 mg ml −1 collagen matrices in DMEM/F-12 with 20 mM L -glutamine, 7% fetal bovine serum, and 1 unit per ml penicillin-G. One hour before biolistic transfection, growth media was replaced with antibiotic-free media. Transfections were done using a Helios gene gun and endotoxin-free plasmid DNA (NucleoBond Xtra EF, Macharey-Nagel). Twenty-four hours post transfection, cultures were transferred to phenol-red free media supplemented with penicillin-G and mounted under a platinum and nylon harp 46 at 37 °C in a humidified 6% CO 2 atmosphere with the stereocilia facing the coverglass and objective. Cells transfected with pEGFP-β-actin were live-imaged on a Zeiss Cell Observer spinning disc microscope (× 63 plan-apochromat, NA 1.4) for 62–92 h. Z-stack volumes (138 × 0.4 μm) were captured at 1-h intervals. For photoconversion experiments with pDendra2-β-actin, transfected cultured cells were imaged for 24 h and z-stack volumes were captured at 30 min intervals. Dendra2-β-actin was converted by exposing a defined region of interest to 405 nm laser light for 15 × 1-ms bursts at 6% of the total laser power (UltraView, Perkin Elmer, Akron, OH, Laser Module 2). Post-acquisition image analyses were performed using ImageJ ( http://imagej.nih.gov/ij/ ) and Volocity (Perkin Elmer, Akron, OH, USA). For automated analysis of dendra2-β-actin experiments ( Fig. 5d ), the red photoconverted populations of dendra2-β-actin and the green non-photoconverted dendra2-β-actin cuticular plate were identified mathematically. The distance from the centroid of the red population to the edge of the cuticular plate was measured for each time point.
Fixed-cell imaging
Mutant expression constructs pEGFP-β-actin G63D and pEGFP-β-actin G13R , the wild-type EGFP-β-actin control and the EGFP-only control were biolistically transfected into cultured utricles from neonatal mice (P2–P5) and fixed in 4% paraformaldehyde at 4 and 24 h post transfection for imaging 17 18 33 . After fixation, samples were washed in phosphate-buffered saline, counterstained with rhodamine-conjugated phalloidin and mounted in ProLong Antifade Gold (Life Technologies).
Multi-isotope imaging mass spectrometry
Mouse pups born to normal mothers were switched at birth to nurse from mothers who had been fed for a month or more with food containing 15 N-leucine (∼1.25% relative to 14 N-leucine). Pups were killed after 4 or 15 days. Utricles were fixed overnight at 4 °C in 4% formaldehyde+10% glutaraldehyde in cacodylate buffer, then processed for plastic embedding and thin sectioning. We performed MIMS as described previously 47 48 . Briefly, an accelerated beam of Cs + ions, focused to a 30-nm spot, was scanned across the surface of a thin section, sputtering molecules from the surface. Anionic molecules were accelerated back and analysed with a double sector mass spectrometer. 15 N was detected as the cyanide ion 12 C 15 N − at mass 27 and compared with 12 C 14 N − at mass 26 for each pixel in the scanned image. Incorporation was calculated from the natural abundance of 15 N and the relative abundance of 15 N in the food 26 . To show incorporation as a percentage in the image, we used a hue saturation intensity transformation in which the hue represents percentage and the intensity indicates reliability.
Supplementary Material Supplementary Information Supplementary Figure 1 Supplementary Movie 1 Montage of all cells classified as “steady-state tip localization”. Displayed as a single movie, each region of interest is presented in a single box as a maximum intensity projection. All movies were cropped to identical size without changing magnification and the brightness and contrast was uniformly normalized to 0.3% saturation for each frame of each movie using the “Enhance contrast – normalize” function in ImageJ. Supplementary Movie 2 Montage of cells classified as “stereociliogenesis” – group 1. Displayed as a single movie, each region of interest is presented in a single box as a maximum intensity projection. All movies were cropped to identical size without changing magnification and the brightness and contrast was uniformly normalized to 0.3% saturation for each frame of each movie using the “Enhance contrast – normalize” function in ImageJ. Supplementary Movie 3 Montage of cells classified as “stereociliogenesis” – group 2. Displayed as a single movie, each region of interest is presented in a single box as a maximum intensity projection. All movies were cropped to identical size without changing magnification and the brightness and contrast was uniformly normalized to 0.3% saturation for each frame of each movie using the “Enhance contrast – normalize” function in ImageJ. Supplementary Movie 4 Montage of cells classified as “damaged” – group 1. Displayed as a single movie, each region of interest is presented in a single box as a maximum intensity projection. All movies were cropped without changing magnification and the brightness and contrast was uniformly normalized to 0.3% saturation for each frame of each movie using the “Enhance contrast – normalize” function in ImageJ. Supplementary Movie 5 Montage of all cells classified as “damaged” – group 2. Displayed as a single movie, each region of interest is presented in a single box as a maximum intensity projection. All movies were cropped without changing magnification and the brightness and contrast was uniformly normalized to 0.3% saturation for each frame of each movie using the “Enhance contrast – normalize” function in ImageJ. Supplementary Movie 6 Montage of all cells classified as “damaged” – group 3. Displayed as a single movie, each region of interest is presented in a single box as a maximum intensity projection. All movies were cropped without changing magnification and the brightness and contrast was uniformly normalized to 0.3% saturation for each frame of each movie using the “Enhance contrast – normalize” function in ImageJ. Supplementary Movie 7 Movie of cell shown in Figure 5B
📊 Figures
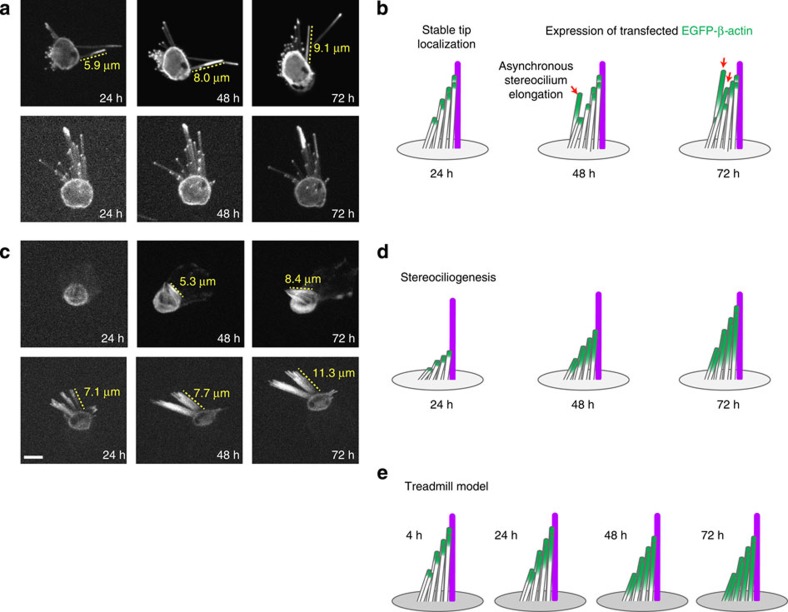
Figure 1
Live-cell imaging reveals different classes of EGFP-u03b2-actin dynamics in hair cell stereocilia.
( a ) Still frames and ( b ) schematic representations of stereocilia bundles demonstrating steady-state tip localization of EGFP-u03b2-actin (green) and asynchronous elongation (red arrow). The major...
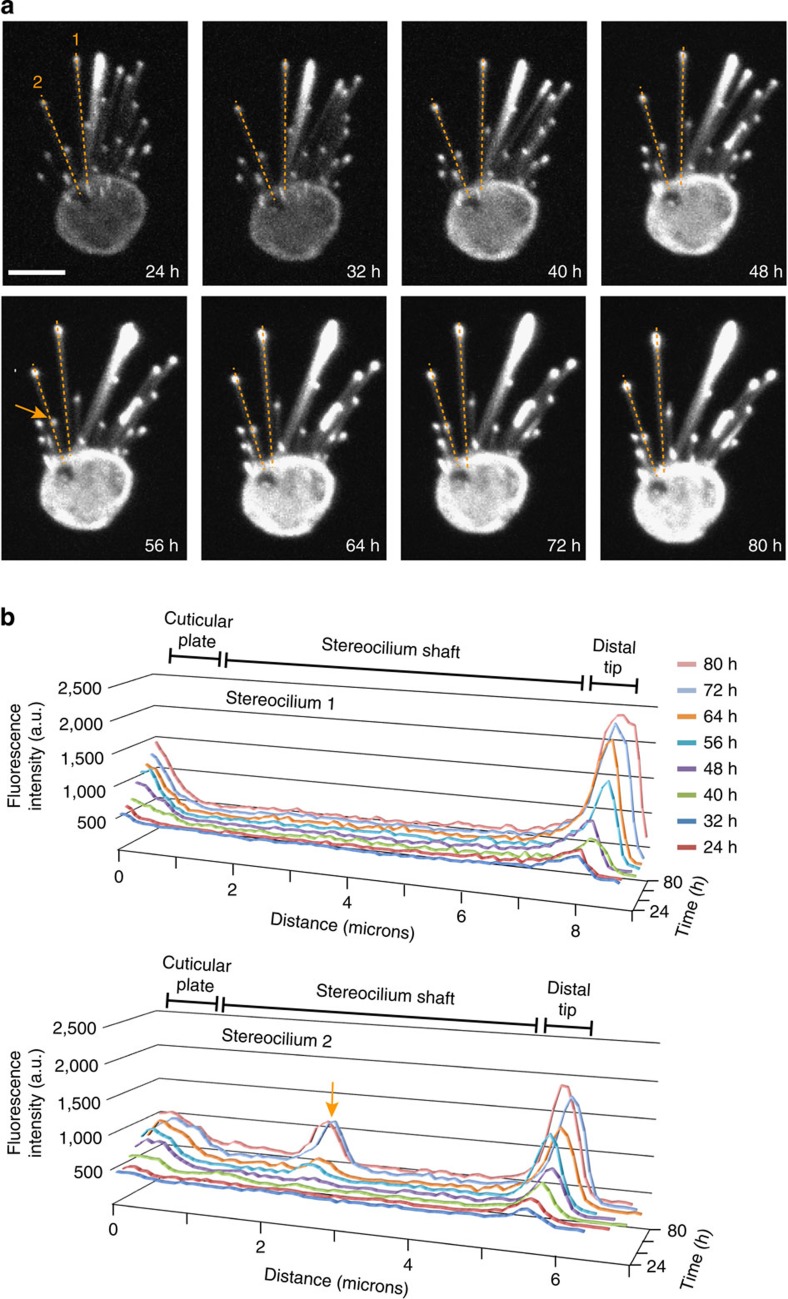
Figure 2
Quantification of intensity profiles along the lengths of stereocilia.
( a ) Still frames from a live-imaged hair cell with stable localization of EGFP-u03b2-actin in the distal tip compartment. Dashed lines (orange) indicate stereocilia that were line-traced every 8u200...
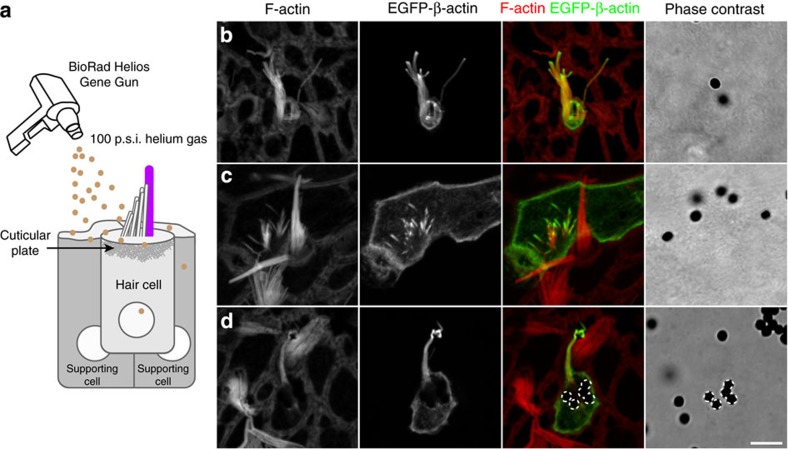
Figure 3
Biolistic gene gun transfection may result in damage to hair cells.
( a ) Penetration of the 1u2009u03bcm gold DNA-coated particles through the cell membrane and cuticular plate of hair cells results in successful transfection of plasmid DNA; however, bullets can stri...
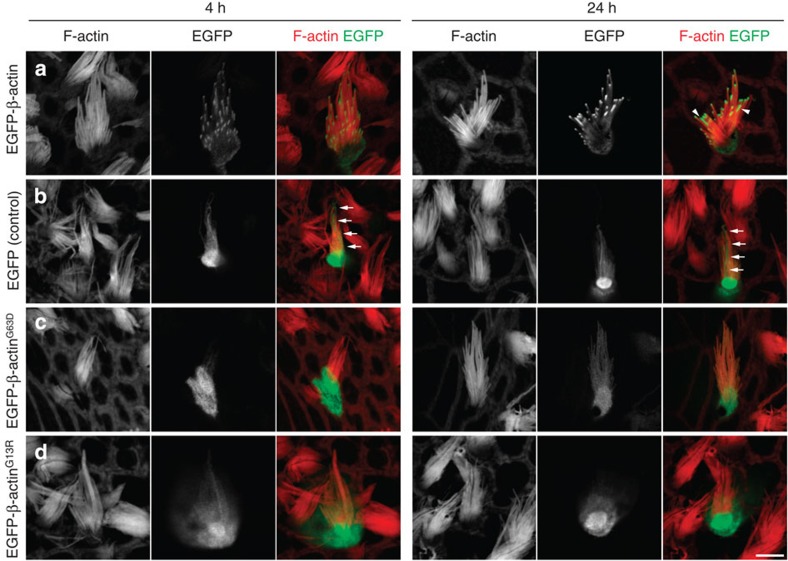
Figure 4
Localization of EGFP-u03b2-actin at stereocilia tips is polymerization dependent.
Localization of wild-type EGFP-u03b2-actin, EGFP alone (negative control), and mutant EGFP-u03b2-actin G63D or mutant EGFP-u03b2-actin G13R (green) at 4 and 24u2009h post transfection. ( a ) Wild-type...
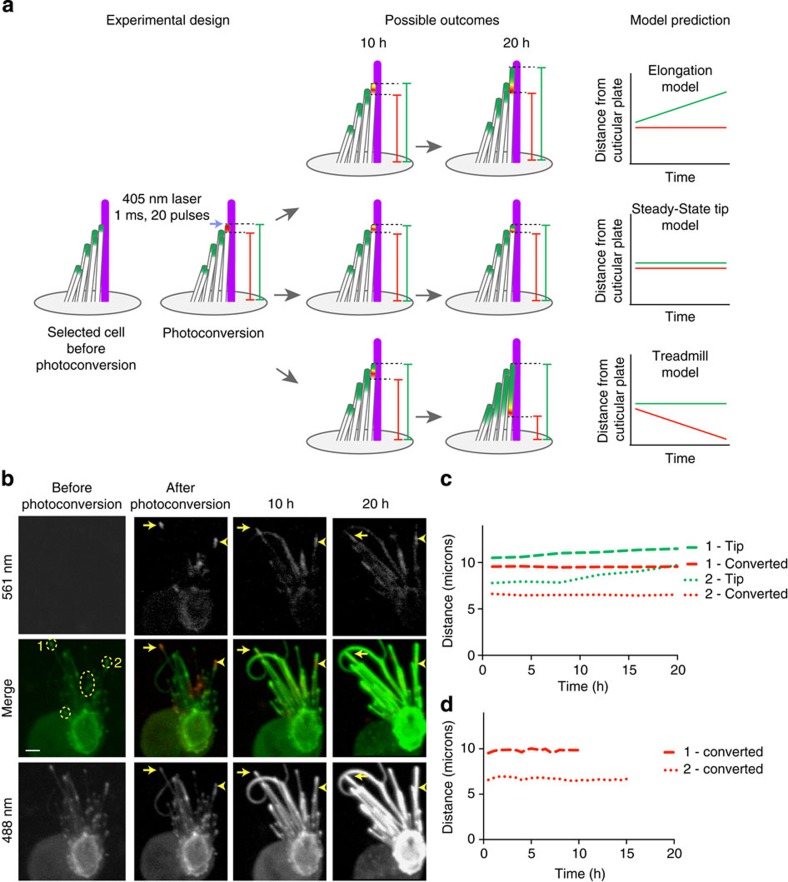
Figure 5
Photoconversion of dendra2-u03b2-actin reveals stable actin in stereocilia cores.
( a ) Schematic of the experimental design, possible outcomes of the experiment and theoretical data of each predicted model. Cultured utricles biolistically transfected with pDendra2-u03b2-actin were...
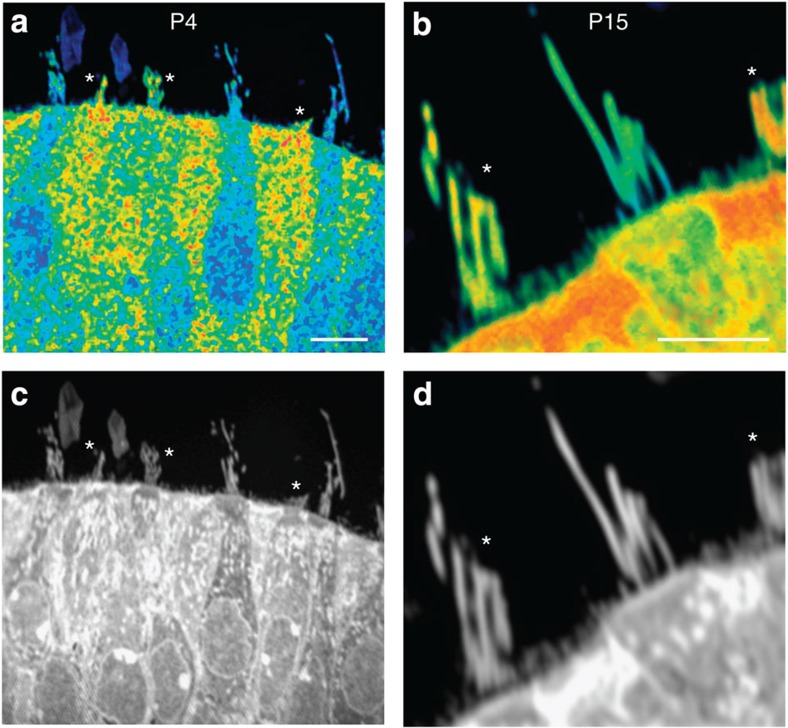
Figure 6
Postnatal stereociliogenesis is detected with MIMS.
Representative images of mouse utricles at postnatal day 4 (P4) and P15. The 15 N/ 14 N ratio is illustrated in pseudocolour, with blue indicating low and red indicating high incorporation of 15 N int...
Figure images are served from the NIH/NLM PubMed Central Open Access Subset or Europe PMC; copyright remains with the publishers and authors.
💬 Discussion
0 commentsNo comments yet. Be the first to start a discussion!
Leave a Comment