Abstract
We describe a ribonucleic acid (RNA) reporter system for live-cell imaging of gene expression to detect changes in polymerase II activity on individual promoters in individual cells. The reporters use strings of RNA aptamers that constitute IMAGEtags (Intracellular MultiAptamer GEnetic tags) that can be expressed from a promoter of choice. For imaging, the cells are incubated with their ligands that are separately conjugated with one of the FRET pair, Cy3 and Cy5. The IMAGEtags were expressed in yeast from the GAL1, ADH1 or ACT1 promoters. Transcription from all three promoters was imaged in live cells and transcriptional increases from the GAL1 promoter were observed with time after adding galactose. Expression of the IMAGEtags did not affect cell proliferation or endogenous gene expression. Advantages of this method are that no foreign proteins are produced in the cells that could be toxic or otherwise influence the cellular response as they accumulate, the IMAGEtags are short lived and oxygen is not required to generate their signals. The IMAGEtag RNA reporter system provides a means of tracking changes in transcriptional activity in live cells and in real time.
🔬 Techniques
🧬 Organisms
💻 Software
✨ Fluorophores
🧪 Sample Preparation
🏭 Microscope Brands
🧪 Reagent Suppliers
💻 Software Details
🏛️ Research Organizations (ROR)
Affiliated research institutions:
📋 Methods
Solutions and reagents Buffer IC (13.5-mM NaCl, 150-mM KCl, 0.22-mM Na 2 HPO 4 , 0.44-mM KH 2 PO 4 , 100-μM MgSO 4 , 120-nM CaCl 2 , 120-μM MgCl 2 , 20-mM HEPES (4-(2-hydroxyethyl)-1-piperazineethanesulfonic acid), pH 7.3 at 24°C), which was formulated to approximate intracellular pH and cation concentrations based on literature reports for these values ( 12–16 ), was used to determine binding constants of various aptamer–ligand interactions. Tris buffered saline (TBS: 50-mM Tris-HCl, 150-mM NaCl and pH 7.6) was used in yeast cell imaging studies. Chemical syntheses of ligands and the properties of the synthetic products are found in the Supplementary material (including Supplementary Figures S1–S3).
Yeast and plasmids
Saccharomyces cerevisiae (BY4735, Genotype: MATαade2Δ::hisGhis3Δ200leu2delta0 met15Δ0trp1Δ63ura3Δ0) was cultured in YPD medium (Yeast extract-peptone-dextrose medium). The yeast expression plasmid, pYES2, is a yeast 2-µm plasmid carrying a URA3 marker and a GAL1 promoter for galactose inducible gene expression in S. cerevisiae . The pYES2 plasmid was modified to express IMAGEtag reporter RNAs consisting of a series of tandem aptamers (Supplementary Figure S4) with specificities for 2-[[(3-Aminophenyl)methyl]amino]-6-(2,6-dichlorophenyl)-8-methyl-pyrido[2,3-d]pyrimidin-7(8H)-one (PDC) ( 17 ) or tobramycin (Supplementary Figure S5). The IMAGEtag sequences were inserted after the GAL1 promoter and a transcriptional start site (sequences in Supplementary Table S2). The GAL1 promoter was replaced with the ACT1 or ADH1 promoters from yeast to generate expression constructs with the 6xPDC IMAGEtags downstream from these constitutive promoters. Plasmids with IMAGEtag reporters were transformed into BY4735 using the Lazy Bones yeast transformation method and selection on SD (synthetic dropout) minus uracil (SD−uracil) plates ( 18 ). The IMAGEtags are identified by the number of aptamers per string and the identity of the aptamer in the IMAGEtag. For example, the 5xTOB IMAGEtag contains five tobramycin aptamers each separated by a 4-nucleotide (A 4 ) linker and the 6xPDC IMAGEtag contains six PDC aptamers separated by a 4-nucleotide (A 4 ) linker. FRET image acquisition and analysis For FRET analysis by sensitized emission, yeast cells were cultured in SD−uracil medium overnight with either 2% glucose or 2% raffinose. The cells were then induced with SD−uracil medium containing 2% galactose and 1% raffinose for the induction period and incubated with the Cy3- and Cy5-modified ligands. Cells were either washed once with TBS or washed and resuspended in SD−uracil with 2% galactose and 1% raffinose. A 30-μl volume was placed on a poly L-lysine-coated cover glass or a poly D-lysine-coated glass bottom culture dish (MatTek). The cells were observed using a Nikon Eclipse 200 or Leica SP5X laser scanning confocal microscope with a 63X objective and immersion oil. Cells were excited by a 568-nm Argon/Krypton laser (Nikon) or a 550-nm (for Cy3); 650-nm (for Cy5) white light laser (WLL, Leica) and images were taken to measure sensitized emission using emission filters for FRET of 700–750 nm (TOB IMAGEtags; Nikon) or 660–710 nm (TOB IMAGEtags; Leica)/660–754 (6xPDC IMAGEtags; Leica) nm for the Cy5 acceptor and 560–626 nm for the Cy3 donor. To quantify the FRET signals from sensitized emission, the mean fluorescence intensities from the cells were determined by summing through the Z stack to provide pixel volumes (relative intensities). The mean fluorescence intensities for the donor and sensitized emission of the acceptor were calculated by the Leica LAS AF Lite software as Σ(Pixel volumes)/(Pixel count). FRET was determined by normalizing the sensitized emission to the donor emission ( FRET = F FRET / F donor ). Quantification was also done using the formula FRET = ( B−A · b−c · C )/ C , where B is FRET emission, A is donor emission, b is donor emission cross talk ratio ( B in donor only sample/ A in donor only sample), c is acceptor excitation crosstalk ( B in acceptor only sample/ C in acceptor only sample), ratio, C is acceptor emission ( 19 ). This latter calculation is most appropriate for application to cell studies because variations in intracellular concentrations of the two dye-labeled ligands are accounted for separately in the formula. For FRET analysis by acceptor photobleaching, cells were grown in SD−uracil containing 2% galactose for a 30-min induction period and then incubated together with a mixture of 25 μM each of Cy3- and Cy5-tobramycin or 20 μM each of Cy3- and Cy5-PDC in SD−uracil containing 2% galactose. These concentrations and the ratios of donor to acceptor were also varied between experiments to achieve equal intracellular levels of both. For experiments in which the concentrations were different from those described here, the concentrations of ligands are stated in the legend to the figure. The cells were washed once with TBS and placed on a poly d-lysine-coated glass bottom culture dish. Acceptor bleaching was performed with a Leica SP5X laser scanning confocal microscope using the FRET acceptor bleaching wizard. Prebleach and postbleach images were taken serially with excitation of 550 nm of WLL with lower laser intensity and filters of 560–640 nm (5xTOB IMAGEtags) or 560–626 nm (6xPDC IMAGEtags) for collecting Cy3 emission and 660–710 nm (5xTOB IMAGEtags) or 660–754 nm (6xPDC IMAGEtags) for Cy5 emission. The acceptor was bleached with high laser intensity at 650 nm of WLL. The fluorescence intensities of the donor prebleach (F D ) and postbleach (F' D ) conditions were measured by using the LAS AF Lite program. The FRET efficiencies were calculated using the formula FRET efficiency = 1−F D /F' D ( 20 ).
Show full methods section
Solutions and reagents Buffer IC (13.5-mM NaCl, 150-mM KCl, 0.22-mM Na 2 HPO 4 , 0.44-mM KH 2 PO 4 , 100-μM MgSO 4 , 120-nM CaCl 2 , 120-μM MgCl 2 , 20-mM HEPES (4-(2-hydroxyethyl)-1-piperazineethanesulfonic acid), pH 7.3 at 24°C), which was formulated to approximate intracellular pH and cation concentrations based on literature reports for these values ( 12–16 ), was used to determine binding constants of various aptamer–ligand interactions. Tris buffered saline (TBS: 50-mM Tris-HCl, 150-mM NaCl and pH 7.6) was used in yeast cell imaging studies. Chemical syntheses of ligands and the properties of the synthetic products are found in the Supplementary material (including Supplementary Figures S1–S3).
Yeast and plasmids
Saccharomyces cerevisiae (BY4735, Genotype: MATαade2Δ::hisGhis3Δ200leu2delta0 met15Δ0trp1Δ63ura3Δ0) was cultured in YPD medium (Yeast extract-peptone-dextrose medium). The yeast expression plasmid, pYES2, is a yeast 2-µm plasmid carrying a URA3 marker and a GAL1 promoter for galactose inducible gene expression in S. cerevisiae . The pYES2 plasmid was modified to express IMAGEtag reporter RNAs consisting of a series of tandem aptamers (Supplementary Figure S4) with specificities for 2-[[(3-Aminophenyl)methyl]amino]-6-(2,6-dichlorophenyl)-8-methyl-pyrido[2,3-d]pyrimidin-7(8H)-one (PDC) ( 17 ) or tobramycin (Supplementary Figure S5). The IMAGEtag sequences were inserted after the GAL1 promoter and a transcriptional start site (sequences in Supplementary Table S2). The GAL1 promoter was replaced with the ACT1 or ADH1 promoters from yeast to generate expression constructs with the 6xPDC IMAGEtags downstream from these constitutive promoters. Plasmids with IMAGEtag reporters were transformed into BY4735 using the Lazy Bones yeast transformation method and selection on SD (synthetic dropout) minus uracil (SD−uracil) plates ( 18 ). The IMAGEtags are identified by the number of aptamers per string and the identity of the aptamer in the IMAGEtag. For example, the 5xTOB IMAGEtag contains five tobramycin aptamers each separated by a 4-nucleotide (A 4 ) linker and the 6xPDC IMAGEtag contains six PDC aptamers separated by a 4-nucleotide (A 4 ) linker. FRET image acquisition and analysis For FRET analysis by sensitized emission, yeast cells were cultured in SD−uracil medium overnight with either 2% glucose or 2% raffinose. The cells were then induced with SD−uracil medium containing 2% galactose and 1% raffinose for the induction period and incubated with the Cy3- and Cy5-modified ligands. Cells were either washed once with TBS or washed and resuspended in SD−uracil with 2% galactose and 1% raffinose. A 30-μl volume was placed on a poly L-lysine-coated cover glass or a poly D-lysine-coated glass bottom culture dish (MatTek). The cells were observed using a Nikon Eclipse 200 or Leica SP5X laser scanning confocal microscope with a 63X objective and immersion oil. Cells were excited by a 568-nm Argon/Krypton laser (Nikon) or a 550-nm (for Cy3); 650-nm (for Cy5) white light laser (WLL, Leica) and images were taken to measure sensitized emission using emission filters for FRET of 700–750 nm (TOB IMAGEtags; Nikon) or 660–710 nm (TOB IMAGEtags; Leica)/660–754 (6xPDC IMAGEtags; Leica) nm for the Cy5 acceptor and 560–626 nm for the Cy3 donor. To quantify the FRET signals from sensitized emission, the mean fluorescence intensities from the cells were determined by summing through the Z stack to provide pixel volumes (relative intensities). The mean fluorescence intensities for the donor and sensitized emission of the acceptor were calculated by the Leica LAS AF Lite software as Σ(Pixel volumes)/(Pixel count). FRET was determined by normalizing the sensitized emission to the donor emission ( FRET = F FRET / F donor ). Quantification was also done using the formula FRET = ( B−A · b−c · C )/ C , where B is FRET emission, A is donor emission, b is donor emission cross talk ratio ( B in donor only sample/ A in donor only sample), c is acceptor excitation crosstalk ( B in acceptor only sample/ C in acceptor only sample), ratio, C is acceptor emission ( 19 ). This latter calculation is most appropriate for application to cell studies because variations in intracellular concentrations of the two dye-labeled ligands are accounted for separately in the formula. For FRET analysis by acceptor photobleaching, cells were grown in SD−uracil containing 2% galactose for a 30-min induction period and then incubated together with a mixture of 25 μM each of Cy3- and Cy5-tobramycin or 20 μM each of Cy3- and Cy5-PDC in SD−uracil containing 2% galactose. These concentrations and the ratios of donor to acceptor were also varied between experiments to achieve equal intracellular levels of both. For experiments in which the concentrations were different from those described here, the concentrations of ligands are stated in the legend to the figure. The cells were washed once with TBS and placed on a poly d-lysine-coated glass bottom culture dish. Acceptor bleaching was performed with a Leica SP5X laser scanning confocal microscope using the FRET acceptor bleaching wizard. Prebleach and postbleach images were taken serially with excitation of 550 nm of WLL with lower laser intensity and filters of 560–640 nm (5xTOB IMAGEtags) or 560–626 nm (6xPDC IMAGEtags) for collecting Cy3 emission and 660–710 nm (5xTOB IMAGEtags) or 660–754 nm (6xPDC IMAGEtags) for Cy5 emission. The acceptor was bleached with high laser intensity at 650 nm of WLL. The fluorescence intensities of the donor prebleach (F D ) and postbleach (F' D ) conditions were measured by using the LAS AF Lite program. The FRET efficiencies were calculated using the formula FRET efficiency = 1−F D /F' D ( 20 ).
Quantitative analysis of IMAGEtag transcripts by RT-qPCR
Steady-state levels of mRNAs were analyzed by quantitative reverse transcriptase-polymerase chain reaction (RT-qPCR). Yeast RNA was extracted by phenol chloroform using glass beads ( 21 ). Cells were harvested in 0.6 ml of RNA extraction buffer (10-mM ethylenediaminetetraacetic acid, 50-mM Tris-HCl pH 7.5, 0.1-M NaCl, 5% sodium dodecyl sulphate) and 0.6 ml of phenol:chloroform:isoamyl alcohol (49.5:49.5:1). After 6-min incubation at room temperature, ∼0.2 g of glass beads (0.45-mm diameter) was added and the cells were lysed by vigorous agitation for 2 min. Following centrifugation, the aqueous phase was collected; the RNA was precipitated by ethanol, dissolved in water and then treated with RNase-free DNase I (1 U/ml, Invitrogen) at 24°C for 15 min to remove traces of genomic deoxyribonucleic acid (DNA). One microgram of RNA was transcribed to create cDNA using the SuperScript III reverse transcriptase (Invitrogen) and oligo-dT as a primer in a final volume of 20 μl. After reverse transcription, 2 μl of a 1:2-diluted cDNA was used as a template for qPCR with SYBRgreen (Invitrogen) and Taq polymerase (New England BioLabs) into a final volume of 15 μl in the Opticon (Bio-Rad). The forward 4659 (AAGCTTAAAAATTTCGAGCATGCATCT) and reverse 4657 (CCTAGACTTCAGGTTGTCTAACTCC) primers were located outside the IMAGEtag sequences. The levels of galactokinase mRNA, the endogenous positive control for activity of the GAL1 promoter, were determined by PCR amplification with the forward primer 4654 (TTTGATATGCTTTGC GCCGTC) and the reverse primer 4655 (AGTCCGACACAGAAGGATCAATT). The IMAGEtag and galactokinase RNA expression levels were normalized to the ACT1 mRNA levels, which were determined in the same samples using the forward and reverse primers 4609 (ATTCTGAGGTTGCTGCTTT) and 4610 (GTCCCAGTTGGTGACAATAC), respectively. The PCR thermal cycling conditions were 5-min denaturation at 94°C; 40 cycles at 94°C for 15 s, 60°C for 15 s and 72°C for 15 s.
SUPPLEMENTARY DATA Supplementary Data are available at NAR Online, including [1–9]. SUPPLEMENTARY DATA
📊 Figures
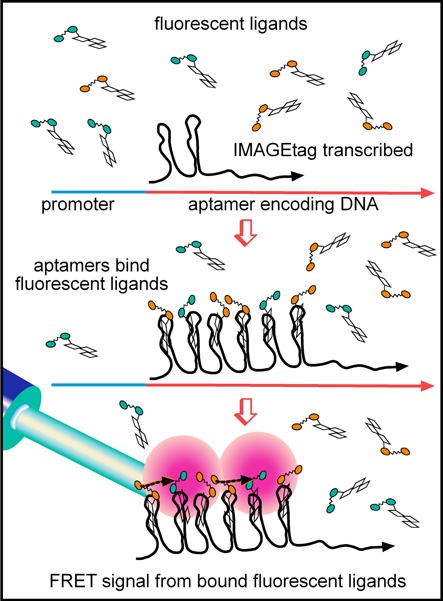
Figure 1.
Schematic diagram of the IMAGEtag system. IMAGEtags (Intracellular Multiaptamer GEnetic tags) are tandemly repeated aptamers that are transcribed in the cells as an mRNA construct from a promoter of c...
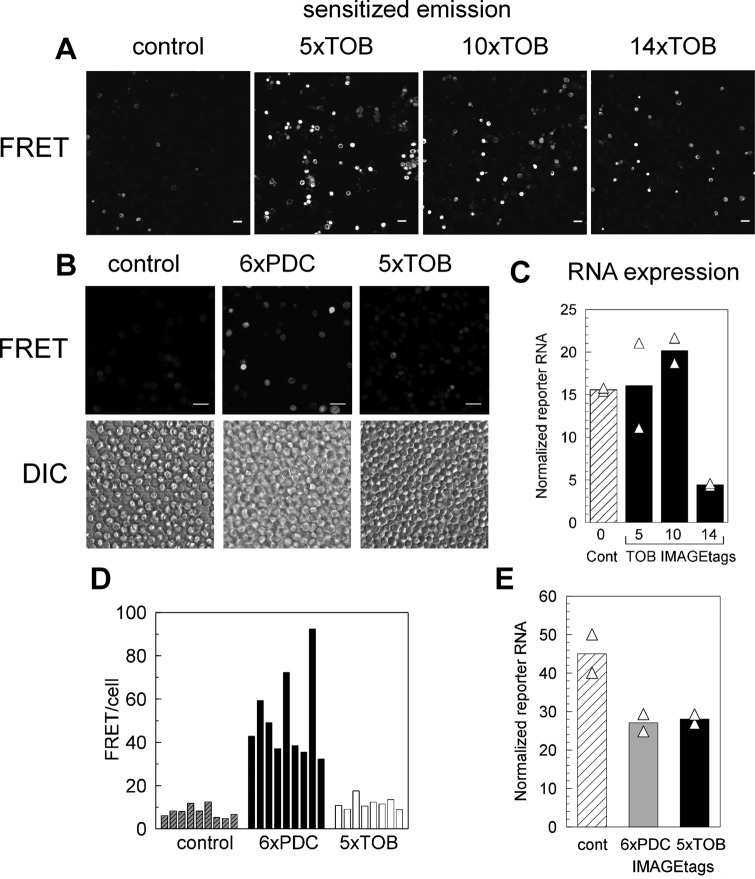
Figure 2.
Analysis of IMAGEtags expressed in yeast. The FRET signal from ligand-bound IMAGEtags was detected by sensitized emission. Images of fluorescent yeast cells expressing IMAGEtags from the GAL1 promoter...
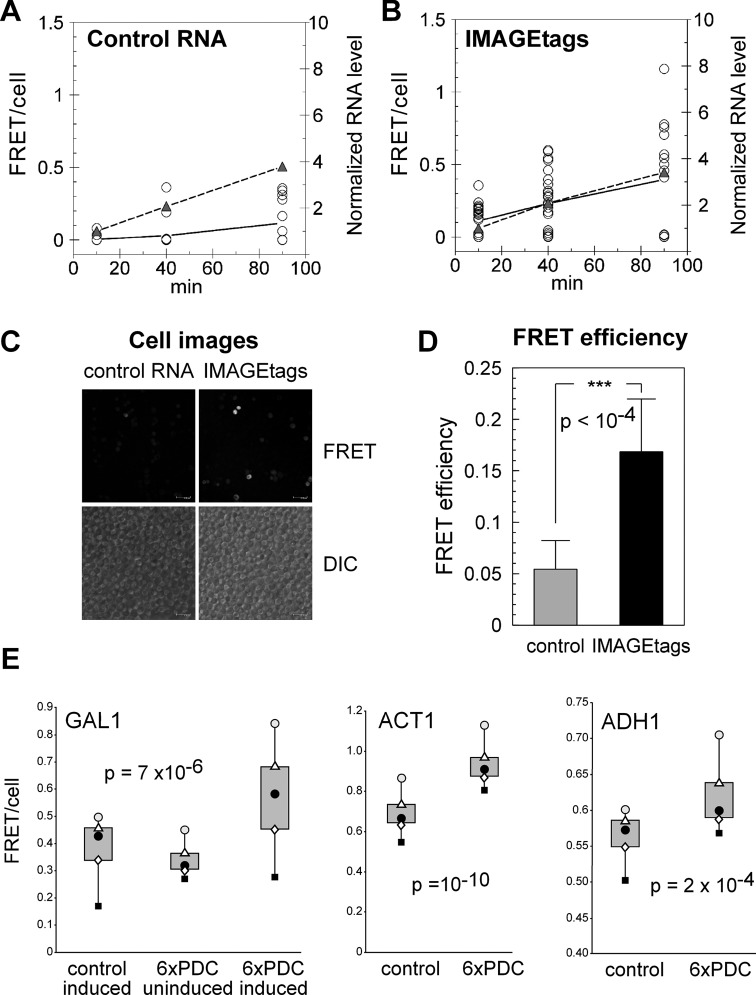
Figure 3.
Time-dependent change in IMAGEtag RNA level after activation of the GAL1 promoter. Yeast cells transformed with a 2-u00b5m plasmid for expression of control RNA ( A ) or 6xPDC IMAGEtags ( B ) both und...
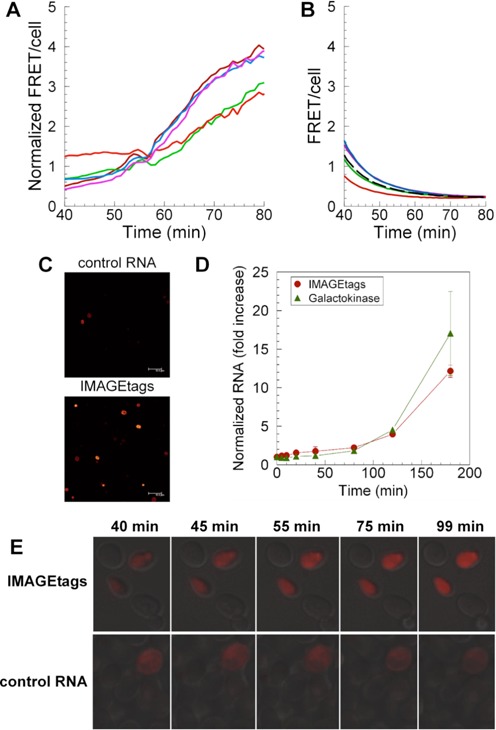
Figure 4.
Real-time analysis of FRET upon induction of the GAL1 promoter. ( A ) Yeast cells containing 6xPDC IMAGEtags downstream from the GAL1 promoter were preincubated with 5-u03bcM Cy3-PDC and 5-u03bcM Cy5-...
Figure images are served from the NIH/NLM PubMed Central Open Access Subset or Europe PMC; copyright remains with the publishers and authors.
💬 Discussion
0 commentsNo comments yet. Be the first to start a discussion!
Leave a Comment