Abstract
Polycomb-repressive complex 2 (PRC2) is a histone methyltransferase that promotes epigenetic gene silencing, but the dynamics of its interactions with chromatin are largely unknown. Here we quantitatively measured the binding of PRC2 to chromatin in human cancer cells. Genome editing of a HaloTag into the endogenous EZH2 and SUZ12 loci and single-particle tracking revealed that ∼80% of PRC2 rapidly diffuses through the nucleus, while ∼20% is chromatin-bound. Short-term treatment with a small molecule inhibitor of the EED-H3K27me3 interaction had no immediate effect on the chromatin residence time of PRC2. In contrast, separation-of-function mutants of SUZ12, which still form the core PRC2 complex but cannot bind accessory proteins, revealed a major contribution of AEBP2 and PCL homolog proteins to chromatin binding. We therefore quantified the dynamics of this chromatin-modifying complex in living cells and separated the contributions of H3K27me3 histone marks and various PRC2 subunits to recruitment of PRC2 to chromatin.
🔬 Techniques
🔭 Microscopes
🧬 Organisms
✨ Fluorophores
🧪 Sample Preparation
🔬 Cell Lines
🏭 Microscope Brands
🧪 Reagent Suppliers
💻 Software Details
🏛️ Research Organizations (ROR)
Affiliated research institutions:
📋 Methods
Tissue culture, A-395 treatment, and transfections All cell lines were maintained in Dulbecco's modified Eagle medium containing 10% FBS, 2 mM GlutaMAX-I, 100 U/mL penicillin, and 100 µg/mL streptomycin (complete medium) in a humidified incubator at 37°C and 5% CO 2 . Both A-395N and A-395 were dissolved in DMSO to a working concentration of 10 mM. HaloTag-EZH2 U2OS cells (2.5 × 10 5 ) were plated in one well of a 6-well dish with either 10 µM A-395N or 10 µM A-395. After treating cells for 55 h, 5 × 10 5 cells were split into imaging dishes and imaged ∼17 h later. All U2OS cells were transfected using a Nucleofector 2b device (Lonza) and kit V (Lonza, VCA-1003) per the manufacturer's protocol using 1.5 µg of plasmid DNA ± 150 pmol siRNA. Transfected U2OS cells used for imaging were grown for 48 h after transfection and then split onto imaging dishes. All HEK293T cells were transfected using Lipofectamine 2000 (Thermo Fisher, 11668019) per the manufacturer's protocol.
Plasmid construction and oligonucleotide sequences px330 plasmids
EZH2 and SUZ12 sgRNAs were inserted into px330 plasmids as described in Cong et al. (2013) using the following spacer sequences: GAGAAGGGACCAGTTTGTTGG for EZH2 and GCCTCCCCCGGACCCCGCGC for SUZ12. Homology-directed repair (HDR) plasmids HDR vectors were generated using Gibson assembly (New England Biosciences, E2611) and PCR from genomic DNA. PRC2 cDNA plasmids cDNA expression plasmids were generated by restriction enzyme cloning and PCR mutagenesis. All SUZ12 mutations refer to the SUZ12 isoform 1 (739 amino acids). OnTarget plus siRNAs to the SUZ12 3′ UTR were ordered individually from Dharmacon and then pooled together for transfections using the following SUZ12 siRNA sense strand sequences: AGAUGUAGGUGUAGAAUUAUU, GAUCAAUGCUGCUGUAAAUUU, UAGUAGAUCUCGAGCGUUUUU, and UUAGAUAAUCACACGGAAAUU. CRISPR/Cas9 genome editing and genomic DNA extraction HaloTag genome editing was performed as reported previously ( Xi et al. 2015 ). In brief, 10 6 F42B8 cells (a kind gift from Karsten Rippe) were transfected using a Nucleofector 2b device (Lonza) and kit V (Lonza, VCA-1003) per the manufacturer's protocol with px330 plasmid and HDR vector. To select for genomic integration of the HDR plasmid, cells were trypsinized and expanded to a 10-cm 2 dish in complete medium supplemented with 1 µg/mL puromycin (Sigma-Aldrich, P8833) 48 h after the transfection. Cells were selected with puromycin for a total of 7 d. Of the surviving cells, 10 6 were transfected with 2 µg of pBS598 EF1α-EGFPcre recombinase plasmid. pBS598 EF1α-EGFPcre was a gift from Brian Sauer (Addgene, 11923) ( Le et al. 1999 ). Forty-eight hours after transfection, single cells were sorted into single wells of a 96-well plate using fluorescence-activated cell sorting at an excitation wavelength of 488 nm. After clones grew out, genomic DNA was extracted based on the protocol reported in Laird et al. (1991) . Oligos used for PCR were as follows: DY 132 (EZH2 LHA up [F], GCTGCAGCATCATCTAACCTGG), DY 135 (EZH2 RHA down [R], CAGTGAGTCAGAAAACCTTGCTC), DY 137 (SUZ12 LHA up [F], CATCTTGTCCAACCTGAAATTCAAATC), and DY 138 (SUZ12 RHA down [R], GGGAACCAATCAGGATATAACATTCC). Whole-cell Western blot analysis Cells (10 6 ) were resuspended in 1× NuPAGE LDS sample buffer (Thermo Fisher Scientific, NP0008) supplemented with 36 mM β-mercaptoethanol (Sigma-Aldrich, M6250) and 2500 U/mL benzonase (Sigma-Aldrich, E1014). The cell resuspension was heated for 15 min to 37°C and for 5 min to 98°C, placed for 30 sec on ice, and spun at >13,000 rcf for 30 sec. The protein extracts and 7.5 µL of protein ladder (SeeBlue Plus 2, Invitrogen, LC5925) were run on NuPAGE 4%–12% Bis-Tris protein gels (Thermo Fisher Scientific, NP0321) for 1 h at 150 V. The gels were transferred using standard Western blotting protocols onto 0.45-µm nitrocellulose membranes (GE Healthcare, 10600002). Blots were blocked in StartingBlock T20 (PBS) blocking buffer (Thermo Fisher, 37539). All primary and secondary antibodies were diluted in StartingBlock T20 (PBS) blocking buffer (Thermo Fisher, 37539). Primary and secondary antibody incubations were washed four times in PBS + 0.05% Tween-20 and once in PBS. All Western blots were quantified using ImageQuant TL. The following antibodies were used at the indicated dilutions: EED (1/200; Abcam, 4469), EZH2 (1/1000; Cell Signaling, 5246), Flag-HRP (1/2500; Sigma-Aldrich, A8592), H3 (1/1000; Abcam, 1791), H3K27me3 (1/500; Cell Signaling, 9733), SUZ12 (1/200; Santa Cruz Biotechnology, sc-67105), RbAp46/48 (1/1000; Cell Signaling, 4633), HA (1/1000; Abcam, 18181), Myc (1/1000; Cell Signaling, 2272), goat α-mouse IgG-HRP (1/5000; Jackson ImmunoResearch, 715-035-150), and goat α-rabbit IgG-HRP (1/5000; Jackson ImmunoResearch, 715-035-152). Flag immunoprecipitation on ectopically expressed 3xFlag-SUZ12 HEK293T cells (1.25 × 10 6 ) were plated in wells of a six-well dish ∼17 h before transfection. Forty-eight hours after transfection, cells were trypsin-harvested and washed twice with cold 1× PBS. Cells were lysed in 250 µL of cold NP-40 lysis buffer (1% nonidet P 40 substitute [Sigma-Aldrich, 74385], 25 mM Tris at pH 7.5, 5% glycerol, 150 mM NaCl, 2.5 mM MgCl 2 , 1× protease inhibitor cocktail [Thermo Fisher, A32965], 2 mM tris [2-carboxyethyl] phosphine [TCEP] at pH 7.0 [Thermo Fisher, 20490], 250 U/mL benzonase [Sigma-Aldrich, E1014]) for 30 min on ice with vortexing every 5 min. Cell lysate was clarified by centrifugation at >13,000 rcf for 10 min at 4°C. Lysate (150 µL) was bound to 15 µL of pre-equilibrated anti-Flag affinity resin (Sigma-Aldrich, A2220) resuspended in 50 µL of lysis buffer. The binding was performed for 2 h at 4°C, rotating end over end. Beads were then washed four times with wash buffer (1% nonidet P 40 substitute [Sigma-Aldrich, 74385], 25 mM Tris at pH 7.5, 5% glycerol, 150 mM NaCl, 2.5 mM MgCl 2 ,) at room temperature. The final wash was completely removed, and bound proteins were eluted for 30 min at room temperature in 60 µL of wash buffer supplemented with 150 ng/µL 3xFlag peptide (Sigma-Aldrich, F4799).
Show full methods section
Tissue culture, A-395 treatment, and transfections All cell lines were maintained in Dulbecco's modified Eagle medium containing 10% FBS, 2 mM GlutaMAX-I, 100 U/mL penicillin, and 100 µg/mL streptomycin (complete medium) in a humidified incubator at 37°C and 5% CO 2 . Both A-395N and A-395 were dissolved in DMSO to a working concentration of 10 mM. HaloTag-EZH2 U2OS cells (2.5 × 10 5 ) were plated in one well of a 6-well dish with either 10 µM A-395N or 10 µM A-395. After treating cells for 55 h, 5 × 10 5 cells were split into imaging dishes and imaged ∼17 h later. All U2OS cells were transfected using a Nucleofector 2b device (Lonza) and kit V (Lonza, VCA-1003) per the manufacturer's protocol using 1.5 µg of plasmid DNA ± 150 pmol siRNA. Transfected U2OS cells used for imaging were grown for 48 h after transfection and then split onto imaging dishes. All HEK293T cells were transfected using Lipofectamine 2000 (Thermo Fisher, 11668019) per the manufacturer's protocol.
Plasmid construction and oligonucleotide sequences px330 plasmids
EZH2 and SUZ12 sgRNAs were inserted into px330 plasmids as described in Cong et al. (2013) using the following spacer sequences: GAGAAGGGACCAGTTTGTTGG for EZH2 and GCCTCCCCCGGACCCCGCGC for SUZ12. Homology-directed repair (HDR) plasmids HDR vectors were generated using Gibson assembly (New England Biosciences, E2611) and PCR from genomic DNA. PRC2 cDNA plasmids cDNA expression plasmids were generated by restriction enzyme cloning and PCR mutagenesis. All SUZ12 mutations refer to the SUZ12 isoform 1 (739 amino acids). OnTarget plus siRNAs to the SUZ12 3′ UTR were ordered individually from Dharmacon and then pooled together for transfections using the following SUZ12 siRNA sense strand sequences: AGAUGUAGGUGUAGAAUUAUU, GAUCAAUGCUGCUGUAAAUUU, UAGUAGAUCUCGAGCGUUUUU, and UUAGAUAAUCACACGGAAAUU. CRISPR/Cas9 genome editing and genomic DNA extraction HaloTag genome editing was performed as reported previously ( Xi et al. 2015 ). In brief, 10 6 F42B8 cells (a kind gift from Karsten Rippe) were transfected using a Nucleofector 2b device (Lonza) and kit V (Lonza, VCA-1003) per the manufacturer's protocol with px330 plasmid and HDR vector. To select for genomic integration of the HDR plasmid, cells were trypsinized and expanded to a 10-cm 2 dish in complete medium supplemented with 1 µg/mL puromycin (Sigma-Aldrich, P8833) 48 h after the transfection. Cells were selected with puromycin for a total of 7 d. Of the surviving cells, 10 6 were transfected with 2 µg of pBS598 EF1α-EGFPcre recombinase plasmid. pBS598 EF1α-EGFPcre was a gift from Brian Sauer (Addgene, 11923) ( Le et al. 1999 ). Forty-eight hours after transfection, single cells were sorted into single wells of a 96-well plate using fluorescence-activated cell sorting at an excitation wavelength of 488 nm. After clones grew out, genomic DNA was extracted based on the protocol reported in Laird et al. (1991) . Oligos used for PCR were as follows: DY 132 (EZH2 LHA up [F], GCTGCAGCATCATCTAACCTGG), DY 135 (EZH2 RHA down [R], CAGTGAGTCAGAAAACCTTGCTC), DY 137 (SUZ12 LHA up [F], CATCTTGTCCAACCTGAAATTCAAATC), and DY 138 (SUZ12 RHA down [R], GGGAACCAATCAGGATATAACATTCC). Whole-cell Western blot analysis Cells (10 6 ) were resuspended in 1× NuPAGE LDS sample buffer (Thermo Fisher Scientific, NP0008) supplemented with 36 mM β-mercaptoethanol (Sigma-Aldrich, M6250) and 2500 U/mL benzonase (Sigma-Aldrich, E1014). The cell resuspension was heated for 15 min to 37°C and for 5 min to 98°C, placed for 30 sec on ice, and spun at >13,000 rcf for 30 sec. The protein extracts and 7.5 µL of protein ladder (SeeBlue Plus 2, Invitrogen, LC5925) were run on NuPAGE 4%–12% Bis-Tris protein gels (Thermo Fisher Scientific, NP0321) for 1 h at 150 V. The gels were transferred using standard Western blotting protocols onto 0.45-µm nitrocellulose membranes (GE Healthcare, 10600002). Blots were blocked in StartingBlock T20 (PBS) blocking buffer (Thermo Fisher, 37539). All primary and secondary antibodies were diluted in StartingBlock T20 (PBS) blocking buffer (Thermo Fisher, 37539). Primary and secondary antibody incubations were washed four times in PBS + 0.05% Tween-20 and once in PBS. All Western blots were quantified using ImageQuant TL. The following antibodies were used at the indicated dilutions: EED (1/200; Abcam, 4469), EZH2 (1/1000; Cell Signaling, 5246), Flag-HRP (1/2500; Sigma-Aldrich, A8592), H3 (1/1000; Abcam, 1791), H3K27me3 (1/500; Cell Signaling, 9733), SUZ12 (1/200; Santa Cruz Biotechnology, sc-67105), RbAp46/48 (1/1000; Cell Signaling, 4633), HA (1/1000; Abcam, 18181), Myc (1/1000; Cell Signaling, 2272), goat α-mouse IgG-HRP (1/5000; Jackson ImmunoResearch, 715-035-150), and goat α-rabbit IgG-HRP (1/5000; Jackson ImmunoResearch, 715-035-152). Flag immunoprecipitation on ectopically expressed 3xFlag-SUZ12 HEK293T cells (1.25 × 10 6 ) were plated in wells of a six-well dish ∼17 h before transfection. Forty-eight hours after transfection, cells were trypsin-harvested and washed twice with cold 1× PBS. Cells were lysed in 250 µL of cold NP-40 lysis buffer (1% nonidet P 40 substitute [Sigma-Aldrich, 74385], 25 mM Tris at pH 7.5, 5% glycerol, 150 mM NaCl, 2.5 mM MgCl 2 , 1× protease inhibitor cocktail [Thermo Fisher, A32965], 2 mM tris [2-carboxyethyl] phosphine [TCEP] at pH 7.0 [Thermo Fisher, 20490], 250 U/mL benzonase [Sigma-Aldrich, E1014]) for 30 min on ice with vortexing every 5 min. Cell lysate was clarified by centrifugation at >13,000 rcf for 10 min at 4°C. Lysate (150 µL) was bound to 15 µL of pre-equilibrated anti-Flag affinity resin (Sigma-Aldrich, A2220) resuspended in 50 µL of lysis buffer. The binding was performed for 2 h at 4°C, rotating end over end. Beads were then washed four times with wash buffer (1% nonidet P 40 substitute [Sigma-Aldrich, 74385], 25 mM Tris at pH 7.5, 5% glycerol, 150 mM NaCl, 2.5 mM MgCl 2 ,) at room temperature. The final wash was completely removed, and bound proteins were eluted for 30 min at room temperature in 60 µL of wash buffer supplemented with 150 ng/µL 3xFlag peptide (Sigma-Aldrich, F4799).
Live-cell single-molecule imaging
Live-cell imaging dishes were prepared as follows: Schott Nexterion 1.5H 22-mm × 22-mm coverslips (170 µm ± 5 µm) were sonicated for 30 min in 1 M KOH and an additional 30 min in 200 proof ethanol (Decon Labs, 2701). The treated coverslips were attached to the bottoms of the 35-mm dishes containing a hole in the center using Sylgard 184 silicone elastomer kit (Dow Corning, 3097366-1004). Cells were plated on these coverslips ∼17 h before imaging and labeled with HaloTag Janelia fluor 646 (JF646 was a gift from the Lavis laboratory) for 30 sec in 37°C complete medium at a concentration that produced ∼10 localizations per frame ( Zhen et al. 2016 ). The concentrations used were 5 nM HaloTag-EZH2 and 25 nM HaloTag-SUZ12. Cells were imaged in 2 mL of FluoroBrite DMEM (Thermo Fisher, A1896701) at 37°C and 5% CO 2 . All single-molecule imaging was performed under high-incline laser conditions ( Tokunaga et al. 2008 ) on a Nikon N-Storm microscope described previously ( Schmidt et al. 2016 ). All imaging was performed using HiLo illumination ( Tokunaga et al. 2008 ). Diffusion imaging was performed at 97.5 fps, 25% AOTF, and continuous illumination, whereas lifetime analysis imaging was performed at 2 fps, 15% AOTF, and 31-msec exposures of intermittent illumination. n > 12 cells were analyzed for each biological replicate.
Single-particle tracking
Particles were localized and tracked using MatLab 2011b to run SLIMfast ( Serge et al. 2008 ). The trajectories of the particles were evaluated using evalSPT ( Normanno et al. 2015 ). Particle trajectories were visually inspected, revealing that most molecules were tracked correctly and that trajectories followed single molecules. Diffusion coefficients and fractions bound were obtained with Spot-On using the following parameters: KineticModel = two-state, dZ = 0.7 µm, TimePoints = seven, GapsAllowed = one, JumpsToConsider = four, MaxJump = 3 µm, LocError = 0.035 µm, D bound = [0.0005;0.08], D free = [0.15;25], Iterations = three, BinWidth = 0.01 µm, and ModelFit = CDF. For static particle residence time ( Fig. 4 C), we used the empirical cumulative distribution function (MatLab) on all tracked particles to determine the survival probability of each of the particles as a function of time. For diffusion analysis, the following parameters were used: lag time = 10.3 msec, λ ex = 647 nm, λ em = 670 nm, pixel size = 160 nm, numerical aperture = 1.49, expected D max = 10 µm 2 /sec, track length = more than two frames, deflation loops = none, localization error = 10 −6 , maximum competitors = one, and blinking = two frames. For survival probability ( Fig. 4 C), the following parameters were used: lag time = 500 msec, λ ex = 647 nm, λ em = 670 nm, pixel size = 160 nm, numerical aperture = 1.49, expected D max = 0.1 µm 2 /sec, track length = more than three frames, deflation loops = none, localization error = 10 −6 , maximum competitors = one, and blinking = two frames. FRAP imaging 3xFlag-HaloTag-EZH2 U2OS cells (5 × 10 5 ) were plated in prepared imaging dishes (detailed above) in a total of 2 mL of complete medium ∼17 h before imaging. Cells were then labeled with 500 nM JF646 for 5 min and diluted in 37°C complete medium. The labeling medium was removed, and cell washes were performed as detailed above. FRAP imaging was performed on a Nikon A1R scanning confocal microscope equipped with a quad emission filter, a 100× oil immersion objective, a 638-nm laser line, and an environmental chamber to control temperature, humidity, and CO 2 levels. Nikon software was set to Nyquist acquisition with the following settings: pinhole size = 4.2 AU, fast mode pixel dwell time = 2.2 µsec, 638-nm laser power for acquisition = 2.0% AOTF, and 638-nm laser power for stimulation/bleach = 75% AOTF. Regions of interest (ROIs) with identical areas were drawn around the EZH2-enriched lacO array and around two other nuclear sites (one was photobleached and the other was a reference ROI). The cells were then imaged for 30 sec before photobleaching, photobleached within the ROIs for 2 sec, and then imaged for 5 min after photobleaching to monitor recovery. The frame rate for all acquisitions was 0.5 fps except during stimulation, where the laser was illuminated for a continuous 2 sec. Mean intensity ( t ) data within each ROI were used for quantification of fluorescence recovery. Quantifying recovery after photobleaching All quantification of fluorescence recovery was done in Matlab. The background fluorescence (signal outside of the nucleus) was first subtracted from the intensity ( t ) within each ROI inside the nucleus. The normalized fluorescence recovery within either the nuclear nonspecific ROI or the lacO ROI was fit to y ( t ) = A (1 − e − Bt ). We found that total fluorescent EZH2 was depleted after photobleaching the lacO array and nuclear site. A reference ROI within the same nucleus was used to calculate the fraction of fluorescent EZH2 remaining at the end of imaging (dotted line Fig. 3 B) to account for both stimulation- and acquisition-induced photobleaching ( C = [EZH2 fluorescence] end of imaging /[EZH2 fluorescence] before photobleach ). The corrected immobile fraction = C − A . The recovery constant was reported as the value B of the fit curve. Immunofluorescence and DNA-FISH imaging Cells (1.5 × 10 5 ) were plated in wells of a 24-well glass imaging dish (Cellvis, P24-1.5H-N) for ∼17 h before performing immunofluorescence. Cells were labeled for 5 min with 500 nM JF549 ( Grimm et al. 2015 ) and then fixed in 1× PBS supplemented with 3.7% formaldehyde (Thermo Fisher, BP531500 ) for 10 min at room temperature. Fixing solution was removed, and the cells were washed twice with PBS and permeabilized in 1× PBS containing 0.1% Triton X-100 for 5 min at room temperature. Cells were then dehydrated using 70% ethanol for 5 min at 4°C followed by 95% ethanol for 5 min at 4°C and then 100% ethanol for 5 min at 4°C. The ethanol was then removed entirely, and the cells were air-dried. Hybridization buffer (70% formamide, 12 mM Tris at pH 8.0, 5 mM KCl, 1 mM MgCl 2 , 0.001% Triton X-100, 0.1 µg/mL salmon DNA) with 200 nM lacO PNA FISH probe (Alexa647-O-AATTGTTATCCGCTCAC) was heated to 78°C, and 400 µL was added to each well of the 24-well plate. The wells were then heated for 5 min to 78°C in the dark and then placed in a dark humidified chamber for 2 h at room temperature. The hybridization buffer was removed, and the cells were rinsed once with 70% formamide/2× saline sodium citrate (SSC) buffer, washed twice with 70% formamide/2× SSC buffer for 15 min each, and washed three times with 1× PBS for 5 min each. The final wash was then replaced with 1× PBS containing 1 µg/mL Hoechst dye and 0.02% NaN 3 . All fixed-cell imaging was performed on a DeltaVision Core microscope (Applied Precision). Twelve Z -sections were collected in 0.2-µm increments. A maximum intensity projection was used for presentation and quantification of colocalization.
Competing interest statement
T.R.C. is on the board of directors of Merck and Co. and is a scientific advisor for Storm Therapeutics.
📊 Figures
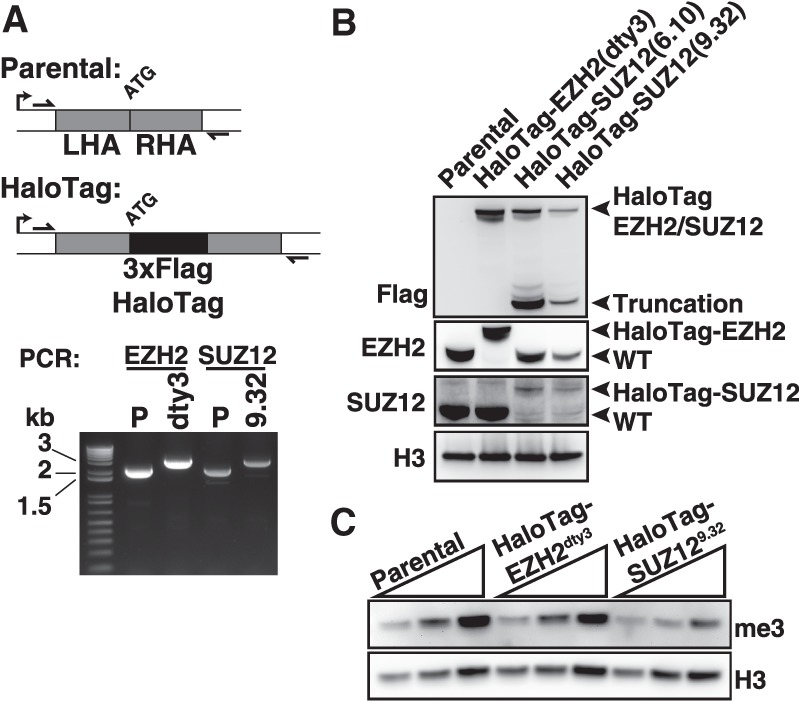
Figure 1.
HaloTagging the N termini of EZH2 and SUZ12 by genome editing: HaloTag-EZH2 maintains endogenous protein levels and intracellular PRC2 activity. ( A , top ) Diagram of the EZH2 or SUZ12 locus before a...
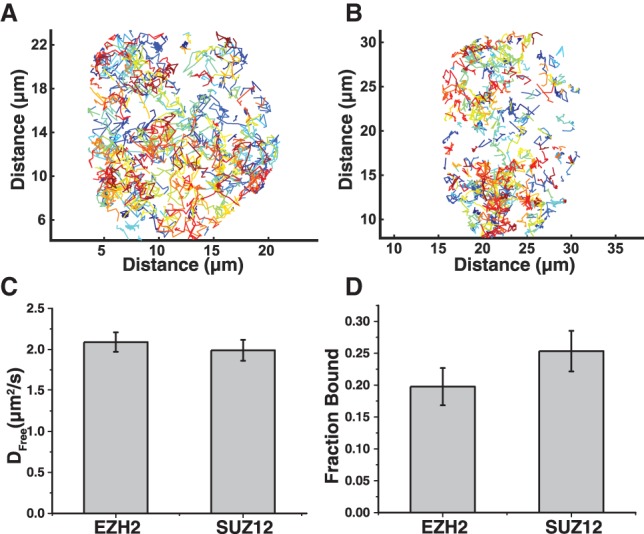
Figure 2.
Live-cell single-molecule imaging of EZH2 and SUZ12 reveals that the majority of PRC2 is rapidly diffusing. ( A , B ) Single-particle trajectories of 3xFlag-HaloTag-EZH2 ( A ) and 3xFlag-HaloTag-SUZ12...
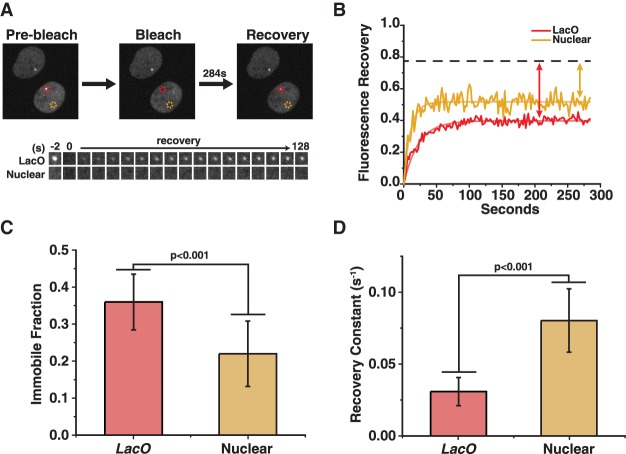
Figure 3.
EZH2 has a greater immobile fraction and recovers more slowly after photobleaching at a H3K27me3-enriched locus compared with other nuclear sites. ( A , top ) Three time points from a FRAP experiment ...
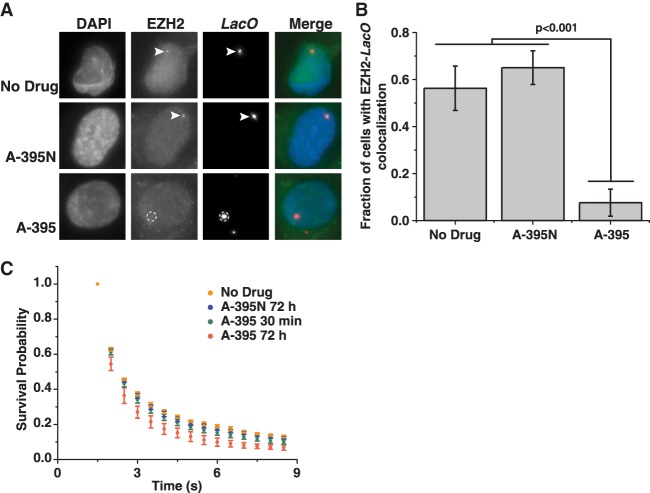
Figure 4.
Depleting H3K27me3 with A-395 destabilizes the association of PRC2 with chromatin. ( A ) Fixed-cell imaging of HaloTag-EZH2 cells that were untreated, treated with A-395N (an inactive variant of A-395...
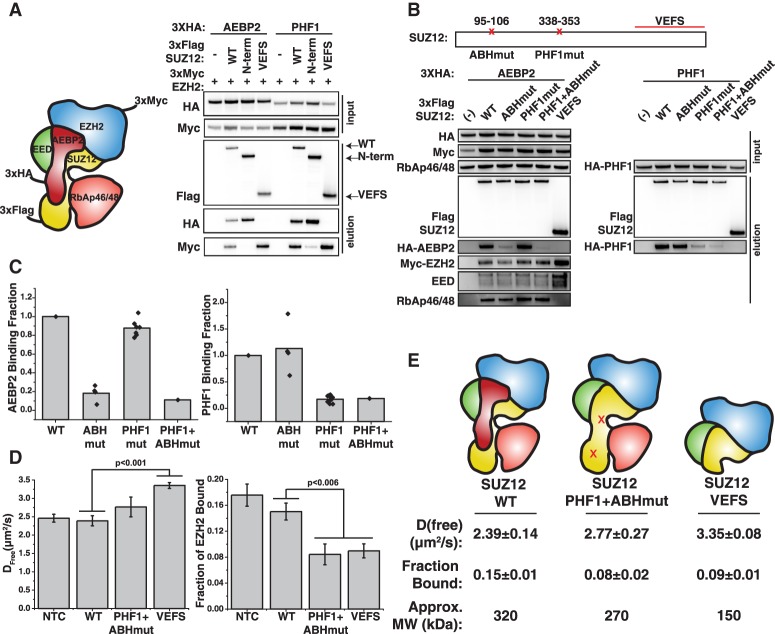
Figure 5.
The interaction between the PRC2 core and accessory proteins is required for efficient recruitment of PRC2 to chromatin. ( A , left ) Diagram of PRC2 subunits based on the negative stain electron micr...
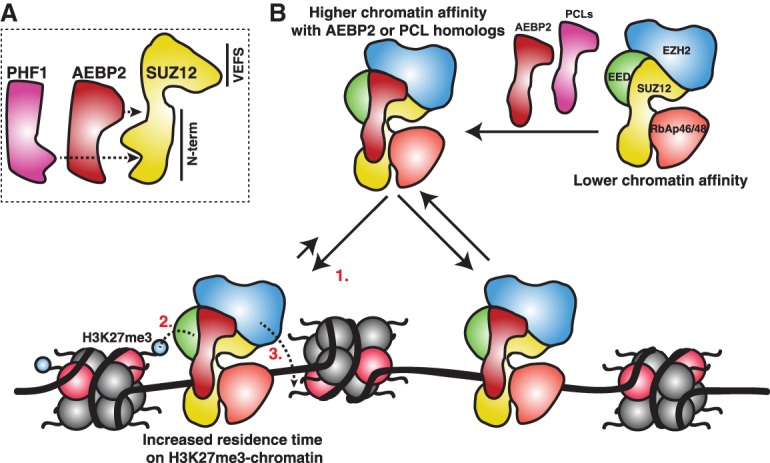
Figure 6.
Model for human PRC2 recruitment to chromatin. ( A ) AEBP2 and PHF1 interact with the N terminus of SUZ12 at nonidentical sites, but their binding is mutually exclusive. ( B ) PRC2 interacts with inte...
Figure images are served from the NIH/NLM PubMed Central Open Access Subset or Europe PMC; copyright remains with the publishers and authors.
💬 Discussion
0 commentsNo comments yet. Be the first to start a discussion!
Leave a Comment