Abstract
Molecular analysis on the single-cell level represents a rapidly growing field in the life sciences. While bulk analysis from a pool of cells provides a general molecular profile, it is blind to heterogeneities between individual cells. This heterogeneity, however, is an inherent property of every cell population. Its analysis is fundamental to understanding the development, function, and role of specific cells of the same genotype that display different phenotypical properties. Single-cell mass spectrometry (MS) aims to provide broad molecular information for a significantly large number of cells to help decipher cellular heterogeneity using statistical analysis. Here, we present a sensitive approach to single-cell MS based on high-resolution MALDI-2-MS imaging in combination with MALDI-compatible staining and use of optical microscopy. Our approach allowed analyzing large amounts of unperturbed cells directly from the growth chamber. Confident coregistration of both modalities enabled a reliable compilation of single-cell mass spectra and a straightforward inclusion of optical as well as mass spectrometric features in the interpretation of data. The resulting multimodal datasets permit the use of various statistical methods like machine learning-driven classification and multivariate analysis based on molecular profile and establish a direct connection of MS data with microscopy information of individual cells. Displaying data in the form of histograms for individual signal intensities helps to investigate heterogeneous expression of specific lipids within the cell culture and to identify subpopulations intuitively. Ultimately, t-MALDI-2-MSI measurements at 2-µm pixel sizes deliver a glimpse of intracellular lipid distributions and reveal molecular profiles for subcellular domains.
🔬 Techniques
✨ Fluorophores
🧪 Sample Preparation
🔬 Cell Lines
🏭 Microscope Brands
🧪 Reagent Suppliers
💻 Software Details
🏛️ Research Organizations (ROR)
Affiliated research institutions:
📋 Methods
Chemicals. All chemicals and organic solvents were from Merck (Sigma-Aldrich) unless otherwise noted. Cell Culture. Cells were cultivated and cultures were prepared for the subsequent microscopic and MALDI-MSI analyses as described before ( 44 ). Modifications in terms of a staining step have been added to the standard protocol. For a detailed description, please refer to SI Appendix . For cocultivation experiments, Caki-2 and Vero-B4 cells were grown as mono- as well as cocultures in different chambers of the same slide. Two biological replicates were generated with one containing Caki-2 cells stained with a live-cell dye (CellTracker Deep Red, Fisher Chemical, 5 µM, 45 min) prior to cocultivation to enable the assignment of the correct cell type in the coculture experiment. THP-1 cells were differentiated to macrophages by stimulation of the monocytes with 200 ng/mL PMA for 24, 48, and 72 h. Microscopy. Bright-field and fluorescent microscopic images were acquired with a digital slide scanner (SLIDEVIEW VS200, Olympus). For details, please refer to SI Appendix . MALDI-2-MSI. The mass spectrometer and respective methods for the analysis of single cells employed for t-MALDI-2-MSI at a 2-µm pixel size have been described in detail previously ( 39 , 44 ). The mass spectrometer used for top illumination was a timsTOF fleX with MALDI-2 (Bruker Daltonics) described elsewhere ( 42 ). For a more detailed description, please refer to SI Appendix . Data Processing. For both Orbitrap and timsTOF measurements, SCiLS Lab MVS software (v. 2021a Pro, SCiLS Lab/Bruker Daltonics) was used to generate ion images with a reduced-mass list of the most prominent peaks in the csv or imzML format ( 59 ) for further processing in Python. For a more detailed description, please refer to SI Appendix . Single-Cell Segmentation. For single-cell segmentation, local maxima in the fluorescence microscopy DAPI channel were declared as cell seeds and a watershed algorithm (skimage 0.14.0) attributed each pixel to either a certain seed or background based on the fluorescence microscopy fluorescein isothiocyanate (FITC) channel. For a more detailed description, please refer to SI Appendix .
Show full methods section
Chemicals. All chemicals and organic solvents were from Merck (Sigma-Aldrich) unless otherwise noted. Cell Culture. Cells were cultivated and cultures were prepared for the subsequent microscopic and MALDI-MSI analyses as described before ( 44 ). Modifications in terms of a staining step have been added to the standard protocol. For a detailed description, please refer to SI Appendix . For cocultivation experiments, Caki-2 and Vero-B4 cells were grown as mono- as well as cocultures in different chambers of the same slide. Two biological replicates were generated with one containing Caki-2 cells stained with a live-cell dye (CellTracker Deep Red, Fisher Chemical, 5 µM, 45 min) prior to cocultivation to enable the assignment of the correct cell type in the coculture experiment. THP-1 cells were differentiated to macrophages by stimulation of the monocytes with 200 ng/mL PMA for 24, 48, and 72 h. Microscopy. Bright-field and fluorescent microscopic images were acquired with a digital slide scanner (SLIDEVIEW VS200, Olympus). For details, please refer to SI Appendix . MALDI-2-MSI. The mass spectrometer and respective methods for the analysis of single cells employed for t-MALDI-2-MSI at a 2-µm pixel size have been described in detail previously ( 39 , 44 ). The mass spectrometer used for top illumination was a timsTOF fleX with MALDI-2 (Bruker Daltonics) described elsewhere ( 42 ). For a more detailed description, please refer to SI Appendix . Data Processing. For both Orbitrap and timsTOF measurements, SCiLS Lab MVS software (v. 2021a Pro, SCiLS Lab/Bruker Daltonics) was used to generate ion images with a reduced-mass list of the most prominent peaks in the csv or imzML format ( 59 ) for further processing in Python. For a more detailed description, please refer to SI Appendix . Single-Cell Segmentation. For single-cell segmentation, local maxima in the fluorescence microscopy DAPI channel were declared as cell seeds and a watershed algorithm (skimage 0.14.0) attributed each pixel to either a certain seed or background based on the fluorescence microscopy fluorescein isothiocyanate (FITC) channel. For a more detailed description, please refer to SI Appendix .
Coregistration of MALDI-MSI and Microscopy
Data and Compilation of Single-Cell Mass Spectra. For the coregistration, a correlation of binarized MALDI and binarized microscopy images was used. The MALDI-MSI data were imported to Python with pyimzML 1.3.0 or directly via csv files ( 60 ) and binarized using a threshold signal intensity of an m/z value that is omnipresent in the cells but absent in the background. The binarized MALDI images were then resized to an artificial pixel size of 1 µm (e.g., a pixel with 2 × 2 µm would be transformed into four 1 × 1 µm pixels with the same values). Likewise, the microscopy images were binarized to cell area and background based on the FITC channel, and resized to a pixel size of 1 µm as well. Pixels in both binarized images were set to a value of 1 for MALDI signal/cell area and −1 for background. The binary MALDI images were used as the kernel for a two-dimensional correlation (1-µm step size) with the binary microscopy images (using scipy.signal.correlate2d). MALDI signal pixels matching cell-area pixels contributed positively as well as background pixels matching background pixels. Conversely, matches of MALDI signal pixels with background pixels and cell-area pixels with background pixels contributed negatively to the correlation value. The position with the maximum correlation was used for a preliminary coregistration. Around this position, all combinations of a set of rotations (0.1° step size between −2.5 and 2.5°) and positions (1-µm step size in a 50 × 50 µm rectangle) were tested in a brute-force approach and the combination of rotation and position for which the correlation of binarized MALDI and microscopy images was maximal was used for coregistration. After the coregistration, the original MALDI images (original pixel size and nonbinarized) were used to retrieve the MALDI-based MS information for each individual cell. MALDI pixels that touched two cells were discarded. Pixels that contained only one cell but also background were treated as if the measured intensities stemmed just from the cell. Finally, all pixels overlapping with a single cell were summed up to retrieve a MALDI spectrum for that specific individual cell.
Cell Classification Ground Truth
Based on Live-Cell Dye. Selective live-cell staining of Caki-2 cells allowed the collection of a ground truth for the cocultivated cell cultures based on the average fluorescence intensity per area of each cell in the fluorescence microscopy Cy5 channel. For a more detailed description, please refer to SI Appendix . Statistical Analysis and SVM Classification. Single-cell mass spectra were normalized to the TIC. Monocultivated cells were used as labeled training data and randomly partitioned into five equal-sized subsamples for fivefold cross-validation. The Python package scikit-learn 0.21.3 was used to create a pipeline of mean centering, scaling to unit variance and a linear SVM with balanced class weightings. After confirming precise classification accuracies, the pipeline was retrained on all monocultivated cells and then used to classify the cocultivated cells. For a description of other statistical tools, please refer to SI Appendix .
📊 Figures
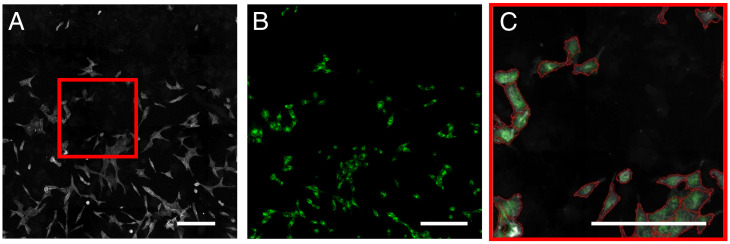
Fig. 1.
( A and B ) Vero-B4 cell culture visualized in ( A ) a fluorescence microscopy image using WGA stain and ( B ) the corresponding ion signal intensity distribution of [DAG(34:1)u2212H 2 O+H] + register...
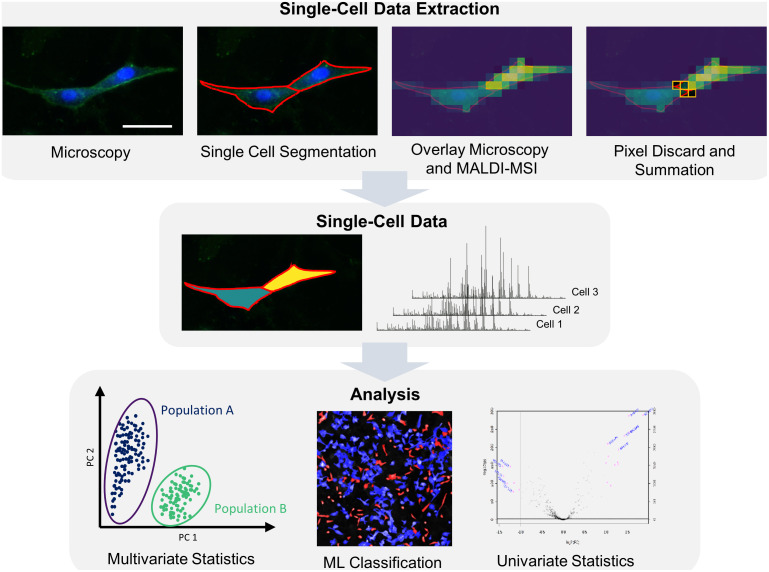
Fig. 2.
Illustration of the workflow for single-cell analysis by the combination of microscopy and high-resolution MALDI-MSI. Segmentation of the microscopy data are followed by a pixelwise coregistration wit...
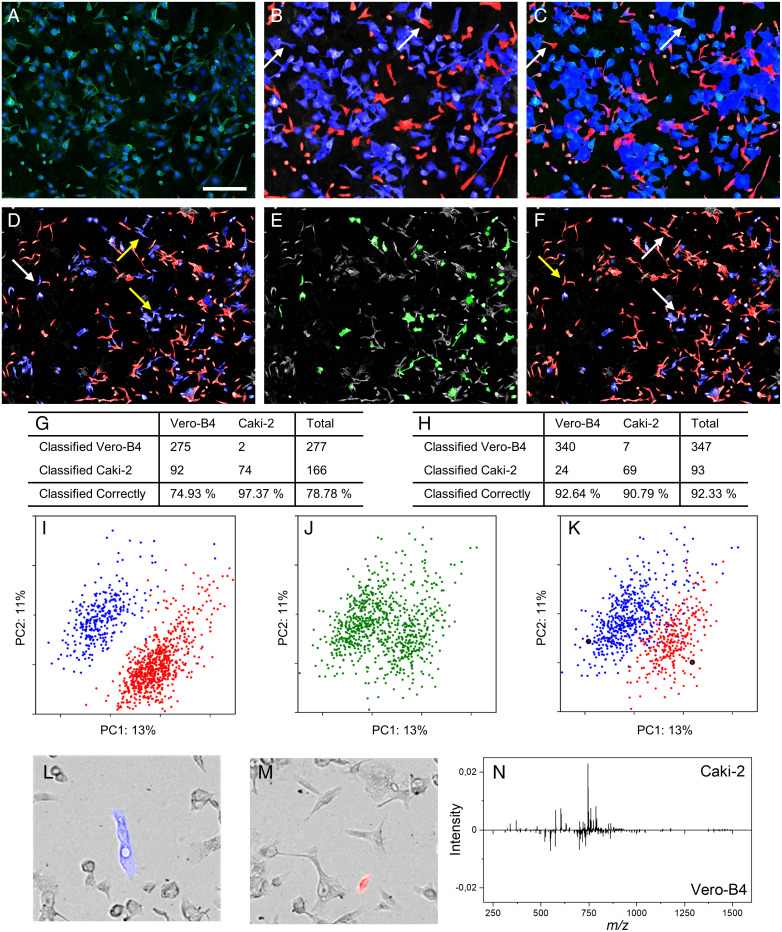
Fig. 3.
Classification results for cocultured Vero-B4 and Caki-2 cells. ( A ) Microscopy overlay of the WGA and DAPI channels. ( B ) Classification results for the cocultured system using an SVM based on sing...
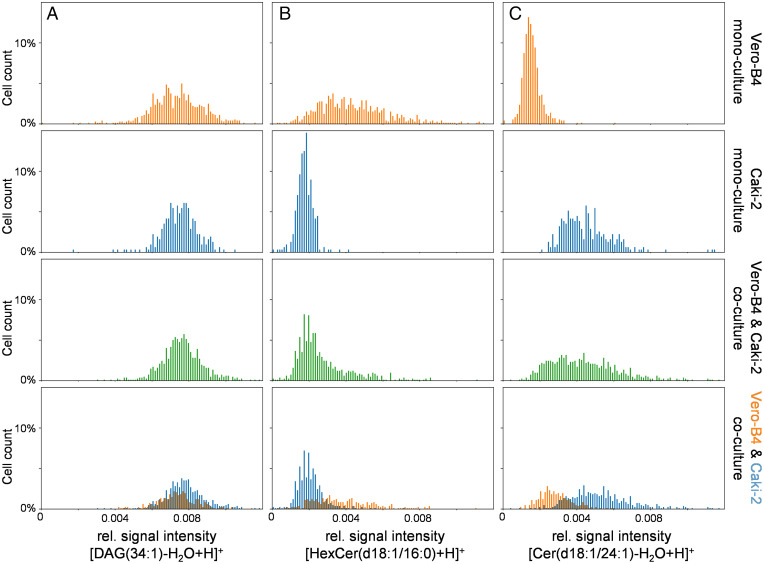
Fig. 4.
Histograms of selected ion signal intensities for mono- and cocultured Vero-B4 and Caki-2 cells. ( A ) Histograms for [DAG(34:1)u2212H 2 O+H] + found with a homogeneous distribution in both cell types...
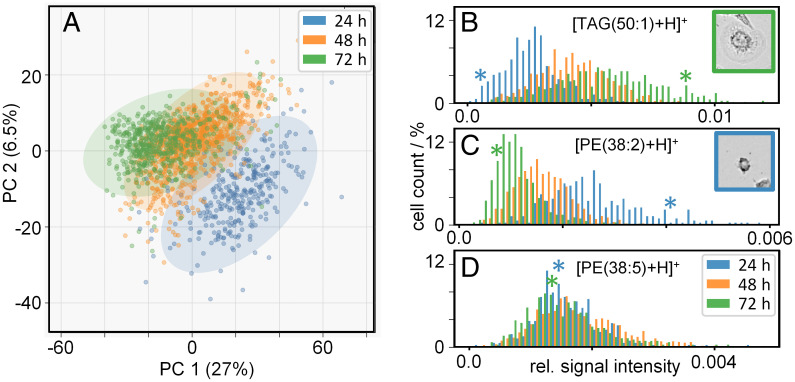
Fig. 5.
( A ) PCA based on single-cell mass spectra of THP-1 cells for three time points during differentiation from monocytes to M0 macrophages. ( B u2013 D ) Histograms of selected ion signal intensities. C...
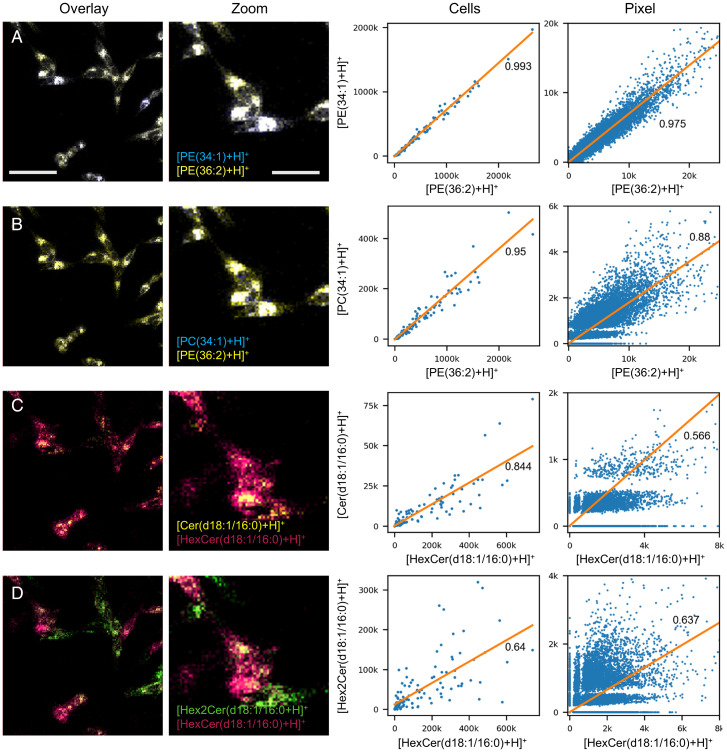
Fig. 6.
Visualization of inter- and intracellular heterogeneity for Vero-B4 cells of selected ions. ( Left ) t-MALDI-2-MS images of the respective m/z values at a pixel size of 2 u00b5m and a zoom-in of indiv...
Figure images are served from the NIH/NLM PubMed Central Open Access Subset or Europe PMC; copyright remains with the publishers and authors.
💬 Discussion
0 commentsNo comments yet. Be the first to start a discussion!
Leave a Comment