Abstract
SummaryBread wheat (Triticum aestivum L.) is cultivated on more land than any other crop and produces a fifth of the calories consumed by humans. Wheat endosperm is rich in starch yet contains low concentrations of dietary iron (Fe) and zinc (Zn). Biofortification is a micronutrient intervention aimed at increasing the density and bioavailability of essential vitamins and minerals in staple crops; Fe biofortification of wheat has proved challenging. In this study we employed constitutive expression (CE) of the rice (Oryza sativa L.) nicotianamine synthase 2 (OsNAS2) gene in bread wheat to up‐regulate biosynthesis of two low molecular weight metal chelators – nicotianamine (NA) and 2′‐deoxymugineic acid (DMA) – that play key roles in metal transport and nutrition. The CE‐OsNAS2 plants accumulated higher concentrations of grain Fe, Zn, NA and DMA and synchrotron X‐ray fluorescence microscopy (XFM) revealed enhanced localization of Fe and Zn in endosperm and crease tissues, respectively. Iron bioavailability was increased in white flour milled from field‐grown CE‐OsNAS2 grain and positively correlated with NA and DMA concentrations.
🔬 Techniques
🧬 Organisms
✨ Fluorophores
🧪 Sample Preparation
🏭 Microscope Brands
🧪 Reagent Suppliers
🏛️ Research Organizations (ROR)
Affiliated research institutions:
📋 Methods
Vector construction and generation of wheat transformation events The full‐length coding sequence of OsNAS2 (LOC_Os03g19420) was PCR amplified from rice ( Oryza sativa L.) cv. Nipponbare genomic DNA (Johnson et al ., 2011 ). Recombination into a modified pMDC32 vector (Curtis and Grossniklaus, 2003 ) with the hygromycin phosphotransferase plant‐selectable marker gene placed OsNAS2 under transcriptional control of the maize ( Zea mays L.) ubiquitin 1 promoter. Particle bombardment of the construct into immature wheat ( Triticum aestivum L.) cv. Bobwhite embryos (1.0–1.5 mm in length) was performed at the University of Adelaide (Adelaide, Australia) using established protocols (Kovalchuk et al ., 2009 ). Plants were grown in glasshouse conditions (12 h photoperiod, 23 °C day/12 °C night, 50% humidity) in soil (coconut peat and sand mixture) with complete fertilizers. Insert copy number analysis Genomic DNA (10 μg) was isolated from CE‐ OsNAS2 leaf tissue and digested with Dra I and Hind III restriction enzymes. Restriction fragments were separated by gel electrophoresis (0.8% agarose) alongside a positive barley control and blotted to a nylon membrane. Two independent hybridizations of a 32 P‐labelled probe to both nopaline synthase terminator and dual 35S promoter were performed using established protocols (Pallotta et al ., 2014 ).
Automated phenotyping
Grain were sown in white plastic pots (14 × 19 cm) containing 2.5 kg of soil mixture (equal parts clay‐loam soil and coconut peat) and Osmocote ® fertilizer. Plants were maintained under glasshouse conditions (12 h photoperiod, 24 °C day/18 °C night, 50%–90% humidity) in the phenotyping platform of The Plant Accelerator (Adelaide, Australia). Projected shoot area and plant height were measured 100 days after sowing using the conveyer automated imaging system (Berger et al ., 2012 ). Grain number and TGW were manually determined at harvest. Inductively coupled plasma optical emission spectrometry (ICP‐OES) Plant tissues were submerged in 0.1% Tween 20 solution, rinsed with dH 2 O and oven dried for 48 h at 60°C before grinding to a powder using an IKA tube mill ( www.ika.com ).
Show full methods section
Vector construction and generation of wheat transformation events The full‐length coding sequence of OsNAS2 (LOC_Os03g19420) was PCR amplified from rice ( Oryza sativa L.) cv. Nipponbare genomic DNA (Johnson et al ., 2011 ). Recombination into a modified pMDC32 vector (Curtis and Grossniklaus, 2003 ) with the hygromycin phosphotransferase plant‐selectable marker gene placed OsNAS2 under transcriptional control of the maize ( Zea mays L.) ubiquitin 1 promoter. Particle bombardment of the construct into immature wheat ( Triticum aestivum L.) cv. Bobwhite embryos (1.0–1.5 mm in length) was performed at the University of Adelaide (Adelaide, Australia) using established protocols (Kovalchuk et al ., 2009 ). Plants were grown in glasshouse conditions (12 h photoperiod, 23 °C day/12 °C night, 50% humidity) in soil (coconut peat and sand mixture) with complete fertilizers. Insert copy number analysis Genomic DNA (10 μg) was isolated from CE‐ OsNAS2 leaf tissue and digested with Dra I and Hind III restriction enzymes. Restriction fragments were separated by gel electrophoresis (0.8% agarose) alongside a positive barley control and blotted to a nylon membrane. Two independent hybridizations of a 32 P‐labelled probe to both nopaline synthase terminator and dual 35S promoter were performed using established protocols (Pallotta et al ., 2014 ).
Automated phenotyping
Grain were sown in white plastic pots (14 × 19 cm) containing 2.5 kg of soil mixture (equal parts clay‐loam soil and coconut peat) and Osmocote ® fertilizer. Plants were maintained under glasshouse conditions (12 h photoperiod, 24 °C day/18 °C night, 50%–90% humidity) in the phenotyping platform of The Plant Accelerator (Adelaide, Australia). Projected shoot area and plant height were measured 100 days after sowing using the conveyer automated imaging system (Berger et al ., 2012 ). Grain number and TGW were manually determined at harvest. Inductively coupled plasma optical emission spectrometry (ICP‐OES) Plant tissues were submerged in 0.1% Tween 20 solution, rinsed with dH 2 O and oven dried for 48 h at 60°C before grinding to a powder using an IKA tube mill ( www.ika.com ).
Inductively coupled plasma optical emission spectrometry
(ICP‐OES) analysis was conducted at Waite Analytical Services (Adelaide, SA, Australia), the Robert W. Holley Centre for Agriculture and Health (USDA‐ARS, Ithaca, NY) and the CSBP Soil and Plant Analysis Laboratory (Perth, WA, Australia).
Quantitative reverse transcription
PCR (qRT‐PCR) Shoot and root tissues (without the crown) of 4‐week‐old plants were separated, cleaned with dH 2 O and snap frozen. Three plants of each genotype (representing one biological replicate) were combined and total RNA was extracted from pulverized frozen plant tissue (100–150 mg) using TRIzol Reagent (Life Technologies, Carlsbad, CA) and a commercial kit (Direct‐zol™; ZymoResearch, Irvine, CA). Genomic DNA was removed from RNA (2 μg) using a DNAse I treatment (Promega, Madison, WI) and reverse transcription was performed using a commercial kit (Bioline). Consensus primers were designed to amplify homeologous groups of TaNAS , TaNAAT and TaDMAS gene families using Primer3 ( http://bioinfo.ut.ee/primer3-0.4.0 ) software. Each biological replicate was analyzed in triplicate and transcripts were quantified against four replicates of 10‐fold serial dilutions (10 2 –10 8 ) for each purified PCR template (DNA Clean & Concentrator™‐5; ZymoResearch). Expression levels of OsNAS2 , TaNAS , TaNAAT and TaDMAS were measured in root and shoot tissues using qRT‐PCR analysis (CFX384‐ BioRad). The geometric mean expression of three housekeeping genes: TaCyclophilin , TaGAPDH and TaELF and TaGAPDH , TaActin and TaELF , was used to normalize OsNAS2 , TaNAS , TaNAAT and TaDMAS gene expression within shoot and root tissues, respectively (Schreiber et al ., 2009 ; Vandesompele et al ., 2002 ). All primers had annealing temperatures between 61–65 °C and primer sequences and efficiencies are provided (Table S4 ).
Quantification of NA and DMA
Quantification of 6‐aminoquinolyl‐N‐hydroxysuccinimidyl carbamate
(AQC) derivatized NA in whole grain was performed via liquid chromatography‐mass spectrometry (LC‐MS) using established protocols (Callahan et al ., 2007 ; Johnson et al ., 2011 ).
Quantification of 9‐fluorenylmethoxycarboxyl chloride
(FMOC‐Cl) derivatized NA and DMA in whole grain (Figure 5 d,e) and white flour (Figure 6 d,e) was performed via RP LC‐MS on an 1290 Infinity II and 6490 Triple Quadrupole LC/MS system (Agilent Technologies Inc., Santa Clara, CA) using established protocols (Selby‐Pham et al ., 2017 ). Briefly, sequential methanol (100%) and deionized H 2 O (18MΩ) extractions of pulverized wheat grain or white flour (25 mg) were combined and added (5 μL) to sodium borate buffer (pH = 8, 1 m , 10 μL), EDTA buffer (pH = 8, 50 m m , 10 μL) and fresh FMOC‐Cl solutions (50 m m , 40 μL). After incubation (60 °C, 700 rpm, 15 min), the derivatization reaction was quenched via the addition of formic acid (FA; pH = 4, 5%, 8.9 μL). A Zorbax Eclipse XDB‐C18 Rapid Resolution HS 2.1x100 mm, 1.8 μm particle size column (Agilent Technologies Inc.) was used during chromatography with aqueous (0.1% v/v FA in dH 2 O) and organic (0.1% v/v FA in acetonitrile) mobile phases. For quantification, a stock aqueous solution of NA and DMA (Toronto Research Chemicals, Toronto, ON, Canada) was prepared at 750 μ m and a calibration set was generated in the range of 0.005 to 75 μ m .
Analysis of Fe and Zn accumulation post anthesis
Plants were grown in glasshouse conditions (12 h photoperiod, 18 °C day/13 °C night, 40%–80% humidity) in Hortico ® potting mix with Osmocote ® fertilizer at The University of Melbourne (Victoria, Australia). The main stem flag leaf, rachis, bracts and grain were harvested at 5–8 DAA (days after anthesis), 12–15 DAA, 19–21 DAA, 26–29 DAA and maturity. Samples were washed, oven dried for 48 h at 60°C and ground to a powder before analysis by inductively coupled plasma mass spectrometry (ICP‐MS) at the Environmental Analysis Laboratory (Lismore, NSW, Australia). Synchrotron X‐ray fluorescence microscopy (XFM) Elemental X‐ray fluorescence (XRF) maps of Fe, Zn, Cu and Mn in transverse cross‐sections of two representative CE‐1 and NS grain (four sets of maps total) were collected at the XFM beamline at the Australian Synchrotron (Melbourne, Australia) as previously described (Van Malderen et al ., 2017 ). Briefly, the beam energy was set at 15.6 keV and the beam focused to approximately 2 × μm 2 using Kirkpatrick‐Baez mirrors. Samples were analyzed continuously in the horizontal direction with a sampling interval of 4 μm and a step size of 4 μm in the vertical direction (pixel transit time was set at 5.2 ms). The XRF signal from the 80 μm transverse grain sections was collected using a 384‐element Maia detector system. Tri‐colour elemental maps showing the distribution of Fe, Zn and P near the grain edge of one representative CE‐1 and NS grain (two sets of maps total; different grain from those used with the Maia detector) were collected using a separate Vortex‐EM detector. The tri‐colour maps were used as guides to select rectangular areas of approximately 14 × 140 μm near the grain edge for the generation of Fe, Zn, P and S line scans. Elemental maps were generated using GeoPIXE ( http://nmp.csiro.au/GeoPIXE.html ) software. The NS grain contained 38 μg/g DW Fe, 71 μg/g DW Zn, 4700 μg/g DW P and 1630 μg/g DW S while CE‐1 grain contained 69 μg/g DW Fe, 122 μg/g DW Zn, 5300 μg/g DW P and 2100 μg/g DW S (Table S5 ). Confined field trials Confined field trials were conducted in Western Australia from June to December 2015 at the New Genes for New Environment facilities located in Merredin (31.4837° S, 118.2771° E) and Katanning (33.6894° S, 117.5551° E). Grain were sown in 2 m 2 plots with three replicate plots per genotype and arranged in a randomized block design at each site. Rows were spaced at 30 cm and grain were sown at a rate of 60 kg/ha. At maturity, average plant height was determined from three representative measurements per plot and spike number, total biomass and TGW were determined from 0.15 m 2 subsamples per plot (Table S3 ). Grain yield was calculated from the amount of grain harvested per 2 m 2 plot and extrapolated to kg/ha. Soil properties of both field sites are provided in Table S6 . Production of white flour Whole grain samples harvested at Merredin and Katanning were conditioned to 13% moisture content for 24 h prior to milling. Each sample was milled using a Quadrumat Junior laboratory mill (Brabender, Duisburg, Germany) at constant temperature and run through a 280 μm sieve to isolate the white flour fraction. Average flour extraction for all lines from Merredin and Katanning was 71.5 ± 0.2%. Caco‐2 cell culture assessment of Fe bioavailability Whole grain and white flour samples were digested for Caco‐2 cell Fe‐bioavailability analysis as previously described (Glahn et al ., 1998 ; Trijatmiko et al ., 2016 ). The Caco‐2 cells were maintained in supplemented Dulbecco's modified Eagle medium (DMEM) for 11 days post‐seeding and replaced with supplemented minimum essential media (MEM) solution 48 h prior to the experiment. On the experiment day, gastric‐digested samples (1.5 mL) were added to cylindrical Transwell inserts (Corning Life Sciences, Corning, NY) fitted with a semipermeable (15 000 Da MWCO) basal membrane (Spectra/Por 2.1, Spectrum Medical, Gardena, CA). The inserts were placed within wells containing Caco‐2 cell monolayers and incubated for 2 h (37 °C), after which the inserts were removed and additional MEM (1 mL) added to the cells before incubation for 22 h (37 °C). After incubation, growth medium was removed by aspiration and the Caco‐2 cells were washed twice with a solution (pH = 7.0) containing NaCl (140 mmol/L), KCl (5 mmol/L) and PIPES (10 mmol/L) and harvested with the addition of dH 2 O (1.5 mL) and brief sonication (Lab‐Line Instruments, Melrose Park, IL). In an aliquot of the Caco‐2 cell solution, ferritin content was determined using an immunoradiometric assay (FER‐IRON II Ferritin Assay, Ramco Laboratories, Houston, TX) and total protein content was determined using a colorimetric assay (Bio‐Rad DC Protein Assay, Bio‐Rad, Hercules, CA). As Caco‐2 cells synthesize ferritin in response to intracellular Fe, we used the ratio of ferritin/total protein (expressed as ng ferritin/mg protein) as an index of cellular Fe uptake.
Statistical analysis
All graphs and statistical analyzes were generated using Minitab ® 17 Statistical Software, Minitab, State College, PA and SigmaPlot v13, Systat Software Inc., San Jose. Data are presented as mean ± SEM with biological replicate numbers noted in table and figure legends. Student's t ‐test was used to determine significant differences between means. Data are available upon request to the corresponding author of this paper.
Supporting information Figure S1 Flowchart detailing the analyses performed for each generation of the Ubi:: OsNAS2 lead event (CE‐1) from transformation T 0 to T 6 generation. Figure S2 Relative quantification of DMA biosynthetic gene transcript levels in NS and CE‐1 shoots (left) and roots (right). Figure S3 Concentrations of Fe, Zn, NA and DMA in NS and CE‐1 seedling shoot tissue. Figure S4 Tri‐colour elemental maps of Fe, Zn and Cu in transverse cross‐sections of one representative NS and CE‐1 grain. Figure S5 Elemental maps of Cu and Mn in transverse cross‐sections of two representative NS and CE‐1 grain. Table S1 Iron and zinc concentrations (μg/g DW) in NS and CE‐1 plant tissues at 5–8, 12–15, 19–21 and 26–29 days after anthesis (DAA) as well as maturity. Table S2 Biomass (mg DW) of NS and CE‐1 plant tissues at 5–8, 12–15, 19–21 and 26–29 days after anthesis (DAA) as well as maturity. Table S3 Agronomic performance of NS and CE‐1 sibling lines grown at the Katanning and Merredin field sites. Table S4 Wheat genes and primers used for quantitative reverse transcription PCR (qRT‐PCR) analysis of CE‐1 and NS seedling shoot and root tissue. Table S5 Elemental concentrations (μg/g DW) of T 3 grain harvested from 10 NS and 9 CE‐1 plants including the two batches used for synchrotron XFM analysis (in bold). Table S6 Soil properties of Katanning (K) and Merredin (M) field sites.
📊 Figures
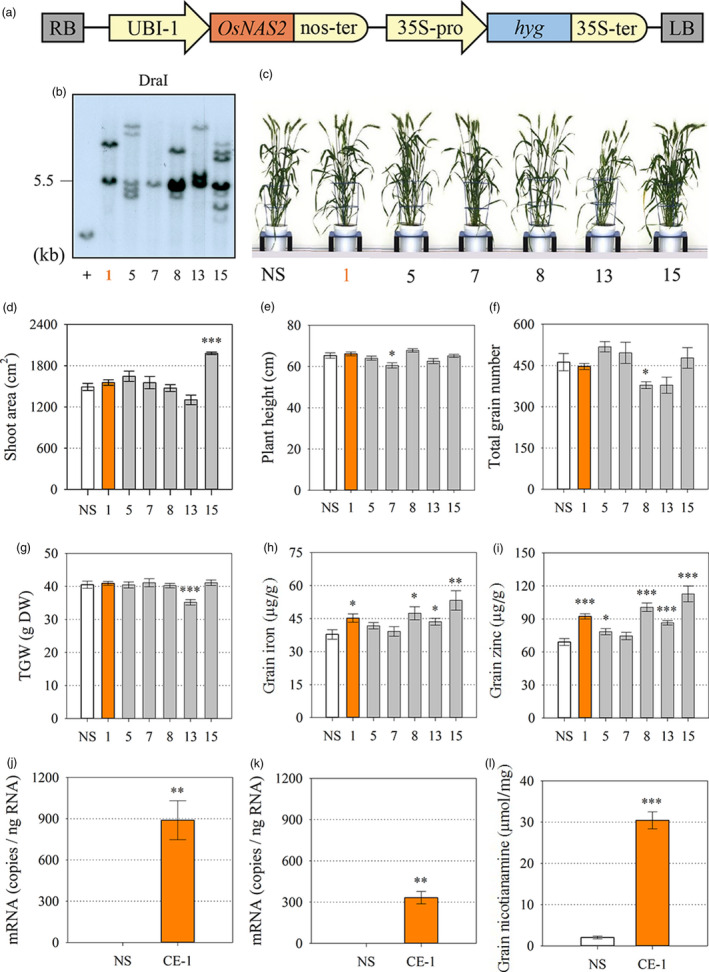
Figure 1
Generation and characterization of independent bread wheat transformation events constitutively expressing the rice nicotianamine synthase 2 ( OsNAS2 ) gene. (a) Schematic representation of the Tu2010...
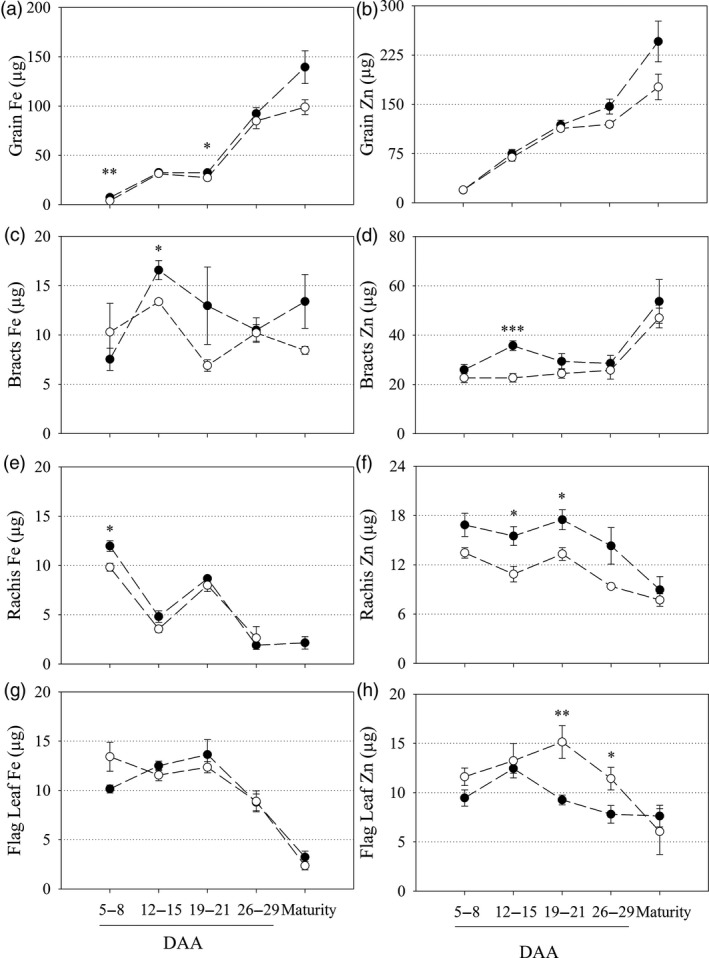
Figure 2
Fe and Zn content in vegetative and grain tissues during grain filling of CEu2010 OsNAS2 and NS wheat lines. Fe and Zn content (u03bcg) in NS (open circles) and CEu20101 (closed circles) plant tissues...
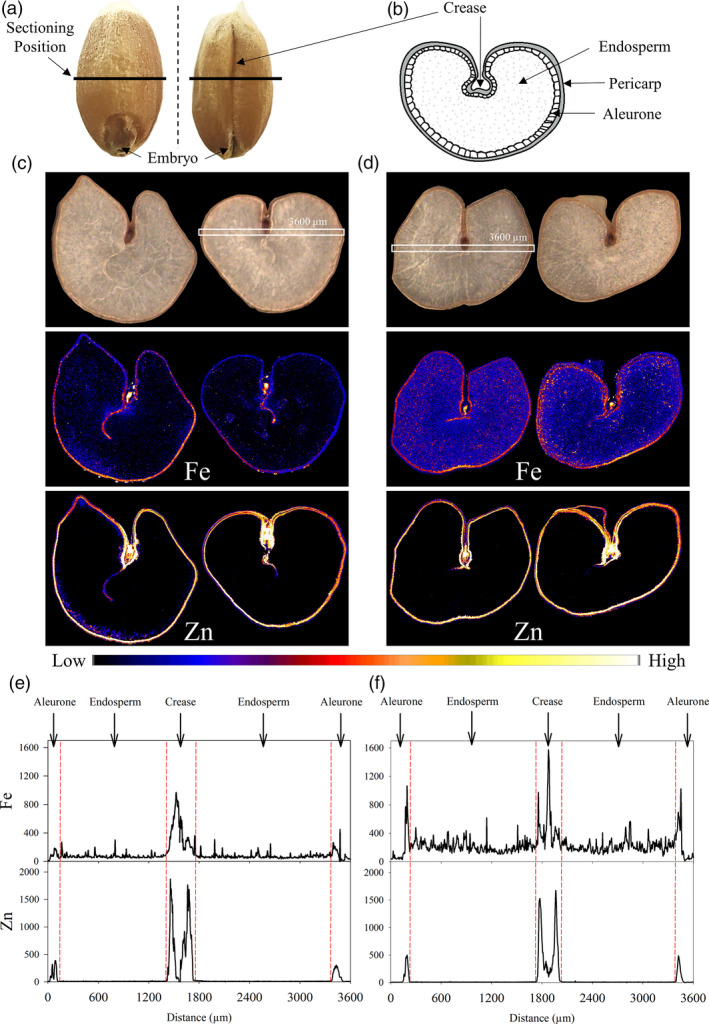
Figure 3
Distribution of Fe and Zn in CEu2010 OsNAS2 and NS wheat grain. (a) Grain position where transverse crossu2010sections were made. (b) Location of major tissue types in transverse section of wheat grai...
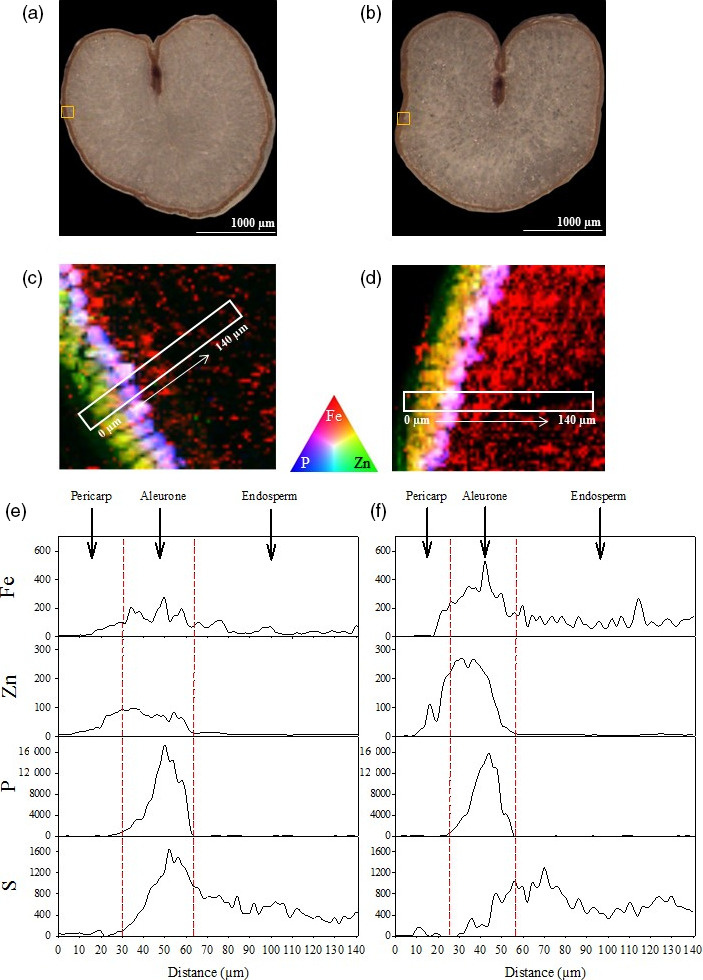
Figure 4
Distribution of Fe, Zn and P in CEu2010 OsNAS2 and NS wheat grain. (a, b) Bright field images of NS and CEu20101 grain sections, respectively. Yellow boxes represent areas used to generate triu2010col...
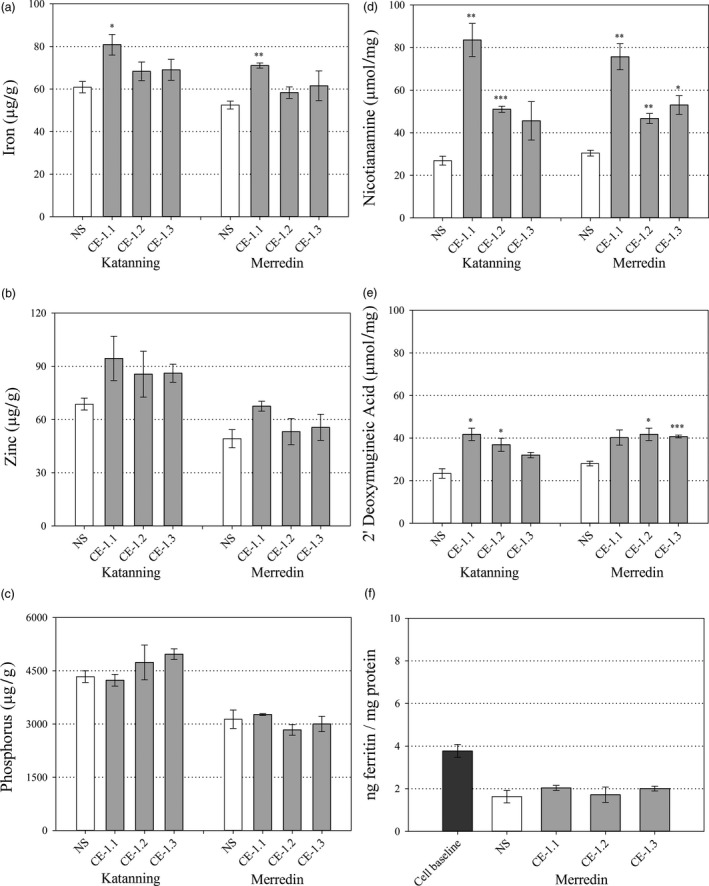
Figure 5
Whole grain nutrition of field grown CEu20101 and NS wheat lines. Nutrient and metabolite concentrations in whole grain samples of NS (white) and three CEu20101 sibling lines (CEu20101.1, 1.2 and 1.3,...
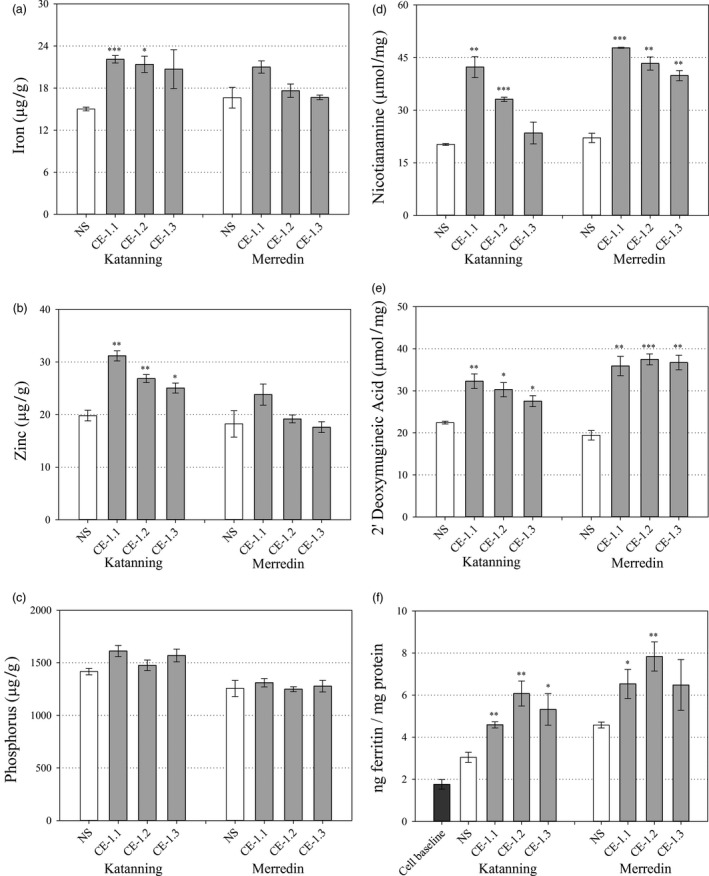
Figure 6
White flour nutrition of field grown CEu20101 and NS wheat lines. Nutrient and metabolite concentrations in white flour samples of NS (white) and three CEu20101 sibling lines (CEu20101.1, 1.2 and 1.3,...
Figure images are served from the NIH/NLM PubMed Central Open Access Subset or Europe PMC; copyright remains with the publishers and authors.
💬 Discussion
0 commentsNo comments yet. Be the first to start a discussion!
Leave a Comment