Abstract
Thioredoxin (Trx) is a redox-active protein that plays a key role in mitigating the effects of oxidative stress. The secretion of Trx on the plasma membrane has been suggested as a distinctive feature of inflammation. However, selective monitoring of membrane-associated Trx activity has proved challenging because of the ubiquity of Trx action in cells. Here, we report a Trx-specific probe that allows visualization of Trx activity associated with the membranes via fluorescence microscopy. The ability of this probe to act as a possible screening tool for agents that modulate Trx secretion was demonstrated in HeLa cells under oxidative stress conditions and in a cellular hepatosteatosis model. Control experiments serve to confirm that the response seen for the present probe is due to Trx and that it is selective over various potentially competing metabolites, including thiol-containing small molecules and test proteins.
🔬 Techniques
🔭 Microscopes
🧪 Sample Preparation
🔬 Cell Lines
🏭 Microscope Brands
🧪 Reagent Suppliers
🏛️ Research Organizations (ROR)
Affiliated research institutions:
📋 Methods
Synthetic and Spectroscopic Methods
A complete listing of the methods used to prepare and characterize all new compounds, including probe 1, is included in the Supporting Information .
Liposome Preparation
Liposomes were prepared by the solvent evaporation method. 20 Briefly, 36 μL of (1,2-dipalmitoyl- sn -glycero-3-phosphocholine) DPPC (0.1 M in chloroform) and 24 μL of cholesterol (0.1 M in chloroform) were added to a 50 mL round-bottom flask containing 940 μL of chloroform and 200 μL of methanol. The aqueous phase (7 mL of HEPES buffer, 10 mM, pH 7.4) was then carefully added along the flask walls. The organic solvents were removed in a rotary evaporator under reduced pressure at 40 °C and 40 rpm. Subsequently, the resulting aqueous solution was subjected to sonication for 30 min. The liposomes were characterized by TEM ( Figure S4 ). To stain the liposomes, a small amount of 1 in DMSO was added with measurements being made after 1 h at 37 °C. The [ 1 ]:[liposome] ratio was around 1:170.
Cell Culture and Imaging
A human cervical cancer cell line (HeLa) and a human hepatoma cell line (HepG2) were cultured in Dulbecco’s Modified Eagle’s Medium (DMEM) and in RPMI 1640, respectively, each supplemented with 10% FBS (WelGene), penicillin (100 units/mL), and streptomycin (100 μg/mL). Two days before imaging, the cells were placed on glass-bottomed dishes (MatTek) which were incubated in a humidified atmosphere containing 5% (v/v) CO 2 at 37 °C. Cell images were obtained using confocal microscopes from Leica (Leica model TCS SP2) and Zeiss (Zeiss model LSM 510). All fluorescence images of probe 1 were obtained using an excitation wavelength of 458 nm and a long path (>505 nm) emission filter. Other information is available in the Figure captions. Treatment of HeLa Cells with Cycloheximide and Dinitrophenol For the tests of Trx secretion from HeLa cells, the cells were plated at the 2 × 10 5 /well level in glass-bottom dishes. After incubation overnight, the cells were treated with DMEM containing 0.5 mM dinitrophenol or 0.1 mM cycloheximide for 3 h at 37 °C. The media were exchanged for PBS containing 1 (5.0 μM) prior to confocal microscopic imaging. Treatment of HpG2 Cells with Fatty Acids HepG2 cells were plated at 2 × 10 5 /well in glass-bottom dishes and incubated for 24 h. The media were changed to one containing 0.7 mM OA or 0.7 mM PA with bovine serum albumin (BSA) for 24 h at 37 °C. The media were then replaced with RPMI (Roswell Park Memorial Institute) medium without FBS for 4 h. Finally, the cells were incubated with PBS containing 1 (5.0 μM) prior to confocal microscopic imaging.
Show full methods section
Synthetic and Spectroscopic Methods
A complete listing of the methods used to prepare and characterize all new compounds, including probe 1, is included in the Supporting Information .
Liposome Preparation
Liposomes were prepared by the solvent evaporation method. 20 Briefly, 36 μL of (1,2-dipalmitoyl- sn -glycero-3-phosphocholine) DPPC (0.1 M in chloroform) and 24 μL of cholesterol (0.1 M in chloroform) were added to a 50 mL round-bottom flask containing 940 μL of chloroform and 200 μL of methanol. The aqueous phase (7 mL of HEPES buffer, 10 mM, pH 7.4) was then carefully added along the flask walls. The organic solvents were removed in a rotary evaporator under reduced pressure at 40 °C and 40 rpm. Subsequently, the resulting aqueous solution was subjected to sonication for 30 min. The liposomes were characterized by TEM ( Figure S4 ). To stain the liposomes, a small amount of 1 in DMSO was added with measurements being made after 1 h at 37 °C. The [ 1 ]:[liposome] ratio was around 1:170.
Cell Culture and Imaging
A human cervical cancer cell line (HeLa) and a human hepatoma cell line (HepG2) were cultured in Dulbecco’s Modified Eagle’s Medium (DMEM) and in RPMI 1640, respectively, each supplemented with 10% FBS (WelGene), penicillin (100 units/mL), and streptomycin (100 μg/mL). Two days before imaging, the cells were placed on glass-bottomed dishes (MatTek) which were incubated in a humidified atmosphere containing 5% (v/v) CO 2 at 37 °C. Cell images were obtained using confocal microscopes from Leica (Leica model TCS SP2) and Zeiss (Zeiss model LSM 510). All fluorescence images of probe 1 were obtained using an excitation wavelength of 458 nm and a long path (>505 nm) emission filter. Other information is available in the Figure captions. Treatment of HeLa Cells with Cycloheximide and Dinitrophenol For the tests of Trx secretion from HeLa cells, the cells were plated at the 2 × 10 5 /well level in glass-bottom dishes. After incubation overnight, the cells were treated with DMEM containing 0.5 mM dinitrophenol or 0.1 mM cycloheximide for 3 h at 37 °C. The media were exchanged for PBS containing 1 (5.0 μM) prior to confocal microscopic imaging. Treatment of HpG2 Cells with Fatty Acids HepG2 cells were plated at 2 × 10 5 /well in glass-bottom dishes and incubated for 24 h. The media were changed to one containing 0.7 mM OA or 0.7 mM PA with bovine serum albumin (BSA) for 24 h at 37 °C. The media were then replaced with RPMI (Roswell Park Memorial Institute) medium without FBS for 4 h. Finally, the cells were incubated with PBS containing 1 (5.0 μM) prior to confocal microscopic imaging.
Western Blot Experiments
To collect Trx protein that was presumably secreted into the extracellular medium, media from each well were treated with 20% trichloroacetic acid for 30 min in ice and centrifuged at 14 000 rpm for 15 min at 4 °C. The resulting pellet was washed with 200 μL cold acetone and centrifuged two more times before being dried for 10 min by exposure to the laboratory atmosphere to remove the acetone. After being air-dried in this way, the pellet was resuspended in a sodium dodecyl sulfate–polyacrylamide gel electrophoresis (SDS-PAGE) sample buffer. The secreted Trx was separated by SDS-PAGE (15% polyacrylamide) and blotted onto a PVDR membrane (pore size 0.2 μm) using a Bio-Rad Transblot kit (Trans-Blot SD semi-dry transfer cell kit, Bio-Rad, Inc., CA). The membrane was treated with a blocking solution (5% (w/v) nonfat dry milk in TBS-T) for 1 h at room temperature, before being subjected to primary antibody binding using goat anti-Trx antibody (ab16965, Abcam, Inc., MA); this was done using a blocking solution and overnight treatment at 4 °C. The excess antibody was removed by rinsing three times with TBS-T. For the secondary antibody binding studies, the membrane was incubated with a donkey anti-goat IgG-HRP antibody (sc-2005, Santa Cruz, Inc., Texas) in a blocking solution for 1 h at room temperature. After the membrane was rinsed with TBS-T buffer 3 times, the immunoreactive bands were detected via treatment with an ECL substrate solution (Western Blot Detection System, iNtRON, Inc., Kyunggi-do, Korea), followed by visualization on X-ray film (AGFA). The density ratio was normalized to that of the control. The values are expressed as mean ± SD, with an n = 4 (i.e., four independent samples from different cells). Data were analyzed statistically by the Student’s t test, and a value of p < 0.05 was considered to be statistically significant.
Immunohistochemistry-Based Colocalization of Trx with TXNIP or NLRP3
Cells in PBS solution were fixed with 4% paraformaldehyde in PBS for 30 min at room temperature and washed with a buffer (0.1% BSA and 0.1% Triton X-100). The fixed cells were blocked with a blocking buffer (1% BSA). After the blocking buffer was discarded, the cells were incubated with rabbit anti-Trx antibody (1:200, diluted with 0.1% BSA) overnight at 4 °C. After removal of the unbound antibody, the cells were incubated with goat anti-TXNIP or mouse anti-NLRP3 antibodies (1:200, diluted with 0.1% BSA) for 1 h at room temperature, followed by washing with the above buffer 3 times. The cells were incubated with the corresponding fluorescent secondary antibodies (1:1000, diluted with 0.1% BSA) for 1 h at room temperature. Finally, after washing, the fluorescence images of the cells were obtained based on a Z-stack (3D image stack) using a confocal microscope (Zeiss LSM 510 model) where the Z-stack images were collected at 1 μm intervals over a 0–9 μm range. Merged Z-stack and orthogonal images were then obtained. Trx (ab26320, Abcam, Inc., MA), TXNIP (SC-33099, Santa Cruz, Inc., TX), and NLRP3 (Cryo-2, Adipogen, Inc., Incheon, Korea) were detected using 488 donkey anti-rabbit IgG, 546 rabbit anti-goat IgG, and 633 goat anti-mouse IgG (A-21206, A-21085, and A-21050 from Molecular Probes, Inc., OR) antibodies. The images corresponding to Trx (green), TXNIP (red), and NLRP3 (red) were obtained using excitation wavelengths of 488, 543, and 633 nm and 505–530 nm band-path, 560 nm long-path, and 650 nm long-path filters, respectively.
Synthetic and Spectroscopic Methods
A complete listing of the methods used to prepare and characterize all new compounds, including probe 1, is included in the Supporting Information .
Supplementary Material ja503356q_si_001.pdf
📊 Figures
Scheme 1
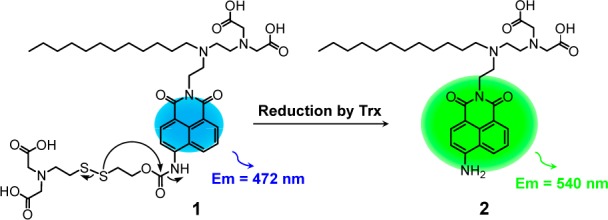
Schematic Representation of the Reaction of 1 with the Membrane-Localized Trx
As detailed in thenpresentnreport, probe 1 interacts with the lipid bilayer of ancell membrane, where Trx-induced reduction of the disulfide bond triggersna fluorescence change.
Scheme 2
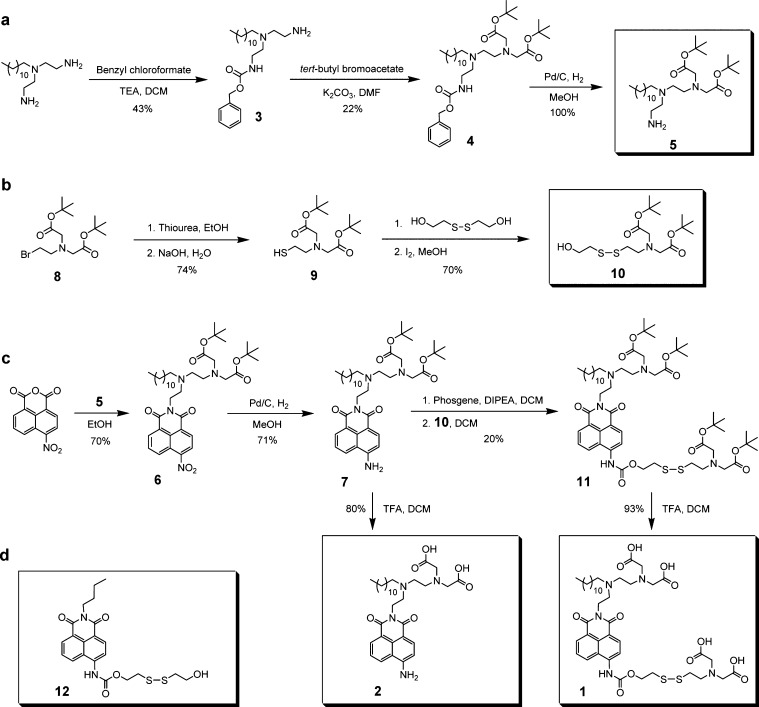
(au2013c) Synthetic Routes to Compounds 5 , 10 , 1 , and 2 and (d) Structure of the Reference Compound 12
TEA, triethylamine; DCM, dichloromethane;nDMF, N,N- dimethylformamide; DIPEA, N,N- diisopropylethylamine; TFA, trifluoroacetic acid.
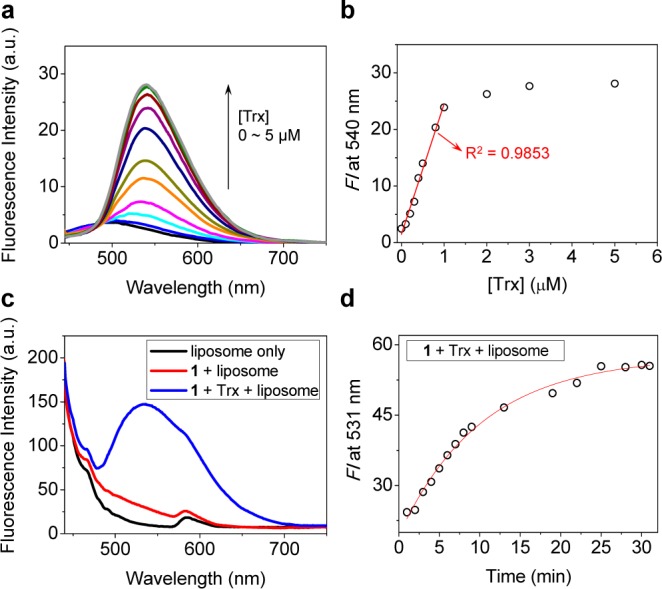
Figure 1
Trx-induced changes innthe photophysical properties of probe 1 in PBS solutionnand liposomes. (a) Fluorescence changesnof 1 (1.0 u03bcM) observed upon treatment with increasingnconcentrations of Trx (...
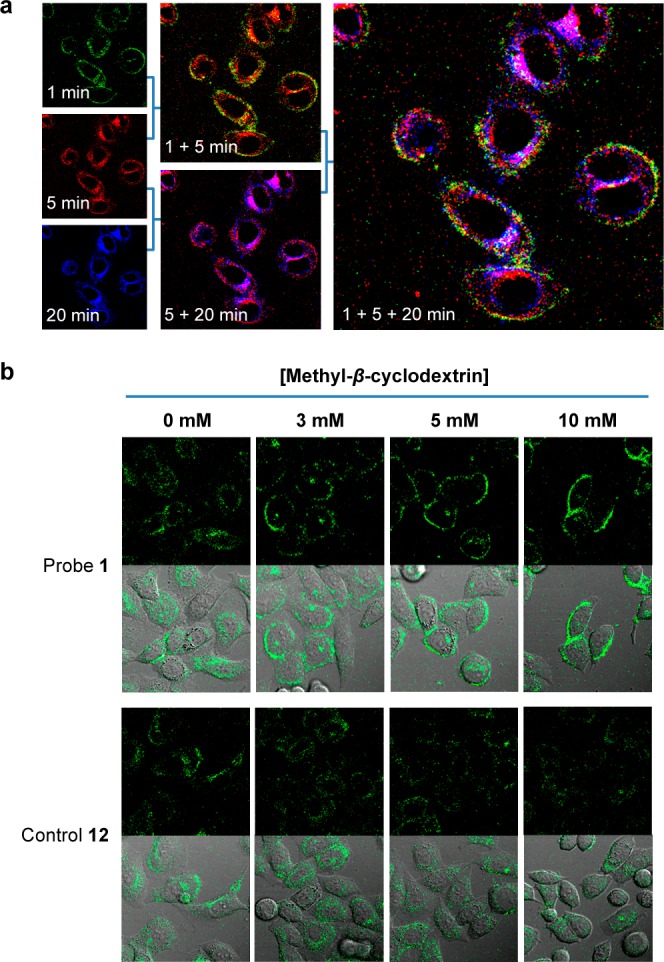
Figure 2
Confocal microscopy imagesnof HeLa cells showing the fluorogenicnresponse as a function of time after incubation with probe 1 and the effect of methyl-u03b2-cyclodextrin (MCD) on the cellnenvironment-...
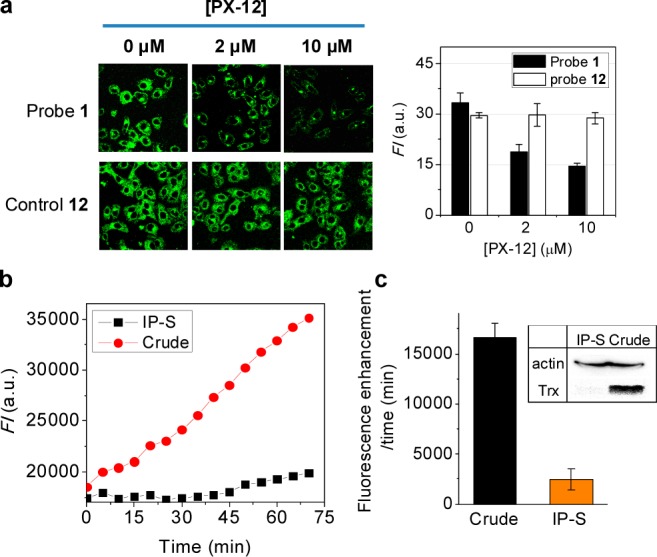
Figure 3
Changes in the fluorescence emission features of 1 andna control system ( 12 ) seen in HeLa cells and innprotein extract. (a) Effect of PX-12, a selective inhibitor of Trx,non the fluorogenic response...
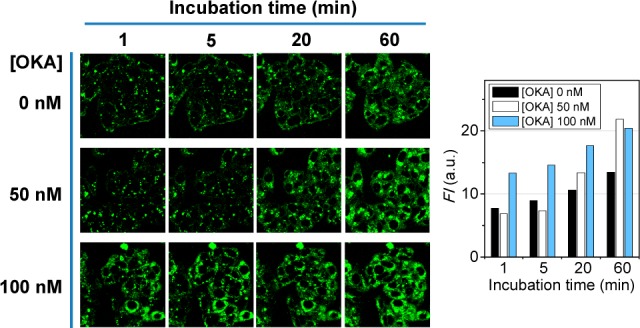
Figure 4
Fluorescence change of 1 in HepG2ncells treated withnokadaic acid (OKA). Cells were separately pretreated with media containingnOKA (0, 50, and 100 nM, respectively) for 1 h at 37 u00b0C. The medianwe...
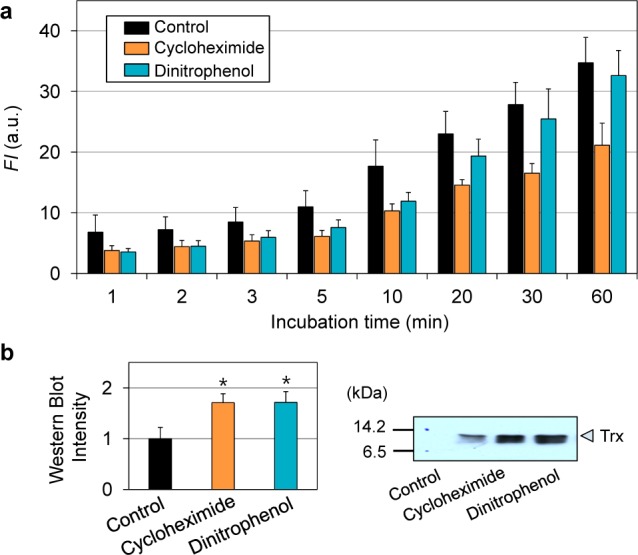
Figure 5
(a) Fluorescencenchange of 1 (5.0 u03bcM) observednin HeLa cells treated with the Trx secretion activators cycloheximiden(0.1 mM) and dinitrophenol (0.5 mM) for 3 h at 37 u00b0C. Bars representnthe av...
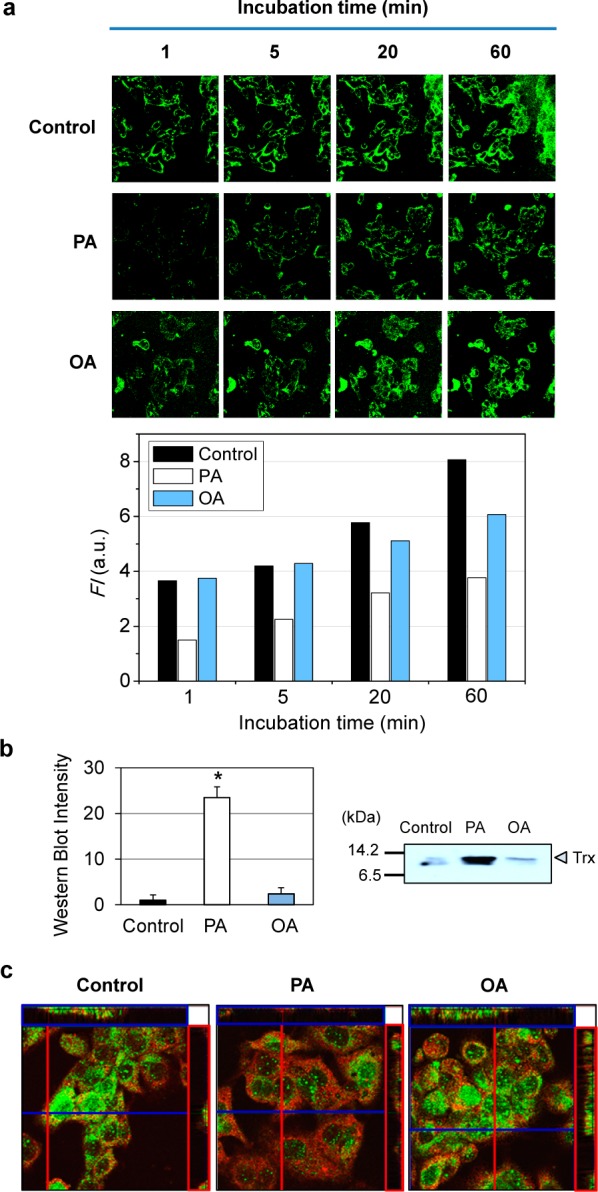
Figure 6
(a) Fluorescence change of 1 observed innHepG2 cellsntreated with fatty acids as a model of hepatosteatosis. Cells werenseparately pretreated with 0.7 mM of palmitic acid (PA) and oleicnacid (OA) for ...
Figure images are served from the NIH/NLM PubMed Central Open Access Subset or Europe PMC; copyright remains with the publishers and authors.
💬 Discussion
0 commentsNo comments yet. Be the first to start a discussion!
Leave a Comment