Abstract
We report the supramolecular organization of killer Ig–like receptor (KIR) phosphorylation using a technique applicable to imaging phosphorylation of any green fluorescent protein–tagged receptor at an intercellular contact or immune synapse. Specifically, we use fluorescence lifetime imaging (FLIM) to report Förster resonance energy transfer (FRET) between GFP-tagged KIR2DL1 and a Cy3-tagged generic anti-phosphotyrosine monoclonal antibody. Visualization of KIR phosphorylation in natural killer (NK) cells contacting target cells expressing cognate major histocompatibility complex class I proteins revealed that inhibitory signaling is spatially restricted to the immune synapse. This explains how NK cells respond appropriately when simultaneously surveying susceptible and resistant target cells. More surprising, phosphorylated KIR was confined to microclusters within the aggregate of KIR, contrary to an expected homogeneous distribution of KIR signaling across the immune synapse. Also, yellow fluorescent protein–tagged Lck, a kinase important for KIR phosphorylation, accumulated in a multifocal distribution at inhibitory synapses. Spatial confinement of receptor phosphorylation within the immune synapse may be critical to how activating and inhibitory signals are integrated in NK cells.
🔬 Techniques
💻 Software
✨ Fluorophores
🧪 Sample Preparation
🔬 Cell Lines
🏭 Microscope Brands
🧪 Reagent Suppliers
🔴 Lasers
💻 Software Details
🏛️ Research Organizations (ROR)
Affiliated research institutions:
📋 Methods
Cells
A transfectant of the MHC-deficient human B-lymphoblastoid cell line, 721.221 expressing HLA-Cw6 (221/Cw6) has been described ( Davis et al., 1999 ). YTS, a subclone of the human tumor line YT, expressing KIR2DL1 (YTS/KIR2DL1; Cohen et al., 1999 ), COOH-terminal GFP-tagged KIR2DL1 (YTS/KIR2DL1-GFP; Borszcz et al., 2003 ), or a truncated ITIM-less KIR2DL1-GFP (YTS-TR; Standeven et al., 2004 ) where GFP was placed just upstream of the membrane-proximal ITIM and the rest of the KIR was cytoplasmic tail deleted have also been described. A mutant of KIR2DL1-GFP (Y281F and Y311F) in which the two ITIM tyrosines were mutated to phenylalanine was generated in pBABE (QuikChange Mutagenesis; Stratagene). The membrane-distal tyrosine was mutated to phenylalanine first using the forward primer 5′-GATATCATCGTGTTCACGGAACTTCC-3′ and its reverse complement. The membrane-proximal tyrosine was then mutated to phenylalanine using the forward primer 5′-CCTCAGGAGGTGACATTCACACAGTTGAATC-3′ and its reverse complement. The fidelity of the construct was confirmed by sequencing and expressed in YTS cells by retroviral transduction as described previously ( Borszcz et al., 2003 ). For Lck-mYFP, human Lck was amplified by PCR from cDNA synthesized from PBL using primers 5′-CCCAAGCTTGCC ACCATGGGCTGTGGCTGCAGCTC-3′, including a HindIII restriction site, and 5′-GCGGTACCCCAGGCTGAGGCTGGTACTGGCCCTC-3′ to remove the stop codon and include a KpnI restriction site. The PCR product was first cloned into pCR2.1-TOPO (Invitrogen), and the correct sequence was confirmed and subcloned into the mammalian expression vector pcDNA 3.1/Hygro containing mYFP, i.e., with substitutions S65G, S72A, T203Y, and A206K (a gift from R. Tsien, University of California, San Diego, La Jolla, CA). This resulted in a construct encoding Lck and mYFP connected by an 11-amino-acid linker (Gly-Val-Pro-Ser-Ser-Asp-Pro-Pro-Val-Ala-Thr). YTS-KIR2DL1 and a variant of Jurkat lacking Lck, JCam1.6 (American Type Culture Collection), were each transfected to express Lck-mYFP by electroporation. Transfectants were grown in 0.8 mg/ml hygromycin, and Lck-mYFP–expressing cells were sorted by flow cytometry (FACSDiva; Becton Dickinson).
Show full methods section
Cells
A transfectant of the MHC-deficient human B-lymphoblastoid cell line, 721.221 expressing HLA-Cw6 (221/Cw6) has been described ( Davis et al., 1999 ). YTS, a subclone of the human tumor line YT, expressing KIR2DL1 (YTS/KIR2DL1; Cohen et al., 1999 ), COOH-terminal GFP-tagged KIR2DL1 (YTS/KIR2DL1-GFP; Borszcz et al., 2003 ), or a truncated ITIM-less KIR2DL1-GFP (YTS-TR; Standeven et al., 2004 ) where GFP was placed just upstream of the membrane-proximal ITIM and the rest of the KIR was cytoplasmic tail deleted have also been described. A mutant of KIR2DL1-GFP (Y281F and Y311F) in which the two ITIM tyrosines were mutated to phenylalanine was generated in pBABE (QuikChange Mutagenesis; Stratagene). The membrane-distal tyrosine was mutated to phenylalanine first using the forward primer 5′-GATATCATCGTGTTCACGGAACTTCC-3′ and its reverse complement. The membrane-proximal tyrosine was then mutated to phenylalanine using the forward primer 5′-CCTCAGGAGGTGACATTCACACAGTTGAATC-3′ and its reverse complement. The fidelity of the construct was confirmed by sequencing and expressed in YTS cells by retroviral transduction as described previously ( Borszcz et al., 2003 ). For Lck-mYFP, human Lck was amplified by PCR from cDNA synthesized from PBL using primers 5′-CCCAAGCTTGCC ACCATGGGCTGTGGCTGCAGCTC-3′, including a HindIII restriction site, and 5′-GCGGTACCCCAGGCTGAGGCTGGTACTGGCCCTC-3′ to remove the stop codon and include a KpnI restriction site. The PCR product was first cloned into pCR2.1-TOPO (Invitrogen), and the correct sequence was confirmed and subcloned into the mammalian expression vector pcDNA 3.1/Hygro containing mYFP, i.e., with substitutions S65G, S72A, T203Y, and A206K (a gift from R. Tsien, University of California, San Diego, La Jolla, CA). This resulted in a construct encoding Lck and mYFP connected by an 11-amino-acid linker (Gly-Val-Pro-Ser-Ser-Asp-Pro-Pro-Val-Ala-Thr). YTS-KIR2DL1 and a variant of Jurkat lacking Lck, JCam1.6 (American Type Culture Collection), were each transfected to express Lck-mYFP by electroporation. Transfectants were grown in 0.8 mg/ml hygromycin, and Lck-mYFP–expressing cells were sorted by flow cytometry (FACSDiva; Becton Dickinson).
Cell conjugation and staining
For cell conjugation, 5 × 10 5 YTS/KIR2DL1, YTS/KIR2DL1-GFP, YTS-TR, or YTS-KIR2DL1 (Y281F and Y311F) was mixed with 5 × 10 5 221/Cw6 cells in 50 μl warm media and incubated at 37°C/5% CO 2 for the indicated time. Cell conjugates were then fixed in 100 μl buffer containing paraformaldehyde and saponin (Cytofix/Cytoperm; Becton Dickinson) for 15 min at 4°C followed by 5 min at room temperature. Cells were washed in 0.1% Tween-20/PBS and blocked in 100 μl buffer containing saponin (Perm/Wash; Becton Dickinson) with 5% horse serum/3% BSA for 30 min at 4°C. Cell conjugates were stained in 100 μl of 10 μg/ml anti-phosphotyrosine mAb (clone 4G10; Upstate Biotechnology) tagged with Cy3 (Cy3/mAb ratio 8:1) for 2 h at 4°C. After washing, cell conjugates were gently resuspended and ∼8 μl was placed between a microscope slide (thickness 1 mm; Becton Dickinson) and a glass coverslip (thickness No. 1.5; Becton Dickinson). Inhibitors The Src family tyrosine kinase inhibitor PP2 (Calbiochem) and the Lck-specific inhibitor, 7-Cyclopentyl-5-(4-phenoxyphenyl)-7H-pyrrolo[2,3-d]pyrimidin-4-ylamine ( Burchat et al., 2000 ; Sigma-Aldrich) were diluted to 5 μM in cell media. YTS transfectants were preincubated with inhibitors for 1 h at 37°C/5% CO 2 before mixing with target cells for 10 min in the continuing presence of the inhibitor.
FLIM to measure FRET
FLIM was performed using an inverted scanning confocal microscope (DMIRE2/TCS SP2; Leica Microsystems Ltd) with a 63× oil immersion (NA 1.3). Single-photon excitation was achieved using a solid-state, diode-pumped, frequency-doubled Nd:YAG laser (Millennia; Spectra-Physics Ltd) to pump a mode-locked frequency-doubled Ti:Sapphire laser (Tsunami; Spectra-Physics Ltd) that provided optical pulses of 100-fs full width at half maximum at a repetition rate of 80 MHz. The laser was double passed through a glass block (total interaction length 130 cm) to stretch the pulse to a final width of 13 ps. The optimal excitation wavelength to excite the donor with minimal direct excitation of the acceptor was determined to be 470 nm. Fluorescence emission of KIR2DL1-GFP was collected using a narrow bandpass filter (515 ± 15 nm) to limit detection to only the donor fluorophore (GFP) and prevent contamination from acceptor (Cy3) emission. Fluorescence intensity images for Cy3-tagged anti-phosphotyrosine mAb were collected from 600–700 nm to limit bleed-through of the donor GFP fluorescence, resulting in images that are much dimmer than if the whole Cy3 emission spectrum was collected. The fluorescence lifetime of GFP-tagged KIR2DL1 was measured using time-correlated single photon counting (SPC-730; Becker & Hickl GmbH). Laser power was adjusted to give a mean photon count rate of ∼1 × 10 5 counts/s, and fluorescence lifetime images were acquired over 300 s. Fluorescence lifetimes were calculated for all pixels in the field of view (128 × 128 pixels; SPCImage). As the fluorescence intensity in the unconjugated (nonsynapse) membrane was very low, it was necessary to bin all photons from this region to accurately calculate the fluorescence lifetime. To achieve this, an in house–written fluorescence-decay program (written in Labview [National Instruments]) was used. The fluorescence lifetime for the synapse was also calculated using this program and agreed well with the fluorescence lifetime calculated using SPCImage. FRET efficiency images were calculated such that the FRET efficiency, E FRET = 1 − τ DA /τ D , where τ DA is the pixel-by-pixel fluorescence lifetime of the donor in the presence of the acceptor and τ D is the mean fluorescence lifetime of the donor at the IS in the absence of the acceptor for all cells imaged (unstained controls). Mean FRET efficiencies at the IS were calculated where τ DA is the mean fluorescence lifetime of the donor in the presence of the acceptor and τ D is the mean fluorescence lifetime of the donor in the absence of the acceptor. 3D imaging of FRET was obtained by fluorescence lifetime images being acquired every 0.5 μm throughout the conjugate. An in house–written MatLab program was used to generate the en face fluorescence lifetime data for those synapses that were orientated vertically or horizontally to the x axis of the image. To select the pixels in the synapse volume, a region of interest was first created around a synapse in one of the image slices from the stack. This produced a 4D matrix consisting of the three spatial dimensions of the synapse and the lifetime intensity information for each pixel. The lifetime intensity information was then integrated along one of the spatial dimensions, x or y, i.e., perpendicular to the synapse region selected, effectively collapsing the volume to produce a 2D lifetime image (x or y and z with lifetime data). This dataset was then used to produce the en face intensity and fluorescence lifetime images (SPCImage fitting software). Similar images, demonstrating microclusters of signaling, were also obtained using commercially available 3D rendering software (Volocity; Improvision) to create the en face image of optical sections individually processed in SPCImage (unpublished data). Image presentation As fluorescence lifetime images were limited to 128 × 128 pixels, the limit in resolution of the photon counting detector, it was necessary to apply an interpolation method to obtain enlarged images of synapses at suitable resolution and size for publication. For this, the “nearest neighbor” interpolation method (Photoshop 7; Adobe) was applied, which sets the value (or color, in this case) of an interpolated point to the value of the nearest existing data point, effectively making the pixels bigger. For example, to enlarge 200%, one pixel will be enlarged to a 2 × 2 area of four pixels with the same color as the original pixel. This is the most appropriate method for interpolation of indexed images, i.e., images that map pixel values to colors, as it does not change the color information of the image and does not introduce any anti-aliasing, which would make edges appear smoother by averaging out pixels. An exception is that for reconstruction of the en face synapse (shown in Fig. 5 ) the bicubic method of interpolation was applied. We carefully confirmed that the images of synapses did not appear different by applying this procedure, and analysis of fluorescence lifetime data was always performed on the raw, noninterpolated data.
Variability in FLIM
It is clear that random errors caused by instrumental drift or subtle variation in the biological sample will effect different lifetime images far more so than within a single image. It has been specifically calculated that interimage differences, using a frequency-based FLIM methodology, are typically one order of magnitude greater than intraimage variations ( Hanley et al., 2001 ). We have addressed this in three ways: (1) In all experiments, we compared image data taken from one specific experiment performed over one single day. (2) We confirmed that the presence or absence of FRET was consistent in each sample over multiple independent experiments. (3) The “breakpoint” in all images using a discrete scale for the fluorescence lifetime is specifically set at the point where FRET efficiency is 5% for that experiment.
Live cell imaging
YTS/KIR2DL1 cells transfected to express Lck-mYFP and 221/Cw6 target were mixed in a glass-bottomed microscope chamber (Nunc) containing 200 μl of warm RPMI media. Live cell conjugates were imaged by resonance scanning confocal microscopy (DMIRE2/TCS SP2 RS) using a 63× water-immersion objective (NA 1.2). The microscope stage was housed within an environmental chamber (Solent Scientific) maintained at 37°C/5% CO 2 . mYFP was excited using the 514-nm line of an argon laser. 3D views of cell conjugates and en face views of the synapse were reconstructed using Volocity.
📊 Figures
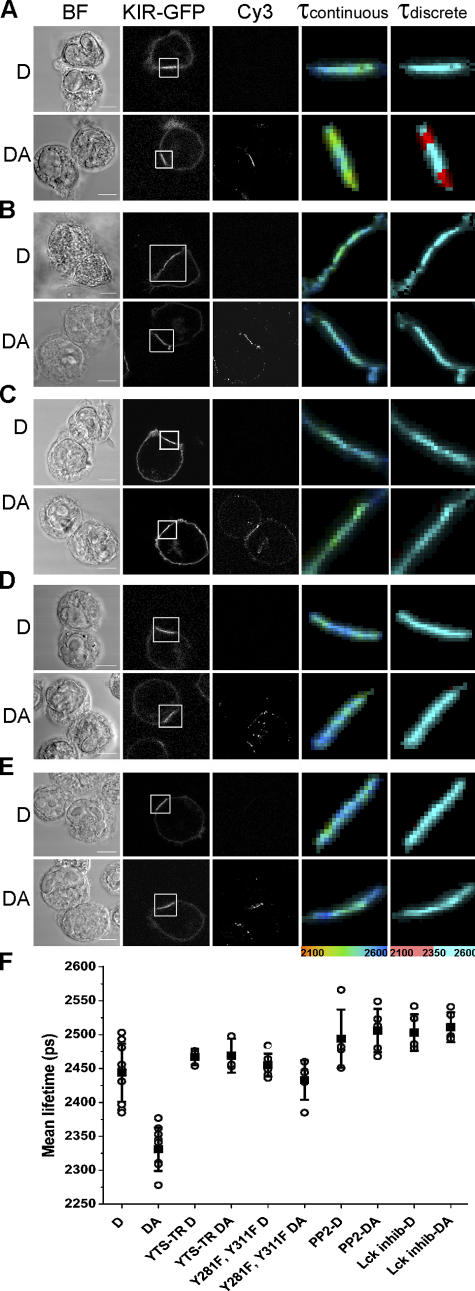
Figure 1.
Imaging KIR2DL1 phosphorylation at the inhibitory NK cell IS. YTS cells expressing full-length KIR2DL1-GFP (A), a truncated ITIM-less KIR2DL1-GFP (YTS-TR; B), or KIR2DL1-GFP (Y281F and Y311F; C) in wh...
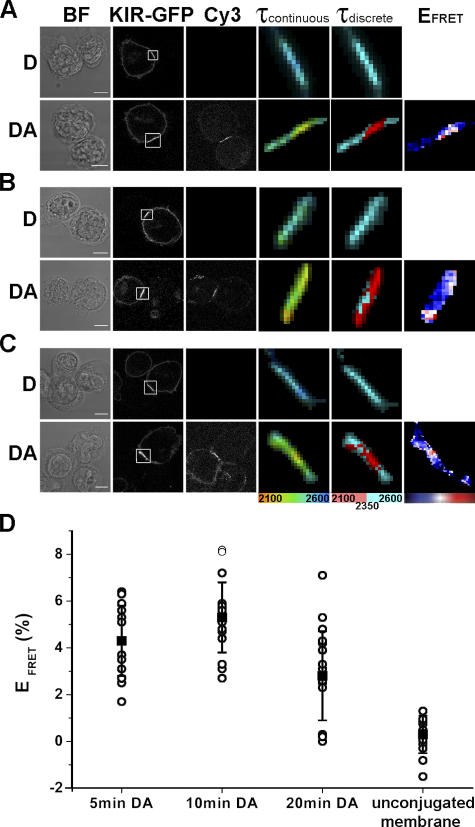
Figure 2.
KIR2DL1 phosphorylation is sustained at the inhibitory NK cell IS. YTS/KIR2DL1-GFP cells were coincubated with 221/Cw6 for 5 min (A), 10 min (B), or 20 min (C) and then fixed and stained with Cy3-labe...
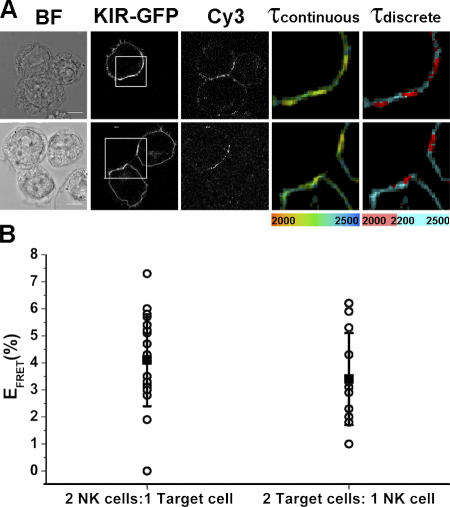
Figure 3.
KIR phosphorylation occurs specifically at the IS. YTS/KIR2DL1-GFP cells were coincubated with 221/Cw6. (A) Multiple cell conjugates consisting of either a single NK cell in conjugation with two targe...
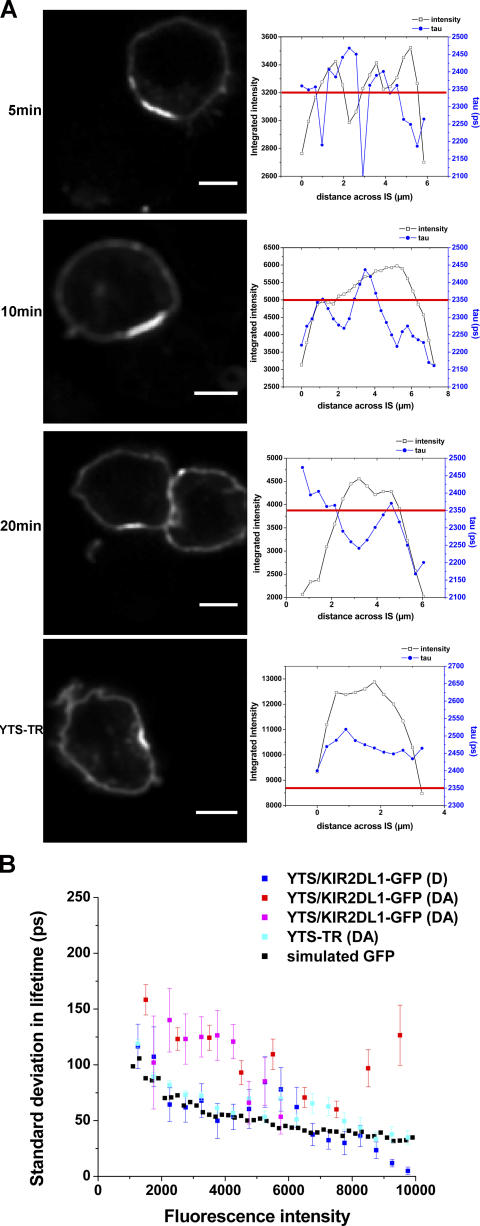
Figure 4.
KIR phosphorylation occurs in discrete microclusters. (A) KIR2DL1-GFP fluorescence intensity and fluorescence lifetime were analyzed across the region of clustered KIR (left) by plotting (right) the i...
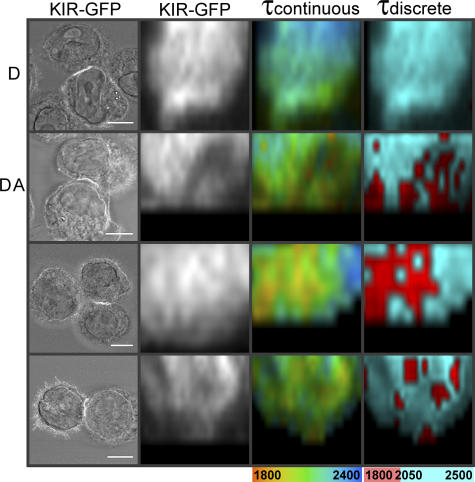
Figure 5.
3D FLIM of FRET reveals microclusters of signaling at the inhibitory NK cell IS. 3D imaging of FRET was obtained by FLIM images being acquired every 0.5 u03bcm throughout the conjugate. En face recons...
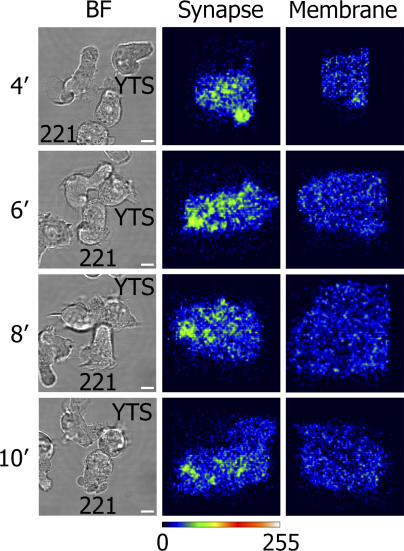
Figure 6.
Lck is distributed in microclusters at inhibitory NK cell synapses. Live cell imaging of YTS/KIR2DL1 transfected to express Lck-mYFP in the presence of 221/Cw6 target cells was performed by resonance ...
Figure images are served from the NIH/NLM PubMed Central Open Access Subset or Europe PMC; copyright remains with the publishers and authors.
💬 Discussion
0 commentsNo comments yet. Be the first to start a discussion!
Leave a Comment