Abstract
Retinitis pigmentosa (RP), a disease characterized by the progressive degeneration of mutation-bearing photoreceptors, is a significant cause of incurable blindness in the young worldwide. Recent studies have found that activated retinal microglia contribute to photoreceptor demise via phagocytosis and proinflammatory factor production, however mechanisms regulating these contributions are not well-defined. In this study, we investigate the role of CX3CR1, a microglia-specific receptor, in regulating microglia-mediated degeneration using the well-established rd10 mouse model of RP. We found that in CX3CR1-deficient (CX3CR1(GFP/GFP) ) rd10 mice microglial infiltration into the photoreceptor layer was significantly augmented and associated with accelerated photoreceptor apoptosis and atrophy compared with CX3CR1-sufficient (CX3CR1(GFP/+) ) rd10 littermates. CX3CR1-deficient microglia demonstrated increased phagocytosis as evidenced by (1) having increased numbers of phagosomes in vivo, (2) an increased rate of phagocytosis of fluorescent beads and photoreceptor cellular debris in vitro, and (3) increased photoreceptor phagocytosis dynamics on live cell imaging in retinal explants, indicating that CX3CR1 signaling in microglia regulates the phagocytic clearance of at-risk photoreceptors. We also found that CX3CR1 deficiency in retinal microglia was associated with increased expression of inflammatory cytokines and microglial activation markers. Significantly, increasing CX3CL1-CX3CR1 signaling in the rd10 retina via exogenous intravitreal delivery of recombinant CX3CL1 was effective in (1) decreasing microglial infiltration, phagocytosis and activation, and (2) improving structural and functional features of photoreceptor degeneration. These results indicate that CX3CL1-CX3CR1 signaling is a molecular mechanism capable of modulating microglial-mediated degeneration and represents a potential molecular target in therapeutic approaches to RP. GLIA 2016;64:1479-1491.
🔬 Techniques
🔭 Microscopes
🧬 Organisms
💻 Software
✨ Fluorophores
🧪 Sample Preparation
🔬 Cell Lines
🏭 Microscope Brands
🧪 Reagent Suppliers
💻 Software Details
🏛️ Research Organizations (ROR)
Affiliated research institutions:
📋 Methods
Experimental Animals
Experiments were conducted according to protocols approved by a local Institutional Animal Care and Use Committee and adhered to the Association for Research in Vision and Ophthalmology (ARVO) Statement for animal use in ophthalmic and vision research. Mice homozygous for the Pde6b rd10 loss‐of‐function point mutation (rd10; Stock No. 004297) and for the loss‐of‐function CX3CR1‐GFP targeted mutation (CX3CR1 GFP/GFP ; Stock No. 005582) were obtained from The Jackson Laboratory (Bar Harbor, ME). Animals were genotyped and confirmed to lack the rd8 mutation (Mattapallil et al., 2012 ). Transgenic mouse lines were crossed together to generate Pde6b rd10/rd10 , CX3CR1 GFP/GFP mice; these were subsequently crossed with Pde6b rd10/rd10 , CX3CR1 +/GFP to generate Pde6b rd10/rd10 , CX3CR1 GFP/GFP , and Pde6b rd10/rd10 , CX3CR1 +/GFP littermates (hereafter referred to as rd10;CX3CR1 GFP/GFP and rd10;CX3CR1 GFP/+ respectively). Experiments involved animals in the range of ages from postnatal day (P)15‐P28 that were of mixed gender. Animals were housed in a National Institutes of Health animal facility under a 12‐h light/dark cycle with food ad libitum .
Immunohistochemistry and TUNEL Labeling of Retinal Sections
Mice euthanized by carbon dioxide inhalation were enucleated. The resulting eyecups were marked for orientation and then placed in 4% paraformaldehyde (1 h at room temperature) for fixation and then embedded in 7% agarose. Retinal sections of 100 μm thickness that traversed the optic nerve in the superior‐inferior plane were prepared using a vibratome (VT1000, Leica). Sections were blocked and permeabilized (in 1xPBS, with 5% normal goat serum, 0.5% Triton X‐100 for 3 h at room temperature), and then incubated in primary antibodies in 1x PBS with 0.5% Triton X‐100 for 36 h at 4°C. Primary antibodies included rabbit anti‐Iba1 (Wako, #019‐19741, 1:500), rat anti‐CD68 (AbD Serotec, 1:500), mouse anti‐IL1β (Cell Signaling, #12242S, 1:50), and mouse anti‐CX3CL1 (R&D Systems, #AF537, 1:100). Sections were washed and then incubated overnight with secondary antibodies (Alexa Fluor‐488‐conjugated goat anti‐rabbit IgG for Iba1; Alexa Fluor‐568‐conjugated goat anti‐rabbit or rat IgG for CX3CL1 or CD68, respectively) and DAPI (1:500; Sigma). Experiments in which primary antibodies were omitted served as negative controls. Apoptotic photoreceptors were labeled with a terminal deoxynucleotidyl transferase dUTP Nick End Labeling (TUNEL) assay (Roche, Indianapolis, IN) according to the manufacturer's specifications. Stained retinal sections were imaged with confocal microscopy (FluoView 1000, Olympus). Multiplane z‐series were collected using a 40× oil‐immersion objective and analyzed with FV100 Viewer Software (Olympus) and Image J (NIH). In Vitro Phagocytosis Assays Retinal microglia were cultured from CX3CR1 GFP/GFP and CX3CR1 GFP/+ retinas as previously described (Ma et al. 2013 ) and seeded into six‐well plates (5 × 10 5 cells/well). In one phagocytosis assay, cultured microglia were incubated with fluorescent bioparticles (1 mg mL −1 , pHrodo Red E. coli Bioparticles®, # P35361 , Life Technologies) for 2 h at 37°C according to the manufacturer's instructions. In a separate assay, photoreceptor debris was prepared by trypsinization and sonication of cultured 661W photoreceptor cells (gift of Dr. Muyyad Al‐Ubaidi, University of Oklahoma Health Sciences Center) that had been previously labeled with the lipophilic dye DiI (CellTracker™ CM‐DiI Dye, #C‐7001, Thermo Fisher Scientific). This was added to microglia cultures for 12 and 24 h to allow phagocytic uptake. Microglial phagocytosis of bioparticles or debris was imaged on an epifluorescence microscope.
Show full methods section
Experimental Animals
Experiments were conducted according to protocols approved by a local Institutional Animal Care and Use Committee and adhered to the Association for Research in Vision and Ophthalmology (ARVO) Statement for animal use in ophthalmic and vision research. Mice homozygous for the Pde6b rd10 loss‐of‐function point mutation (rd10; Stock No. 004297) and for the loss‐of‐function CX3CR1‐GFP targeted mutation (CX3CR1 GFP/GFP ; Stock No. 005582) were obtained from The Jackson Laboratory (Bar Harbor, ME). Animals were genotyped and confirmed to lack the rd8 mutation (Mattapallil et al., 2012 ). Transgenic mouse lines were crossed together to generate Pde6b rd10/rd10 , CX3CR1 GFP/GFP mice; these were subsequently crossed with Pde6b rd10/rd10 , CX3CR1 +/GFP to generate Pde6b rd10/rd10 , CX3CR1 GFP/GFP , and Pde6b rd10/rd10 , CX3CR1 +/GFP littermates (hereafter referred to as rd10;CX3CR1 GFP/GFP and rd10;CX3CR1 GFP/+ respectively). Experiments involved animals in the range of ages from postnatal day (P)15‐P28 that were of mixed gender. Animals were housed in a National Institutes of Health animal facility under a 12‐h light/dark cycle with food ad libitum .
Immunohistochemistry and TUNEL Labeling of Retinal Sections
Mice euthanized by carbon dioxide inhalation were enucleated. The resulting eyecups were marked for orientation and then placed in 4% paraformaldehyde (1 h at room temperature) for fixation and then embedded in 7% agarose. Retinal sections of 100 μm thickness that traversed the optic nerve in the superior‐inferior plane were prepared using a vibratome (VT1000, Leica). Sections were blocked and permeabilized (in 1xPBS, with 5% normal goat serum, 0.5% Triton X‐100 for 3 h at room temperature), and then incubated in primary antibodies in 1x PBS with 0.5% Triton X‐100 for 36 h at 4°C. Primary antibodies included rabbit anti‐Iba1 (Wako, #019‐19741, 1:500), rat anti‐CD68 (AbD Serotec, 1:500), mouse anti‐IL1β (Cell Signaling, #12242S, 1:50), and mouse anti‐CX3CL1 (R&D Systems, #AF537, 1:100). Sections were washed and then incubated overnight with secondary antibodies (Alexa Fluor‐488‐conjugated goat anti‐rabbit IgG for Iba1; Alexa Fluor‐568‐conjugated goat anti‐rabbit or rat IgG for CX3CL1 or CD68, respectively) and DAPI (1:500; Sigma). Experiments in which primary antibodies were omitted served as negative controls. Apoptotic photoreceptors were labeled with a terminal deoxynucleotidyl transferase dUTP Nick End Labeling (TUNEL) assay (Roche, Indianapolis, IN) according to the manufacturer's specifications. Stained retinal sections were imaged with confocal microscopy (FluoView 1000, Olympus). Multiplane z‐series were collected using a 40× oil‐immersion objective and analyzed with FV100 Viewer Software (Olympus) and Image J (NIH). In Vitro Phagocytosis Assays Retinal microglia were cultured from CX3CR1 GFP/GFP and CX3CR1 GFP/+ retinas as previously described (Ma et al. 2013 ) and seeded into six‐well plates (5 × 10 5 cells/well). In one phagocytosis assay, cultured microglia were incubated with fluorescent bioparticles (1 mg mL −1 , pHrodo Red E. coli Bioparticles®, # P35361 , Life Technologies) for 2 h at 37°C according to the manufacturer's instructions. In a separate assay, photoreceptor debris was prepared by trypsinization and sonication of cultured 661W photoreceptor cells (gift of Dr. Muyyad Al‐Ubaidi, University of Oklahoma Health Sciences Center) that had been previously labeled with the lipophilic dye DiI (CellTracker™ CM‐DiI Dye, #C‐7001, Thermo Fisher Scientific). This was added to microglia cultures for 12 and 24 h to allow phagocytic uptake. Microglial phagocytosis of bioparticles or debris was imaged on an epifluorescence microscope.
Live Time‐lapse Confocal Imaging
Microglial dynamic phagocytosis was examined by live‐cell time‐lapse confocal imaging in retinal explants from rd10;CX3CR1 GFP/GFP and rd10;CX3CR1 GFP/+ mice at P22‐24 as previously described (Zhao et al., 2015 ). Briefly, retina explants were incubated in an oxygenated chamber in Ringer's solution containing propidium iodide (PI; 1:5000; Life Technologies) to label the nuclei of permeabilized cells and Hoechst 33342 (1:500; Life Technologies) to label all nuclei, before transfer to a temperature‐controlled (32°C) stage (Bioptechs) through which oxygenated Ringer's solution was superfused. Dynamic microglial behavior was followed with time‐lapse confocal imaging (FV1000, Olympus) using a 40× immersion objective. Z‐series stacks of microglia within the outer nuclear layer (ONL) were captured at a resolution of 1024 × 1024 pixels every 49 s for up to 2 h.
Image Analysis
Morphological analyses were performed in retinal sections in the region of the inferior mid‐peripheral retina (0.75–1.25 mm radial distance from the optic nerve). Counts of retinal microglia, microglial phagosomes, and TUNEL+ nuclei in the ONL, were performed on z‐projections of confocal stacks of uniform depth. Mean thickness measurements of the ONL were computed across a 40× imaging field. For in vitro phagocytosis assays, areas of fluorescence (corresponding to intracellular fluorescent beads or DiI‐labelled 661W cell debris) were derived by thresholding images captured under uniform imaging conditions, and expressed as a fraction of the area covered by microglial cells. In time‐lapse imaging experiments, images were processed using ImageJ as previously described (Damani et al., 2011 ; Fontainhas et al., 2011 ). All GFP‐labeled microglia in the imaging field were scored for phagocytic events, including engulfment of photoreceptor nuclei and the subsequent development of PI‐labeling of engulfed nuclei; the mean rate of events were expressed as mean number of events per microglia per unit time. The proportion of PI+ nuclei in the ONL nuclei was also counted and computed for each recording field.
Measurement of Cytokine Levels
Dissected mouse retinas were placed into 150 μL of protein lysate buffer (Complete Ultra, Roche) with proteinase inhibitor cocktail (Calbiochem, Gibbstown, NJ) at 4°C. Following sonication and centrifugation, protein concentration was measured (BCA protein assay kit, Pierce). Cytokine levels were determined using a Milliplex ® assay kit (Milliplex MAP mouse cytokine/chemokine magnetic bead panel, #MCYTOMAG‐70K, Millipore Corp) using the Luminex MAPIX system with data analysis using xPONENT 4.2 software (Luminex Corporation). Inhibition of CX3CR1 Signaling with Recombinant CX3CL1 To augment CX3CR1 signaling in microglia, exogenous full‐length recombinant mouse CX3CL1 (R&D Systems, #472‐FF/CF) was injected intravitreally into one eye of P20 rd10;CX3CR1 +/GFP mice (1 μL injection of 66–100 ng μL −1 solution, final vitreous concentration of 17.5–25 ng μL −1 in PBS). The contralateral control eye received an equal dose of heat‐inactivated CX3CL1 in PBS. Animals were sacrificed at P26 and their retinas analyzed. The order of eye (right or left) receiving CX3CL1 vs. control was alternated in experimental replicates. Electroretinographic Analysis Electroretinographs (ERGs) were recorded in rd10 mice using an Espion E 2 system (Diagnosys). Mice were dark adapted overnight, anesthetized with intraperitoneal ketamine (90 mg kg −1 ) and xylazine (8 mg kg −1 ), and dilated with topical tropicamide (1%, Alcon) and phenylephrine (2.5%, Alcon). Flash ERGs recordings were obtained simultaneously from both eyes with gold wire loop electrodes, with the reference electrode was placed in the mouth and the ground subdermal electrode at the tail. ERG responses were obtained at increasing light intensities over the ranges of 1 × 10 −4 −10 cd·s m −2 under dark‐adapted conditions, and 0.3–100 cd·s m −2 under a background light that saturates rod function. The stimulus interval between flashes ranged from 5 to 60 s (from lowest to highest stimulus strengths). ERG signals were sampled at 1 kHz and recorded with 0.3 Hz low‐frequency and 300 Hz high‐frequency cutoffs. Analysis of a‐wave and b‐wave amplitudes was performed using customized Espion ERG Data Analyzer software (v2.2).
Statistical Analysis
All data were analyzed using statistical software (Graphpad Software). A normality test (D'Agostino and Pearson) was used to analyze the distribution of all data sets. For two‐way comparisons of data following a Gaussian distribution, independent data sets were analyzed with an unpaired two‐tailed t test; data not following a Gaussian distribution was analyzed with a non‐parametric Mann–Whitney test. Paired data sets were analyzed with a paired t test. For comparisons determining the effect of genotype on experimental animals of different ages, a two‐way ANOVA was employed. A P value < 0.05 was set as the basis for rejecting the null hypothesis.
Experimental Animals
Experiments were conducted according to protocols approved by a local Institutional Animal Care and Use Committee and adhered to the Association for Research in Vision and Ophthalmology (ARVO) Statement for animal use in ophthalmic and vision research. Mice homozygous for the Pde6b rd10 loss‐of‐function point mutation (rd10; Stock No. 004297) and for the loss‐of‐function CX3CR1‐GFP targeted mutation (CX3CR1 GFP/GFP ; Stock No. 005582) were obtained from The Jackson Laboratory (Bar Harbor, ME). Animals were genotyped and confirmed to lack the rd8 mutation (Mattapallil et al., 2012 ). Transgenic mouse lines were crossed together to generate Pde6b rd10/rd10 , CX3CR1 GFP/GFP mice; these were subsequently crossed with Pde6b rd10/rd10 , CX3CR1 +/GFP to generate Pde6b rd10/rd10 , CX3CR1 GFP/GFP , and Pde6b rd10/rd10 , CX3CR1 +/GFP littermates (hereafter referred to as rd10;CX3CR1 GFP/GFP and rd10;CX3CR1 GFP/+ respectively). Experiments involved animals in the range of ages from postnatal day (P)15‐P28 that were of mixed gender. Animals were housed in a National Institutes of Health animal facility under a 12‐h light/dark cycle with food ad libitum .
Supporting information Supporting Information Click here for additional data file.
📊 Figures
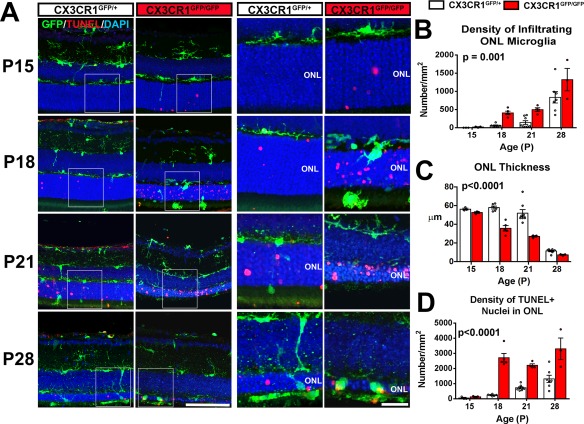
Figure 1
CX3CR1 deficiency is associated with early and augmented microglial infiltration into the outer nuclear layer (ONL) and with accelerated photoreceptor degeneration in the rd10 model of retinitis pigme...
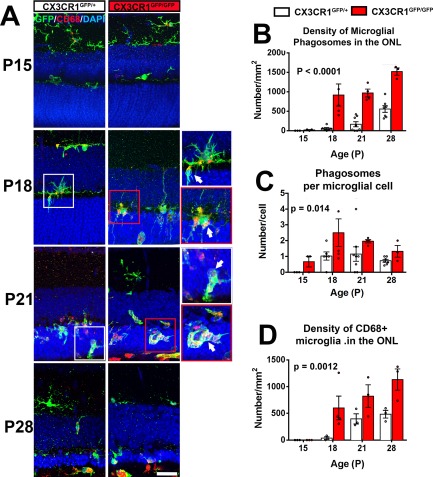
Figure 2
CX3CR1u2010deficient microglia demonstrates increased phagocytosis of photoreceptors in the rd10 retina. ( A ) Comparison of retinal sections from rd10;CX3CR1 GFP/+ and rd10;CX3CR1 GFP/GFP mice at dif...
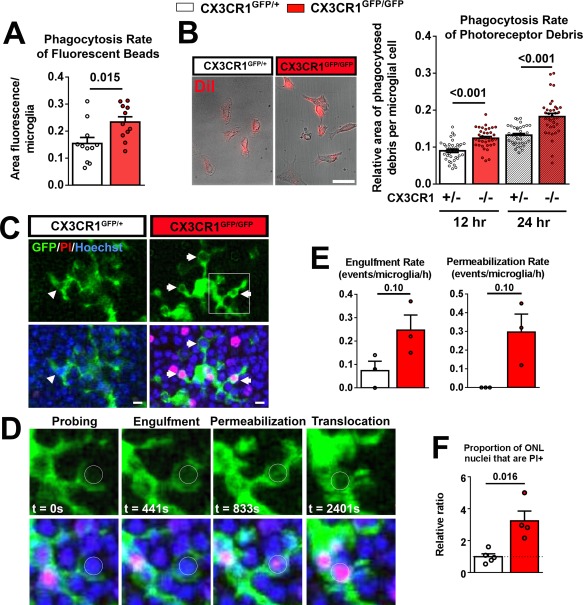
Figure 3
CX3CR1u2010deficiency in retinal microglia is associated with increased phagocytic activity. Phagocytosis in microglia cultured from the retinas of CX3CR1 GFP/+ and CX3CR1 GFP/GFP mice were evaluated ...
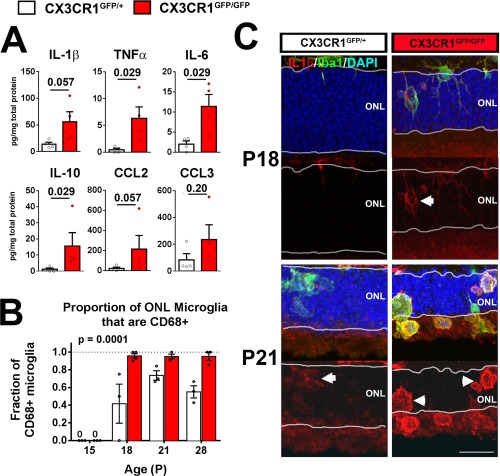
Figure 4
CX3CR1 deficiency in retinal microglia results in increased expression of proinflammatory cytokines in the rd10 retina. ( A ) Protein levels of cytokines in the retinas of rd10;CX3CR1 GFP/+ and rd10;C...
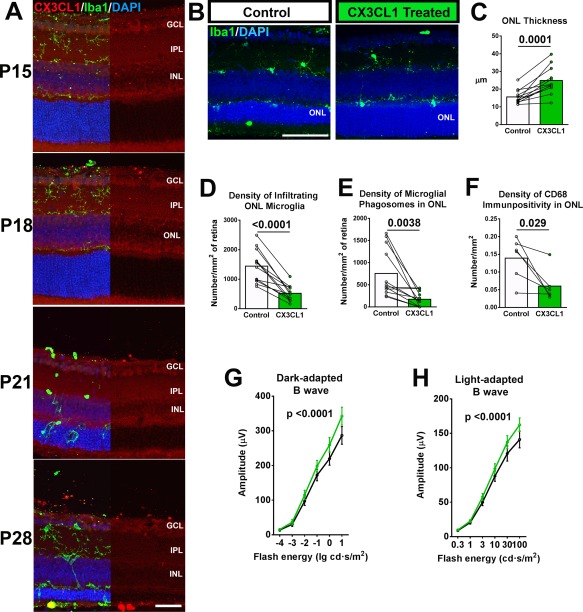
Figure 5
Increased CX3CL1u2010CX3CR1 signaling in retinal microglia induced by exogenous delivery of CX3CL1 ameliorates photoreceptor degeneration in rd10 mice. ( A ) CX3CL1, the ligand for CX3CR1, is endogeno...
Figure images are served from the NIH/NLM PubMed Central Open Access Subset or Europe PMC; copyright remains with the publishers and authors.
💬 Discussion
0 commentsNo comments yet. Be the first to start a discussion!
Leave a Comment