Abstract
The current model of hepatitis C virus (HCV) production involves the assembly of virions on or near the surface of lipid droplets, envelopment at the ER in association with components of VLDL synthesis, and egress via the secretory pathway. However, the cellular requirements for and a mechanistic understanding of HCV secretion are incomplete at best. We combined an RNA interference (RNAi) analysis of host factors for infectious HCV secretion with the development of live cell imaging of HCV core trafficking to gain a detailed understanding of HCV egress. RNAi studies identified multiple components of the secretory pathway, including ER to Golgi trafficking, lipid and protein kinases that regulate budding from the trans-Golgi network (TGN), VAMP1 vesicles and adaptor proteins, and the recycling endosome. Our results support a model wherein HCV is infectious upon envelopment at the ER and exits the cell via the secretory pathway. We next constructed infectious HCV with a tetracysteine (TC) tag insertion in core (TC-core) to monitor the dynamics of HCV core trafficking in association with its cellular cofactors. In order to isolate core protein movements associated with infectious HCV secretion, only trafficking events that required the essential HCV assembly factor NS2 were quantified. TC-core traffics to the cell periphery along microtubules and this movement can be inhibited by nocodazole. Sub-populations of TC-core localize to the Golgi and co-traffic with components of the recycling endosome. Silencing of the recycling endosome component Rab11a results in the accumulation of HCV core at the Golgi. The majority of dynamic core traffics in association with apolipoprotein E (ApoE) and VAMP1 vesicles. This study identifies many new host cofactors of HCV egress, while presenting dynamic studies of HCV core trafficking in infected cells.
🔬 Techniques
🔭 Microscopes
💻 Software
✨ Fluorophores
🧪 Sample Preparation
🏭 Microscope Brands
🧪 Reagent Suppliers
📷 Detectors
💻 Software Details
🏛️ Research Organizations (ROR)
Affiliated research institutions:
📋 Methods
Virus and cells
Huh-7.5 cells were grown in Dulbecco's modified high glucose media (DMEM; Invitrogen) supplemented with 10% fetal bovine serum (FBS; Invitrogen), nonessential amino acids (NEAA, 0.1 mM; Gibco), and 1% penicillin-streptomycin (Invitrogen). Viral RNA was electroporated into Huh-7.5 cells as described previously [43] , [44] . Viral supernatants were collected daily from up to 5 passages of electroporated cells, filtered through a .22 µm nitrocellulose filter, and kept at 4°C protected from light.
Plasmid constructs pJFHxJ6-CNS2C3
(WT) is a HCV genotype 2a infectious clone where core through the first transmembrane domain of NS2 of a JFH-1 backbone was replaced with J6 genotype sequence [91] . A full length (FLN CCPGCC MEP) tetracysteine (TC) tag [92] was inserted into the HCV core gene after amino acid 3 by amplifying two regions (5′ and 3′ of the tag) and joining the two regions with an ApaLI restriction site proximal to the tag insertion site. The full length TC tag has been shown to enhance binding of biarsenical dyes [92] . The 5′ region was amplified using 5′ AAC GAATTC TAATACGACTCACTATAGACC and 5′ AAC GTGCAC GGTCTACGAGACCTCCCGGGG ( EcoR I and ApaL I sites underlined). The 3′ region was amplified using 5′ AAC GTGCAC CATGAGCACA TTTCTCAATTGTTGTCCTGGCTGTTGTATGGAACCT AATCCTAAACCTCAAAGAAAAACC and 5′ AAC CGTACG CCAAGATCATGGTAGCCGTGG ( ApaL I and BsiW I sites underlined, TC tag bolded). The 5′ and 3′ regions were digested with ApaLI and ligated together to form the full-length core region with the tag inserted. The TC-core fragment was subsequently cloned into JFHxJ6NS23 using the EcoR I and BsiW I sites and the TC tag insertion was confirmed by sequencing. The bicistronic construct was constructed by insertion of a HCV genotype 2a IRES – NS2 fragment into a subgenomic replicon, pSGR-JFH1-neo, containing the encephalomyocarditis virus (EMCV) IRES through the HCV replicase genes NS3-NS5B [52] . The IRES-NS2 fragment was PCR amplified by using the primers 5′ACC GAATTC TAATACGACTCACTATAGACCTGCCCCTAATAG and 5′ ACC GTTTAAAC TTAAAGGAGCTTCCACCCCTTGGAGGTGTAGCCATCAGCTGG ( EcoR I and Pme I sites are underlined). The subsequent fragment was subcloned in the replicon resulting in the bicistronic construct. The NS2 deletion construct was made by two-part subclone. NS2 was deleted by insertion of the HCV genotype 2a IRES-p7 genes into a subgenomic replicon as stated above. The IRES-p7 region was PCR amplified by using the same EcoR I primer as above and 5′ ACC GTTTAAACTTA AGCATAAGCCTGTTGGGGCAATGCTAGGAGCAGTAGGCTA ( Pme I site underlined) which goes through p7. The resulting PCR fragment was cloned in the subgenomic replicon stated above. This resulted in the NS2 deletion virus in a bicistronic backbone. The TC-tagged core was introduced by digestion of the TC-core virus with EcoR I and BsiW I to liberate a DNA fragment containing TC-core through part of glycoprotein E1. Untagged core in the NS2 deletion backbone was replaced with the TC-core fragment using the corresponding EcoR I and BsiW I restriction sites. This resulted in a TC-core NS2 deletion (ΔNS2) construct. The resulting clone was sequenced to verify in frame insertion of the tag and presence of the deletion. Apolipoprotein E was PCR amplified from a human ORF clone, accession number EL733202 (Open Biosystems), using the primers 5′ AC GAATTC ATGAAGGTTCTGTGGGCTGC ( EcoR I site is underlined) and 5′ GT GGATCC C GTGATTGTCGCTGGGCAC ( Bam HI site is underlined, bold indicates a 1nt insertion). The PCR product was cloned into pEGFP-N2 at the EcoR I and Bam HI sites to create ApoE-GFP, and then confirmed by sequencing. Rab11A was PCR amplified from a human ORF clone, accession number CV027643 (Open Biosystems), using the primers 5′ ACC AAGCTT CGATGGGCACCCGCGACGACGAGTACGAC ( Hind III site is underlined) and 5′ ACC GGTACC TTAGATGTTCTGACAGCACTGCACCTT ( Kpn I site is underlined). The PCR product was cloned into pmGFP-C1, resulting in GFP-Rab11A and confirmed by sequencing. VAMP1 ORF was PCR amplified from a human ORF clone, accession number CV029376 (Open Biosystems), using the primers 5′ GC AGATCT ATGTCTGCTCCAGCTCAGCCACC ( Bgl II site is underlined) and 5′ GC AAGCTT TCAGCGATACTTACTTACAATAAC ( Hind III site is underlined). The resulting PCR product was cloned into pEGFP-C1 using the Bgl II and Hind III sites to result in GFP-VAMP1 and confirmed by sequencing. Viral replication curve and TCID50/mL WT, TC-core, bicistronic, and ΔNS2 RNAs were transcribed in vitro as described [52] . Huh-7.5 cells were electroporated with 2 µg/µl of each viral RNA and plated into 96 well plates. Viral supernatants were collected at indicated times post electroporation and titered by limiting dilution and immunohistochemical staining using an antibody directed to NS5A (9E10) as described [1] , [93] . For intracellular infectious virus, the cells went through three freeze-thaw cycles prior to titering. For RNA quantitation, cells were washed twice with PBS and lysed in RLT lysis buffer (Qiagen) at indicated timepoints. RNA was isolated using the RNAeasy kit (Qiagen). RNA copy number was determined by reverse transcriptase (RT) PCR analysis as described previously [43] , [44] using the Platinum qRT-PCR Thermoscript One-Step System (Applied Biosystems). 2 µL of extracted RNA was detected using the following primers and probe: forward 5′ ACTTCATTAGCGGCATCCAATAC ; reverse 5′-CGGCACTGAATGCCATCAT ; probe 5′-6FAM-CAGGATTGTCAACACTGCCAGGGAACC - (Iowa Black), amplifies from the NS4 gene. PCR conditions were 50°C for 30 minutes, 95°C for 6 minutes, and (95°C for 15 seconds followed by 60°C for 1 minute) x 50 cycles.
Show full methods section
Virus and cells
Huh-7.5 cells were grown in Dulbecco's modified high glucose media (DMEM; Invitrogen) supplemented with 10% fetal bovine serum (FBS; Invitrogen), nonessential amino acids (NEAA, 0.1 mM; Gibco), and 1% penicillin-streptomycin (Invitrogen). Viral RNA was electroporated into Huh-7.5 cells as described previously [43] , [44] . Viral supernatants were collected daily from up to 5 passages of electroporated cells, filtered through a .22 µm nitrocellulose filter, and kept at 4°C protected from light.
Plasmid constructs pJFHxJ6-CNS2C3
(WT) is a HCV genotype 2a infectious clone where core through the first transmembrane domain of NS2 of a JFH-1 backbone was replaced with J6 genotype sequence [91] . A full length (FLN CCPGCC MEP) tetracysteine (TC) tag [92] was inserted into the HCV core gene after amino acid 3 by amplifying two regions (5′ and 3′ of the tag) and joining the two regions with an ApaLI restriction site proximal to the tag insertion site. The full length TC tag has been shown to enhance binding of biarsenical dyes [92] . The 5′ region was amplified using 5′ AAC GAATTC TAATACGACTCACTATAGACC and 5′ AAC GTGCAC GGTCTACGAGACCTCCCGGGG ( EcoR I and ApaL I sites underlined). The 3′ region was amplified using 5′ AAC GTGCAC CATGAGCACA TTTCTCAATTGTTGTCCTGGCTGTTGTATGGAACCT AATCCTAAACCTCAAAGAAAAACC and 5′ AAC CGTACG CCAAGATCATGGTAGCCGTGG ( ApaL I and BsiW I sites underlined, TC tag bolded). The 5′ and 3′ regions were digested with ApaLI and ligated together to form the full-length core region with the tag inserted. The TC-core fragment was subsequently cloned into JFHxJ6NS23 using the EcoR I and BsiW I sites and the TC tag insertion was confirmed by sequencing. The bicistronic construct was constructed by insertion of a HCV genotype 2a IRES – NS2 fragment into a subgenomic replicon, pSGR-JFH1-neo, containing the encephalomyocarditis virus (EMCV) IRES through the HCV replicase genes NS3-NS5B [52] . The IRES-NS2 fragment was PCR amplified by using the primers 5′ACC GAATTC TAATACGACTCACTATAGACCTGCCCCTAATAG and 5′ ACC GTTTAAAC TTAAAGGAGCTTCCACCCCTTGGAGGTGTAGCCATCAGCTGG ( EcoR I and Pme I sites are underlined). The subsequent fragment was subcloned in the replicon resulting in the bicistronic construct. The NS2 deletion construct was made by two-part subclone. NS2 was deleted by insertion of the HCV genotype 2a IRES-p7 genes into a subgenomic replicon as stated above. The IRES-p7 region was PCR amplified by using the same EcoR I primer as above and 5′ ACC GTTTAAACTTA AGCATAAGCCTGTTGGGGCAATGCTAGGAGCAGTAGGCTA ( Pme I site underlined) which goes through p7. The resulting PCR fragment was cloned in the subgenomic replicon stated above. This resulted in the NS2 deletion virus in a bicistronic backbone. The TC-tagged core was introduced by digestion of the TC-core virus with EcoR I and BsiW I to liberate a DNA fragment containing TC-core through part of glycoprotein E1. Untagged core in the NS2 deletion backbone was replaced with the TC-core fragment using the corresponding EcoR I and BsiW I restriction sites. This resulted in a TC-core NS2 deletion (ΔNS2) construct. The resulting clone was sequenced to verify in frame insertion of the tag and presence of the deletion. Apolipoprotein E was PCR amplified from a human ORF clone, accession number EL733202 (Open Biosystems), using the primers 5′ AC GAATTC ATGAAGGTTCTGTGGGCTGC ( EcoR I site is underlined) and 5′ GT GGATCC C GTGATTGTCGCTGGGCAC ( Bam HI site is underlined, bold indicates a 1nt insertion). The PCR product was cloned into pEGFP-N2 at the EcoR I and Bam HI sites to create ApoE-GFP, and then confirmed by sequencing. Rab11A was PCR amplified from a human ORF clone, accession number CV027643 (Open Biosystems), using the primers 5′ ACC AAGCTT CGATGGGCACCCGCGACGACGAGTACGAC ( Hind III site is underlined) and 5′ ACC GGTACC TTAGATGTTCTGACAGCACTGCACCTT ( Kpn I site is underlined). The PCR product was cloned into pmGFP-C1, resulting in GFP-Rab11A and confirmed by sequencing. VAMP1 ORF was PCR amplified from a human ORF clone, accession number CV029376 (Open Biosystems), using the primers 5′ GC AGATCT ATGTCTGCTCCAGCTCAGCCACC ( Bgl II site is underlined) and 5′ GC AAGCTT TCAGCGATACTTACTTACAATAAC ( Hind III site is underlined). The resulting PCR product was cloned into pEGFP-C1 using the Bgl II and Hind III sites to result in GFP-VAMP1 and confirmed by sequencing. Viral replication curve and TCID50/mL WT, TC-core, bicistronic, and ΔNS2 RNAs were transcribed in vitro as described [52] . Huh-7.5 cells were electroporated with 2 µg/µl of each viral RNA and plated into 96 well plates. Viral supernatants were collected at indicated times post electroporation and titered by limiting dilution and immunohistochemical staining using an antibody directed to NS5A (9E10) as described [1] , [93] . For intracellular infectious virus, the cells went through three freeze-thaw cycles prior to titering. For RNA quantitation, cells were washed twice with PBS and lysed in RLT lysis buffer (Qiagen) at indicated timepoints. RNA was isolated using the RNAeasy kit (Qiagen). RNA copy number was determined by reverse transcriptase (RT) PCR analysis as described previously [43] , [44] using the Platinum qRT-PCR Thermoscript One-Step System (Applied Biosystems). 2 µL of extracted RNA was detected using the following primers and probe: forward 5′ ACTTCATTAGCGGCATCCAATAC ; reverse 5′-CGGCACTGAATGCCATCAT ; probe 5′-6FAM-CAGGATTGTCAACACTGCCAGGGAACC - (Iowa Black), amplifies from the NS4 gene. PCR conditions were 50°C for 30 minutes, 95°C for 6 minutes, and (95°C for 15 seconds followed by 60°C for 1 minute) x 50 cycles.
RNA interference assay
The siRNAs used are listed in Table S1 . The methods for the primary RNAi screen have been previously described [43] , [44] . Briefly, the primary screen included pools of four siRNAs that target 140 membrane trafficking genes (Dharmacon, Inc.). Genes important for infectious HCV production were subsequently silenced with four individual siRNAs targeting the gene to validate the RNAi results. 1×10 6 Huh-7.5 cells in 0.05 ml of PBS pH 7.4 were electroporated with 125 picomoles of siRNA for 5 pulses of 770 volts for 99 microseconds with one- second intervals on a BTX 830 electroporator with 96-well attachment. Cells were infected 72 hours after electroporation with a multiplicity of 0.5 infectious HCV particles per cell for 6 hours, rinsed with media, then maintained for 2 days at 37°C. 48 hours after infection, the supernatants were collected and analyzed for infectious virus via limiting titer dilution as described previously [93] . Host gene expression knockdown was assessed using the primer – probe sets listed in Table S2 . For visualization of core localization during silencing, cells were silenced with siRNAs followed by infection and immunofluorescence. Briefly, Huh-7.5 cells were electroporated (as above) with 2 pre-validated RAB11a siRNAs (Ambion, ID: s16073 and 14940), 2 pre-validated PIK4B siRNAs (Ambion, ID: 283 and s10543), or irrelevant siRNA and silencing was established for 48 hours. Electroporated cells were infected with HCV then maintained for 2 days, followed by seeding onto coverslips, fixation, and immunofluorescence staining. Immunofluorescence HCV TC-core infected cells stained with biarsenical dye were fixed in 4% paraformaldehyde for 10 min, permeabilized in 0.2% Triton X-100 in PBS for 20 minutes, and blocked with 0.1% Tween-20 and 10% goat serum in PBS for 30 min. Cell were washed with PBS plus 0.1% Tween-20 (PBST) after blocking and between antibody incubations. Primary and secondary antibodies were diluted in PBST. For detection of core, a mouse monoclonal antibody (#1851 Virostat, Portland, ME) was used at a dilution of 1∶50, mouse monoclonal antibody to NS5A (9E10) was used at a dilution of 1∶1000, dsRNA antibody (J2, English and Scientific Consulting Bt) was used at 1∶1000, and a human monoclonal antibody to E2 (Steve Foung) was used at 1∶250. GFP fusion proteins were assessed for correct localization by incubation with antibodies. Anti-Apolipoprotein E (Abcam) was used at a dilution of 1∶250, anti-Vamp1 (Abcam) was used at a dilution of 1∶250, anti-Rab11a (Invitrogen) was used at a dilution of 1∶250, anti-GM130 (Abcam) was used at 1∶250 to label the Golgi network, and anti-ApoB was used at a dilution of 1∶250. Alexa-488 or Alexa-594 conjugated IgG (Molecular Probes, Eugene, OR) secondary antibodies were diluted 1∶1000. Golgi-GFP (Invitrogen) was used to label the TGN by the recommended directions. Bodipy 493/503 was used to label neutral lipids (lipid droplets) in both fixed and live cell images at a concentration of 20 µg/ml.
Biarsenical dye labeling of HCV expressing cells
FlAsH or ReAsH labeling was performed per the instructions provided in the TC-tag detection kit (Invitrogen). At 72 hours post electroporation, cells were washed once with Opti-MEM (Invitrogen) and labeled with biarsenical dye (1.25 µM) in Opti-MEM. Cells were incubated at 37°C for 30 minutes, then washed two times with 1X BAL (2,3-dimercapto-1-propanol) wash buffer (supplied in the kit, Invitrogen) supplemented with 500 µM EDT in Opti-MEM for 5 minutes. The wash buffer was removed and the cells were washed one time using Opti-MEM followed by incubation with prewarmed media. Tracking of TC-core in the presence of drug inhibitors of the secretory pathway was performed as follows: TC-core electroporated cells were incubated with DMSO, GolgiPlug containing BFA (1 µg/mL, BD Biosciences), or PIK93 (0.5 µM, Tocris) for 2 hours prior to staining with ReAsh. DMSO or drug was present during time of staining and in the imaging media.
RNA labeling
Infected cells were incubated with Click-iT RNA Alexa Fluor 488 Imaging Kit (Invitrogen) to visualize RNA. Briefly, infected cells were seeded on round coverslips and incubated with Click-iT kit as per manufacturer's instructions in the presence of actinomycin D (1 µg/ml). Cells were processed for immunofluoresence after Click-iT labeling.
Fluorescence microscopy
All images were acquired with an Olympus DSU spinning disk confocal microscope fitted with a 100×1.45 N.A oil-immersion objective. FlAsH labeled core was detected using the EGFP filter set (ex: 480/25 and em: 525/40), whereas ReAsH labeled core was visualized with the DsRed filter set (ex: 565/25 and em: 620/60) coupled to a Hamamatsu back-thinned EM-CCD high speed/sensitivity camera. Slidebook software was used for image acquisition and processing (Intelligent Imaging Innovations, Inc, Denver, CO). Immunofluorescence imaging of TC-core with viral or host markers was accomplished by acquiring sequential static images with DsRed, EGFP, and 350 filter set sequential exposures.
Live cell imaging of TC tagged
HCV was performed by growing infected cells on polylysine treated 35 mm glass bottom Fluorodishes (World Precision Instruments). Cells were stained with biarsenical dye as above except imaging media (DMEM-F12- Invitrogen) supplemented with 10% fetal bovine serum, 0.1 mM nonessential amino acids, 1% penicillin-streptomycin, and 25 mM HEPES was added following the final wash. Imaging chambers were sealed with parafilm before imaging. Cells were maintained on a heated stage set at 37°C. Timelapse imaging of TC-core particles and GFP labeled host proteins was taken by sequential imaging every 2 seconds with 200 ms exposures for each channel, DsRed and GFP respectively. In some cases cells were incubated with transferrin-488 (5 µg/mL, Invitrogen) or phrododextran (10 µg/mL, Invitrogen) prior to imaging as per manufacturer's instructions. Individual core puncta transport velocities and run lengths were calculated by kymograph analysis. Briefly, the multiple kymograph plugin for ImageJ was used to generate kymographs. Runs were defined as uninterrupted diagonal lines and the distance traveled (length) and the average velocity (slope) were measured. The frequency of TC-core puncta movement was measured by quantifying the number of TC-core puncta displaying a run length greater than 1 µm as a percentage of total cellular TC-core puncta signal using the analyze particles tool in ImageJ per imaging session. Distance from origin plots were generated by using the Manual Tracking plugin for Image J, measuring the distance traveled (in any direction) between frames for a respective TC-core puncta. Values were added and plotted against time. Manual Tracking plugin was also used to generate the distance versus time plots. Distance between timepoints was plotted versus time.
Statistical analysis
Prism software was used to plot and determine p-values for replication and TCID50/mL titer curves. The velocity and run length plots were also done using Prism software where the data was modeled to a Gaussian distribution or a decaying exponential.
Supporting Information Figure S1 Cell viability following electroporation with the indicated siRNAs. Viability of siRNA-treated cells was measured at 5 days post electroporation in two distinct experiments (A) and (B) by a luminescence-based assay (Promega) that measures intracellular ATP levels. SEM is shown. (TIF) Click here for additional data file. Figure S2 Intra- and extra-cellular infectious virus following siRNA treatment. Relative levels of intra-and extra-cellular infectious virus levels from Table 1 . (TIF) Click here for additional data file. Figure S3 Biarsenical dyes do not affect virus release. Huh-7.5 cells were infected with wildtype virus for 48 hours then incubated with ReAsh dye for 30 minutes. ReAsh dye was removed and cells were washed with 1x BAL buffer supplemented with 500 µM EDT. Cells were incubated in fresh media and supernatants were collect at 2, 8, 24, 48 hours post ReAsh incubation and titered. (TIF) Click here for additional data file. Figure S4 Immunofluorescence of GFP fusions of ApoE, Vamp1, and Rab11a. Huh7.5 cells were transfected with ApoE-GFP, GFP-Vamp1, or GFP-Rab11a. Cells were fixed and processed for immunofluorescence using antibodies directed against ApoE (top), Rab11a (middle), GM130 (middle bottom) or Vamp1 (bottom) and corresponding secondary antibodies (red). Scale bar is 10 µm. (TIF) Click here for additional data file. Figure S5 TC-core cotransports with ApoE-GFP. Huh-7.5 cells were electroporated with TC-core RNA and transfected with ApoE-GFP at 48 hpe. Cells were stained with ReAsh (red) at 72 hpe then imaged. Boxed region contains TC-core puncta shown in montage in Figure 9A and as a Video S7 . Line indicates trajectory of moving particle. Scale bar = 10 µm. (TIF) Click here for additional data file. Figure S6 ApoB does not colocalize with TC-core puncta. Huh7.5 cells were infected with TC-core virus and stained with ReAsh dye (red) at 72 hours post infection followed by processing for immunofluorescence using an ApoB antibody (green). Scale bar is 10 µm. (TIF) Click here for additional data file. Figure S7 TC-core cotransports with GFP-Rab11a. Huh-7.5 cells were electroporated with TC-core RNA and transfected with GFP-Rab11a at 48 hpe. Cells were stained with ReAsh (red) at 72 hpe then imaged. Boxed region contains TC-core puncta shown in montage in Figure 9B and as a Video S8 . Line indicates trajectory of moving particle. Scale bar = 10 µm. (TIF) Click here for additional data file. Figure S8 TC-core cotransports with Alexa Fluor 488 transferrin. Huh-7.5 cells were electroporated with TC-core RNA and stained with ReAsh (red) at 72 hpe then incubated with Alexa Fluor 488 transferrin (green). Cells were immediately imaged. Boxed region contains TC-core puncta shown in montage in Figure 9C and as a Video S9 . Line indicates trajectory of moving particle. Scale bar = 10 µm. (TIF) Click here for additional data file. Figure S9 TC-core cotransports with GFP-VAMP1. Huh-7.5 cells were electroporated with TC-core RNA and transfected with GFP-VAMP1 at 48 hpe. Cells were stained with ReAsh (red) at 72 hpe then imaged. Boxed region contains TC-core puncta shown in montage in Figure 9D and as a Video S10 . Line indicates trajectory of moving particle. Scale bar = 10 µm. (TIF) Click here for additional data file. Figure S10 TC-core cotransports with dextran. Huh-7.5 cells were electroporated with TC-core RNA and stained with FlAsh (green) at 72 hpe then incubated with dextran (red). Cells were immediately imaged. Boxed region contains TC-core puncta shown in montage in Figure 9E and as a Video S11 . Line indicates trajectory of moving particle. Scale bar = 10 µm. (TIF) Click here for additional data file. Figure S11 TC-core produced in infected cells co-transports with host secretory pathway components. Huh-7.5 cells were infected with TC-core virus followed by transfection with either ApoE-GFP (A), GFP-Rab11a (B), or GFP-Vamp1 (C) plasmids at 24 hours post infection (hpi). Cells were incubated with ReAsh at 72hpi followed by live cell confocal microscopy. Shown are time-lapse montages of alternating DsRed (200ms) and EGFP (200ms) exposures taken every 2 seconds for several minutes. Kymographs are shown to the right of each montage. (TIF) Click here for additional data file. Figure S12 ApoE-TC-core colocalization at core accumulations. Huh-7.5 cells were electroporated with TC-core RNA and transfected with ApoE-GFP at 48 hours post electroporation. Shown is ApoE (green) and TC-core (red) colocalization at a crescent shaped core accumulation (inset), presumably at a lipid droplet. Scale bar 10 µm. (TIF) Click here for additional data file. Figure S13 Vamp-1 and ApoE vesicle dynamics. Huh-7.5 cells were transfected with ApoE-GFP or GFP-VAMP1 constructs. 200ms GFP exposures were taken by confocal microscopy every 2 seconds. Single GFP puncta were tracked using the manual tracking plugin for Image J. Plotted are average (A) velocity (µm/sec) and (B) run length (µm). Overall, 16 VAMP1-GFP vesicles (59 total runs) and 15 ApoE-GFP vesicles (90 total runs) were tracked. Error bars indicate standard error of the mean. (TIF) Click here for additional data file. Table S1 Genes and siRNAs tested in the RNA interference screen. (DOC) Click here for additional data file. Table S2 Real time RT-PCR assays for quantifying host gene RNA levels. (DOC) Click here for additional data file. Video S1 Dynamics of TC-core puncta. Snapshot of this Video is shown in Figure 2C . Playback time is 10x real speed. (AVI) Click here for additional data file. Video S2 TC-core dynamics. Montage of single TC-core puncta transport shown in Figure 4A . Playback time is 10x real speed. (AVI) Click here for additional data file. Video S3 TC-core dynamics in bicistronic background. Montage of single TC-core puncta transport shown in Figure 4A . Playback time is 10x real speed. (AVI) Click here for additional data file. Video S4 TC-core dynamics in ΔNS2 background. Montage of single TC-core puncta transport shown in Figure 4A . Playback time is 10x real speed. (AVI) Click here for additional data file. Video S5 TC-core dynamics and microtubules stained with Tubulin Tracker green. Shown as montage in Figure 7A . Playback time is 10x real speed. (AVI) Click here for additional data file. Video S6 TC-core dynamics in the presence of nocodazole. Shown as a montage in Figure 7B . (AVI) Click here for additional data file. Video S7 TC-core traffics with ApoE-GFP. Shown as a montage in Figure 9A . Snapshot of whole cell shown in Figure S2 . (AVI) Click here for additional data file. Video S8 TC-core traffics with GFP-Rab11a. Shown as a montage in Figure 9B . Snapshot of whole cell shown in Figure S3 . (AVI) Click here for additional data file. Video S9 TC-core traffics with Alexa Fluor 488 transferrin. Shown as a montage in Figure 9C . Snapshot of whole cell shown in Figure S4 . (AVI) Click here for additional data file. Video S10 TC-core traffics with GFP-VAMP1. Shown as a montage in Figure 9D . Snapshot of whole cell shown in Figure S5 . (AVI) Click here for additional data file. Video S11 TC-core traffics with dextran. Shown as a montage in Figure 9E . Snapshot of whole cell shown in Figure S6 . (AVI) Click here for additional data file. Video S12 TC-core traffics with Ribogreen labeled RNA. Shown as montage in Figure 2D . (MOV) Click here for additional data file. Video S13 TC-core in infected cells traffics with ApoE-GFP. Shown as a montage in S11. (AVI) Click here for additional data file. Video S14 TC-core in infected cells traffics with GFP-Rab11a. Shown as a montage in S11. (MOV) Click here for additional data file. Video S15 TC-core in infected cells traffics with GFP-Vamp1. Shown as a montage in S11. (MOV) Click here for additional data file.
📊 Figures
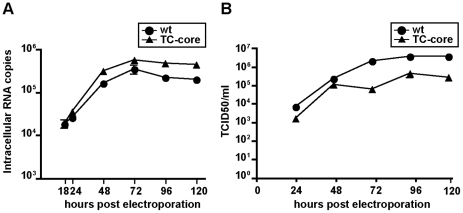
Figure 1
Characterization of tetracysteine (TC) tag insertion in core.
A. Replication data for WT (J6/JFH1) and TC-core viruses. Time points indicated. Error bar, standard deviation. B. Titer data for WT and TC-core viruses. Viral supernatants were collected at indicated...
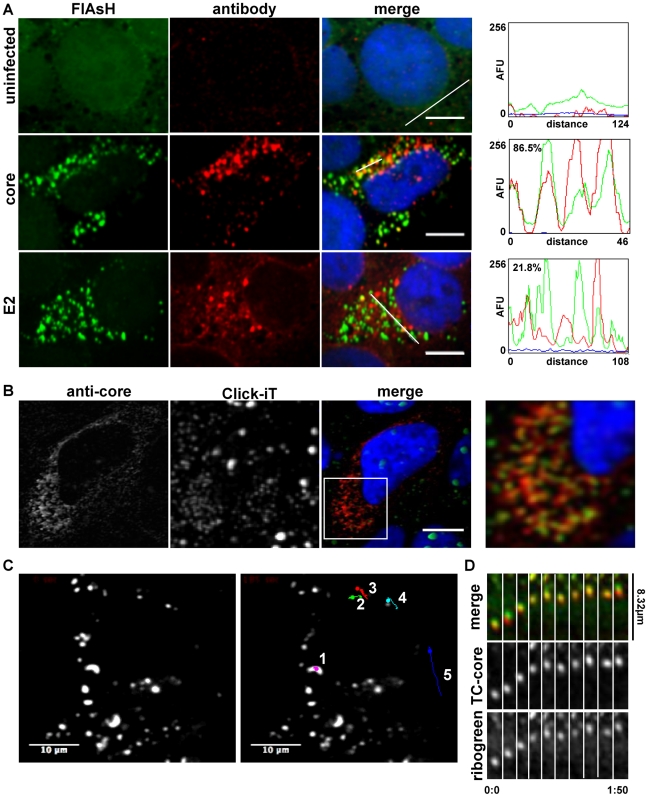
Figure 2
Characterization of TC-core puncta.
A. Huh-7.5 cells were electroporated with TC-core RNA. At 72 hours post electroporation (hpe), cells were stained with FlAsH (1.25 u00b5M, green) then fixed and stained for immunofluorescence using an...
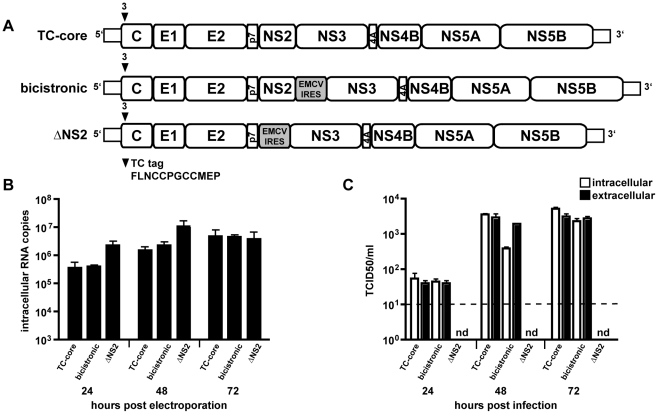
Figure 3
Construction and characterization of assembly mutants in TC-core background.
A. Drawing indicating insertion site of TC-tag into core after amino acid 3. Shown are the TC-core, bicistronic, and NS2 deletion (u0394NS2) viruses. B. Replication data for TC-core, bicistronic, and ...
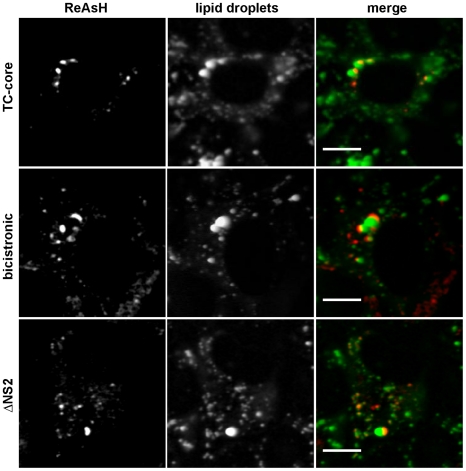
Figure 4
TC-core localizes to lipid droplets.
Huh-7.5 cells electroporated with TC-core, bicistronic, or u0394NS2 RNAs were stained with ReAsH dye (red) at 72 hours post electroporation and incubated with Bodipy-493/503 (green) to label lipid dro...
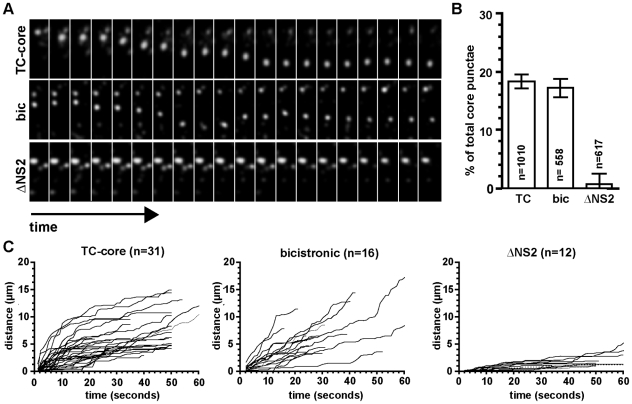
Figure 5
Dynamic TC-core movements require HCV assembly.
Huh-7.5 cells were electroporated with TC-core, bicistronic, or u0394NS2 RNAs. Electroporated cells were stained at 72 hours post electroporation with the biarsenical dye ReAsH and imaged using timela...
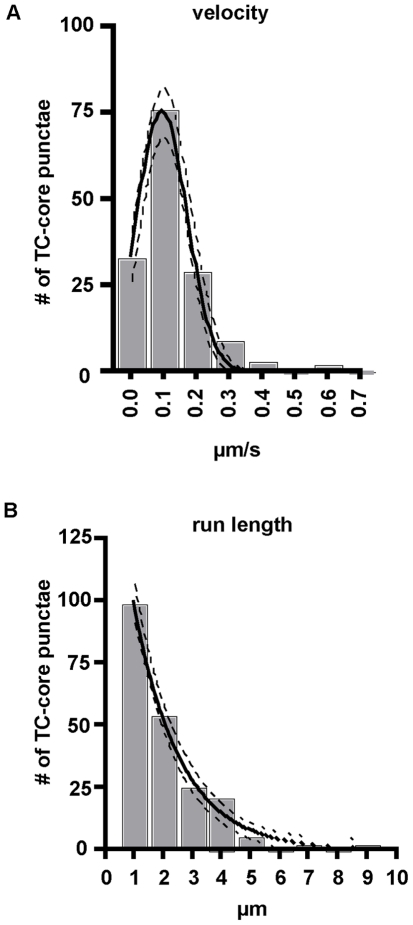
Figure 6
TC-core transport kinetics.
Huh7.5 cells were electroporated with TC-core RNA and stained with ReAsH dye at 72 hours post electroporation. Infected cells were imaged by acquiring 200ms exposures every 2 seconds for several minut...
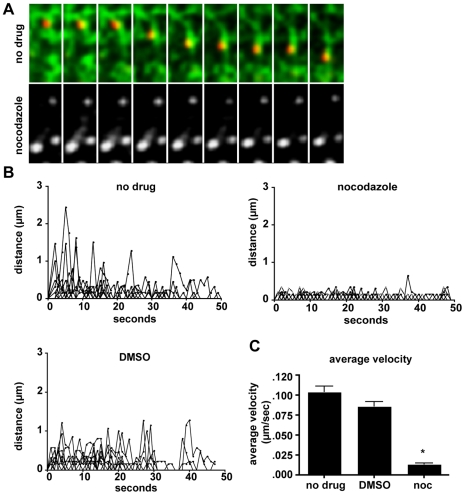
Figure 7
Movement of TC-core is microtubule dependent.
Huh-7.5 cells were electroporated with TC-core HCV RNA and at 72 hpe stained with ReAsH (red) followed by incubation with 200 nM TubulinTracker Green. Images were acquired by taking alternating 200 ms...
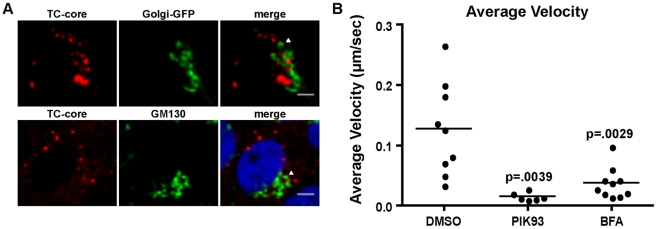
Figure 8
Localization of TC-core and markers of the TGN.
A. Huh-7.5 cells were electroporated with TC-core RNA and at 72 hours post infection cells were stained with ReAsH dye. Top panel: Cells were transduced with Golgi-GFP at 48 hours post electroporation...
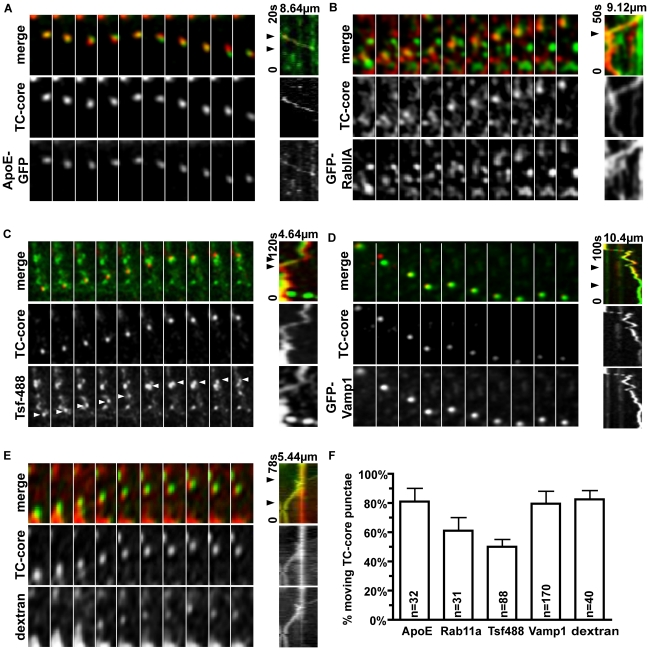
Figure 9
TC-core HCV co-transports with host secretory pathway components.
Huh-7.5 cells were electroporated with TC-core RNA followed by transfection at 48 hours post electroporation with either ApoE-GFP (A), GFP-Rab11A (B), or GFP-VAMP1 (D) then ReAsH (red) stained at 72hp...
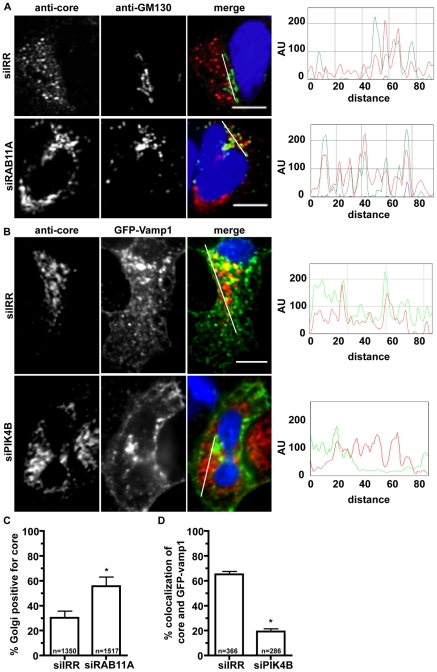
Figure 10
siRNA treatments inhibiting infectious virus production alter core sub-cellular localization.
A. Huh7.5 cells were electroporated with irrelevant (siIRR) or Rab11a (siRab11a) siRNAs followed by infection with HCV at 48 hours post electroporation. Cells were fixed and stained with Golgi marker ...
Figure images are served from the NIH/NLM PubMed Central Open Access Subset or Europe PMC; copyright remains with the publishers and authors.
💬 Discussion
0 commentsNo comments yet. Be the first to start a discussion!
Leave a Comment