Abstract
Transient receptor potential vanilloid 2 (TRPV2) plays a critical role in neuronal development, cardiac function, immunity, and cancer. Cannabidiol (CBD), the non-psychotropic therapeutically active ingredient of Cannabis sativa, is an activator of TRPV2 and also modulates other transient receptor potential (TRP) channels. Here, we determined structures of the full-length rat TRPV2 channel in apo and CBD-bound states in nanodiscs by cryo-electron microscopy. We show that CBD interacts with TRPV2 through a hydrophobic pocket located between S5 and S6 helices of adjacent subunits, which differs from known ligand and lipid binding sites in other TRP channels. CBD-bound TRPV2 structures revealed that the S4-S5 linker plays a critical role in channel gating upon CBD binding. Additionally, nanodiscs permitted us to visualize two distinct TRPV2 apo states in a lipid environment. Together these results provide a foundation to further understand TRPV channel gating, their divergent physiological functions, and to accelerate structure-based drug design.
🔬 Techniques
🔭 Microscopes
💻 Software
✨ Fluorophores
🧪 Sample Preparation
🔬 Cell Lines
🏭 Microscope Brands
🧪 Reagent Suppliers
📷 Detectors
💻 Software Details
💾 Data Repositories
🏷️ Research Resource Identifiers (RRIDs)
Verified research resources used in this paper:
🏛️ Research Organizations (ROR)
Affiliated research institutions:
📋 Methods
Protein expression and purification
The nanodisc reconstituted full-length rat TRPV2 was expressed and purified as previously published ( Huynh et al., 2016 ), with minor modifications. The membranes expressing rat TRPV2 were solubilized in 20 mM HEPES pH 8.0, 150 mM NaCl, 5% glycerol, 0.087% LMNG, 2 mM TCEP, and 1 mM PMSF for 1 hr. Insoluble material was removed via ultra-centrifugation at 100,000 x g and the solubilized TRPV2 was purified by binding to 1D4 antibody coupled CnBr-activated Sepharose beads. The beads were washed with Wash Buffer containing 0.006% DMNG and the protein was eluted with Wash Buffer containing 0.006% DMNG and 3 mg/ml 1D4 peptide. The protein was then reconstituted into nanodiscs in a 1:1:200 ratio of TRPV2:MSP2N2:soy polar lipids (Avanti). MSP2N2 was expressed in BL21 (DE3) cells and purified via affinity chromatography as previously described ( Hughes et al., 2018b ). Lipids were dried under a nitrogen flow prior to reconstitution and resuspended in Wash Buffer containing DMNG in a 1:2.5 ratio (soy polar lipids:DMNG). The nanodisc reconstitution mixture was incubated at 4°C for 30 mins. Bio-Beads (Bio-Beads SM-2 Absorbent Media, Bio-Rad) were added to the reconstitution mixture for 1 hr then the reaction mixture was transferred to fresh Bio-Beads and the mixture was incubated overnight. Nanodisc reconstituted TRPV2 was further purified using size-exclusion chromatography (Superose 6, GE Healthcare) in Wash Buffer. Protein eluted from the column was concentrated to 2 mg/mL for use in vitrification.
Show full methods section
Protein expression and purification
The nanodisc reconstituted full-length rat TRPV2 was expressed and purified as previously published ( Huynh et al., 2016 ), with minor modifications. The membranes expressing rat TRPV2 were solubilized in 20 mM HEPES pH 8.0, 150 mM NaCl, 5% glycerol, 0.087% LMNG, 2 mM TCEP, and 1 mM PMSF for 1 hr. Insoluble material was removed via ultra-centrifugation at 100,000 x g and the solubilized TRPV2 was purified by binding to 1D4 antibody coupled CnBr-activated Sepharose beads. The beads were washed with Wash Buffer containing 0.006% DMNG and the protein was eluted with Wash Buffer containing 0.006% DMNG and 3 mg/ml 1D4 peptide. The protein was then reconstituted into nanodiscs in a 1:1:200 ratio of TRPV2:MSP2N2:soy polar lipids (Avanti). MSP2N2 was expressed in BL21 (DE3) cells and purified via affinity chromatography as previously described ( Hughes et al., 2018b ). Lipids were dried under a nitrogen flow prior to reconstitution and resuspended in Wash Buffer containing DMNG in a 1:2.5 ratio (soy polar lipids:DMNG). The nanodisc reconstitution mixture was incubated at 4°C for 30 mins. Bio-Beads (Bio-Beads SM-2 Absorbent Media, Bio-Rad) were added to the reconstitution mixture for 1 hr then the reaction mixture was transferred to fresh Bio-Beads and the mixture was incubated overnight. Nanodisc reconstituted TRPV2 was further purified using size-exclusion chromatography (Superose 6, GE Healthcare) in Wash Buffer. Protein eluted from the column was concentrated to 2 mg/mL for use in vitrification.
Cryo-EM data collection
For apo TRPV2, fluorinated Fos-choline eight was added to the sample to a final concentration of 3 mM just before blotting. This sample was double blotted (3.5 µl per blot) onto glow discharged 200 mesh Quantifoil 1.2/1.3 grids (Quantifoil Micro Tools) at 4°C and 100% humidity and plunge frozen in liquid ethane cooled to the temperature of liquid nitrogen (Thermo Fisher Vitrobot). Cryo-EM images were collected using a 300kV Thermo Fisher Krios microscope equipped with a Gatan K3 direct detector camera in super resolution mode. 40 frame movies were collected with a total dose of 50 e/Å 2 and a super resolution pixel size of 0.53 Å/pix. Defocus values of the images range from −0.8 to −3.0 µm. For CBD-bound TRPV2, prior to preparing cryo-EM grids purified TRPV2 was incubated with 30 µM CBD for 30 mins. Fluorinated Fos-choline eight was added to the sample to a final concentration of 3 mM just before blotting. This sample was blotted (3 µl per blot) onto glow discharged 200 mesh Quantifoil 1.2/1.3 grids (Quantifoil Micro Tools) at 4°C and 100% humidity and plunge frozen in liquid ethane cooled to the temperature of liquid nitrogen (Thermo Fisher Vitrobot). Cryo-EM images were collected using a 300kV Thermo Fisher Krios microscope equipped with a Gatan K3 direct detector camera in counting mode. 40 frame movies were collected with a total dose of 50 e/Å 2 and a pixel size of 1.06 Å/pix. Defocus values of the images range from −0.8 to −3.0 µm.
Image processing
For both datasets, all data processing was conducted in RELION 3.0 ( Scheres, 2012 ; Scheres, 2016 ; Zivanov et al., 2018 ). The movie frames were aligned using MotionCor2 ( Zheng et al., 2017 ), with the apo dataset being binned by two to a pixel size of 1.06 Å/pix, to compensate for beam-induced motion. Defocus values of the motion corrected micrographs were estimated using Gctf ( Zhang, 2016 ). At this point, suboptimal micrographs were removed from each dataset based on manual inspection and statistics generated by Gctf. Initially, a subset of 100 micrographs were picked from each with Laplacian-of-Gain auto-picking, which yielded on the order of 10 s of thousands of particles for each dataset. Each set of particles were subsequently sorted into 2D classes to generate templates for standard auto-picking for each dataset. For the apo dataset, auto-picking of 10,548 micrographs resulted in ~1.2 million auto-picked particles, for the CBD-bound dataset, auto-picking of 5024 micrographs resulted in ~2.3 million auto-picked particles. These were then subjected to 2D classification to remove suboptimal particles and false positive hits. The best 596,859 particles from the apo and 710,728 from the CBD-bound dataset were refined without applied symmetry. The initial model for these refinements was created from the density map of the previously published full length TRPV2 ( Huynh et al., 2016 ) (EMB-6580) filtered to 60 Å. These initially refined particles were then subjected to 3D classification into eight classes without angular sampling and no applied symmetry, using a soft mask made from the initial 3D refinement. For both datasets, this classification yielded a single, clear best class with good TRP channel features. The best classes from the apo dataset had 117, 582 particles and from the CBD-bound dataset had 153,464 particles. Each set of particles were refined with no applied symmetry and tested for symmetry using the Map Symmetry tool in PHENIX ( Adams et al., 2002 ), which assigned C4 symmetry to both maps. These particles were then refined again with C4 symmetry before being subjected to CTF refinement, Bayesian polishing, and an additional round of 2D classification to further remove noise. After this treatment, the apo dataset had 96,161 polished particles and the CBD-bound dataset had 125,038 polished particles. Each set of particles was then refined with C4 symmetry followed by 3D classification without angular sampling into five classes for the apo dataset and six classes for the CBD-bound dataset, using a mask of the full TRP channel but excluding density for the nanodisc. Sorting for both datasets yielded three best classes, and in both datasets two of those classes were sufficiently similar to combine. This resulted in two final sets of particles for each dataset, 42,407 (TRPV2 APO_1 ) and 14,332 (TRPV2 APO_2 ) for the apo dataset and 23,944 (TRPV2 CBD_1 ) and 36,153 (TRPV2 CBD_2 ) for the CBD-bound dataset. Each of these sets of particles was again subjected to CTF refinement and Bayesian polishing before a final refinement with C4 symmetry, followed by post-processing using a mask of the channel that excluded the nanodisc cloud yielding maps at 3.7 Å (TRPV2 APO_1) , 4.0 Å (TRPV2 APO_2 ), 3.4 Å (TRPV2 CBD_1 ) and 3.2 Å (TRPV2 CBD_2 ). Local resolution maps were generated using the RELION ( Zivanov et al., 2018 ; Scheres, 2016 ; Scheres, 2012 ) implementation of local resolution estimation. Model building The previously determined full-length rat TRPV2 structure (PDB: 5HI9) was employed as the initial starting model and docked into the TRPV2 APO_1 map. This model was then manually adjusted in COOT ( Emsley and Cowtan, 2004 ) and refined using phenix.real_space_refine from the PHENIX software package ( Adams et al., 2002 ) with four-fold NCS constraints. The model was subjected to iterative rounds of manual model fitting followed by real-space refinement and sidechains with insufficient density were removed. The disconnected 16 residue loop attributed to Gln30-Asn45 between the ARDs and the β-sheet region in the TRPV2 APO_1 model was initially built as alanines, with residue identities determined based on distinctive density for Met35 and Phe39 along with kinking of the backbone that could be traced to a distinctive pattern of three proline residues at the N-terminus of the protein. Models fit into the other three maps started from the final APO_1 model, followed by the same process of manual adjustment and refinement. The ligand restraint file for CBD was generated using the eLBOW tool from the PHENIX software package ( Moriarty et al., 2009 ). Each final model was randomized by 0.5 Å in PHENIX ( Adams et al., 2002 ) and refined against a single half map. These models were converted into volumes in Chimera ( Pettersen et al., 2004 ) and then EMAN2 ( Ludtke et al., 1999 ) was used to generate FSC curves between these models and each half map as well as between each final model and the final maps. HOLE was used to generate the pore radii ( Smart et al., 1996 ). Pymol and Chimera ( Pettersen et al., 2004 ) were used to align models and maps and to make figures. HEK293 cell culture, mutagenesis and transfection Human Embryonic Kidney 293T (HEK293T) cells were purchased from American Type Culture Collection (ATCC), Manassas, VA, (catalogue # CRL-3216), RRID: CVCL_0063 and tested regularly for mycoplasma contamination. Passage number of the cells was monitored, and cells were used up to passage number 25–30. The cells were maintained in Dulbecco’s Modified Eagle’s Medium (DMEM) (ATCC, catalogue # 30–2002) supplemented with 10% (v/v) fetal bovine serum (FBS), GlutaMAX-I (Gibco, catalogue # 35050), 100 IU/ml penicillin and 100 μg/ml streptomycin and were kept in a tissue-culture incubator with 5% CO 2 at 37°C. The cells were transiently transfected with cDNA encoding the rat TRPV2 (rTRPV2-WT, Leu541F-L631Phe or Val635Phe mutant), in the pcDNA3 vector and pEYFP in ratio 1:0.1 using the Effectene reagent (Qiagen) according manufacturer’s protocol and used in experiments 48–72 hr later. Point mutations were introduced using the QuickChange Mutagenesis Kit (Agilent).
TRPV2 channel electrophysiology
Whole-cell patch clamp measurements were performed as described earlier ( Badheka et al., 2015 ). Measurements were carried out on YFP positive cells, in an extracellular solution containing (in mM) 137 NaCl, 5 KCl, 1 MgCl 2 , 10 HEPES and 10 glucose, pH 7.4. The intracellular solution contained (in mM) 135 Cs-Metanesulfonate, 1 MgCl 2 , 10 HEPES, 5 EGTA, 4 NaATP (pH 7.25). Patch clamp pipettes were prepared from borosilicate glass capillaries (Sutter Instruments) using a P-97 pipette puller (Sutter Instrument) and had a resistance of 4–6 MΩ. In all experiments after formation of gigaohm-resistance seals, the whole-cell configuration was established and currents were recorded using a ramp protocol from −100 mV to +100 mV over 500 ms preceded by a −100 mV step for 200 ms; the holding potential was −60 mV, and this protocol was applied once every 2 s. The currents were measured with an Axopatch 200B amplifier, filtered at 5 kHz, and digitized through the Digidata 1440A interface. In all experiments, cells that had a passive leak current more than 100 pA were discarded. Data were collected and analyzed with the PClamp10.6 (Clampex) acquisition software (Molecular Devices, Sunnyvale, CA), and further analyzed and plotted with Origin 8.0 (Microcal Software Inc, Northampton, MA, USA).
Data availability
The cryo-EM density maps and the atomic coordinates of the apo and both CBD-bound full-length TRPV2 channels in nanodiscs are deposited into the Electron Microscopy Data Bank and Protein Data Bank under accession codes EMD-20677 and PDB 6U84 (TRPV2 APO_1 ), EMD-20678 and PDB 6U86 (TRPV2 APO_2 ), EMD-20686 and PDB 6U8A (TRPV2 CBD_1 ), and EMD-20682 and PDB 6U88 (TRPV2 CBD_2 ).
Additional files 10.7554/eLife.48792.026 Transparent reporting form
📊 Figures
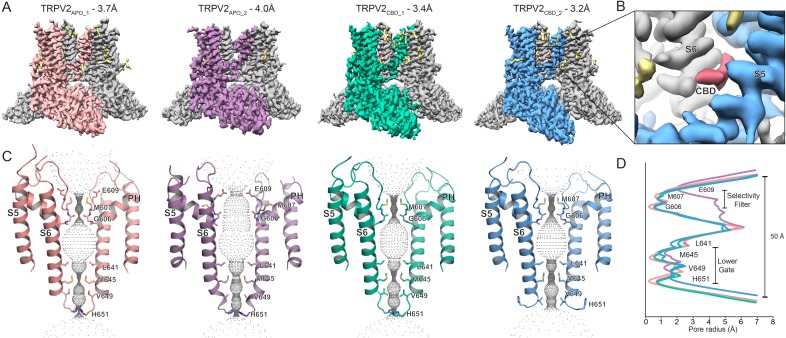
Figure 1.
Overview of the full-length rat TRPV2 channel structures in nanodiscs.
( A ) Three-dimensional cryo-EM reconstructions for TRPV2 APO_1 at 3.7 u00c5 (salmon), TRPV2 APO_2 at 4.0 u00c5 (purple), TRPV2 CBD_1 at 3.4 u00c5 (green), TRPV2 CBD_2 at 3.2 u00c5 (blue); ( B ) CBD b...
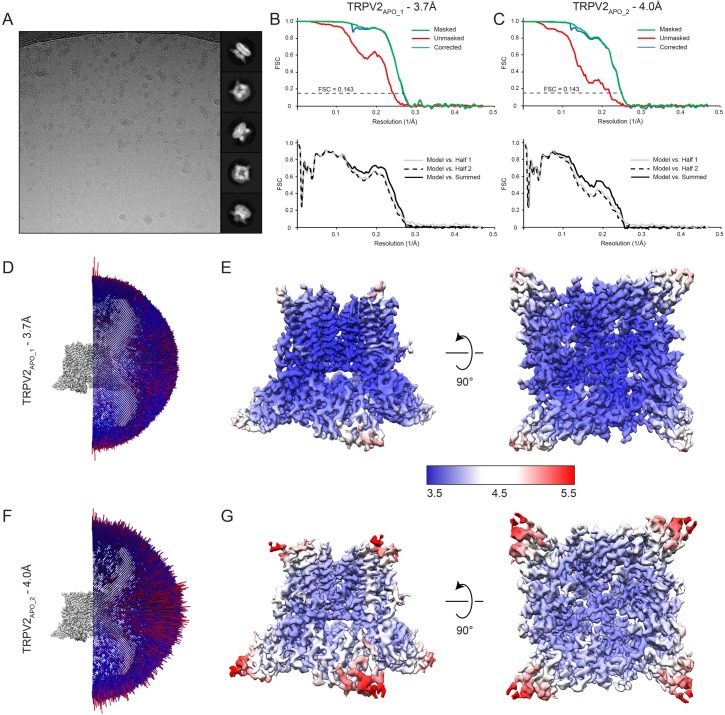
Figure 1u2014figure supplement 1.
EM summary of apo full-length rat TRPV2 in nanodiscs.
( A ) Representative micrograph and 2D classes of cryo-EM data. Map FSC curves and model validation curves for ( B ) TRPV2 APO_1 and ( C ) TRPV2 APO_2 . Angular distribution for the final 3D reconstru...
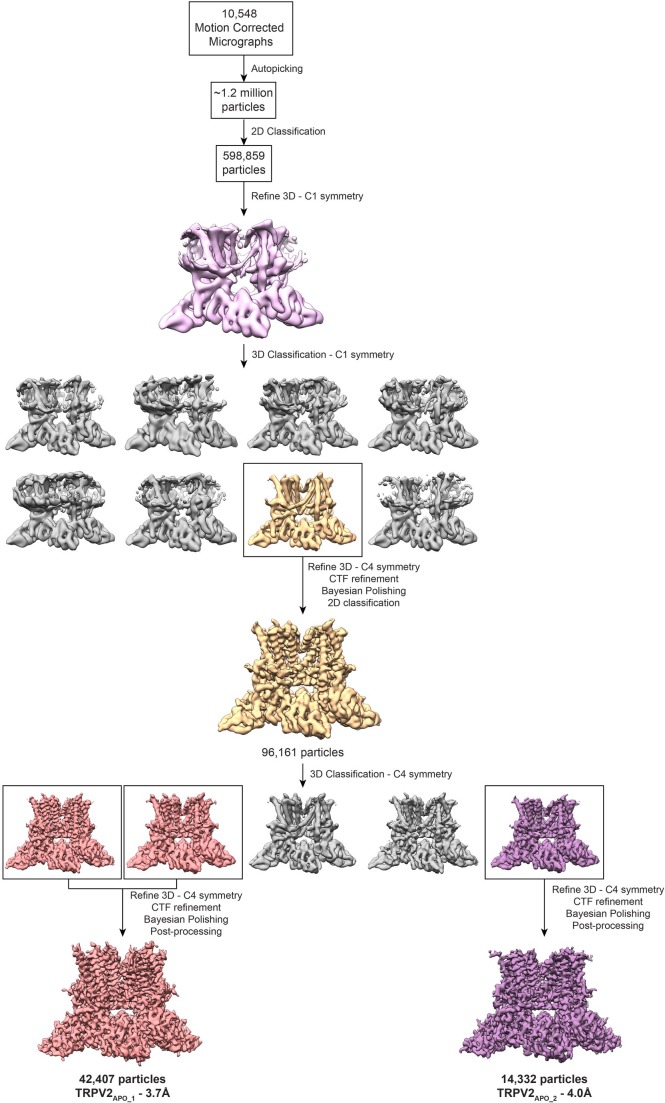
Figure 1u2014figure supplement 2.
Apo TRPV2 cryo-EM data processing.
Workflow for 3D reconstruction resulting in two distinct apo TRPV2 structures.
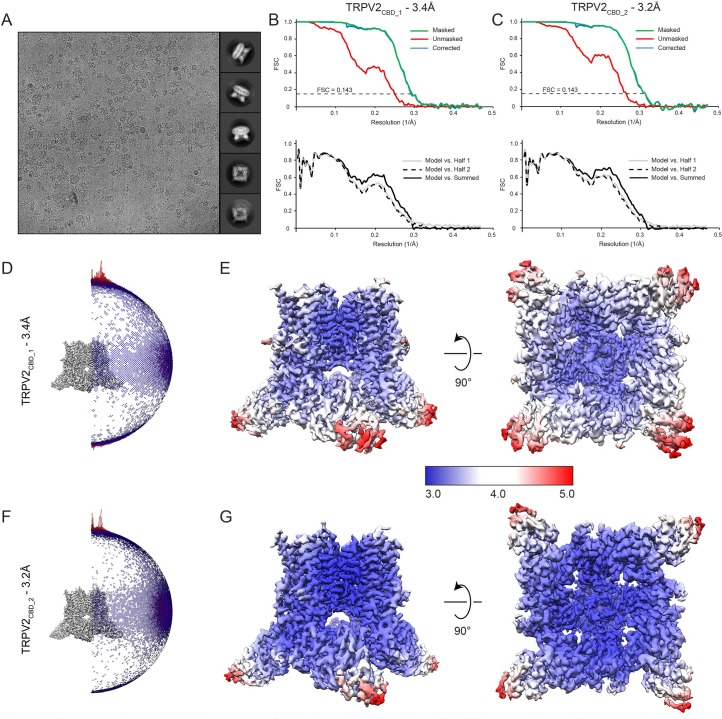
Figure 1u2014figure supplement 3.
EM summary of CBD-bound full-length rat TRPV2 in nanodiscs.
( A ) Representative micrograph and 2D classes of cryo-EM data. Map FSC curves and model validation curves for ( B ) TRPV2 CBD_1 and ( C ) TRPV2 CBD_2 . Angular distribution for the final 3D reconstru...
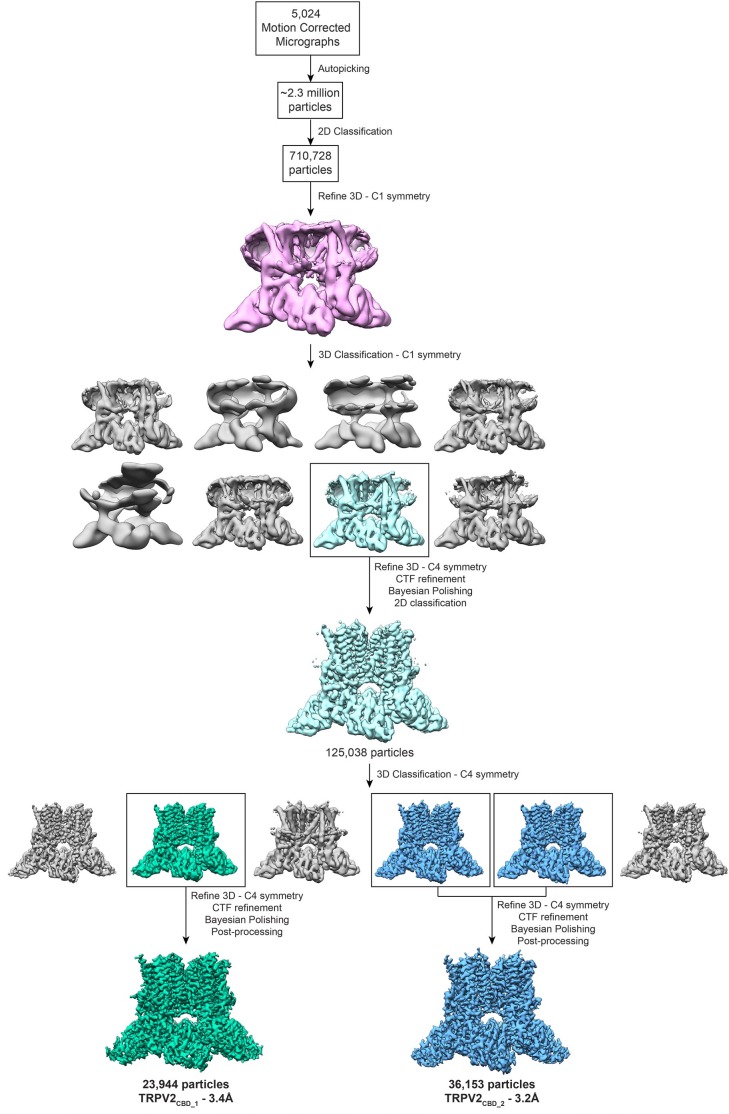
Figure 1u2014figure supplement 4.
CBD-bound TRPV2 cryo-EM data processing.
Workflow for 3D reconstruction resulting in two distinct CBD-bound TRPV2 structures.
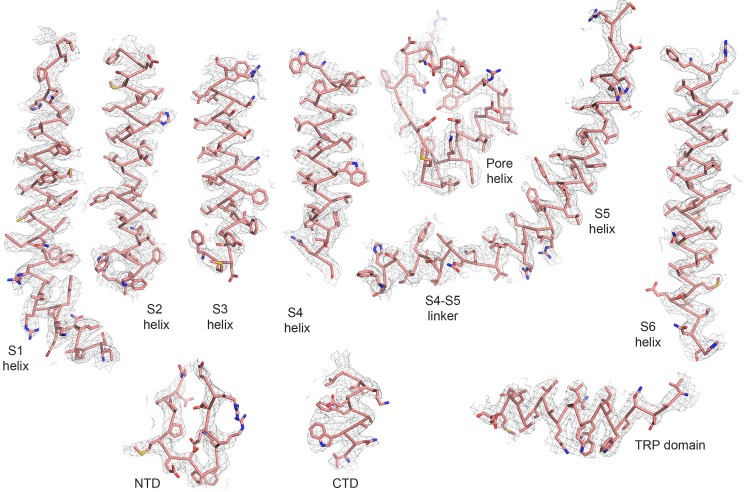
Figure 1u2014figure supplement 5.
Representative densities from the TRPV2 APO_1 cryo-EM map.
Densities are contoured at u03c3u00a0=u00a05.
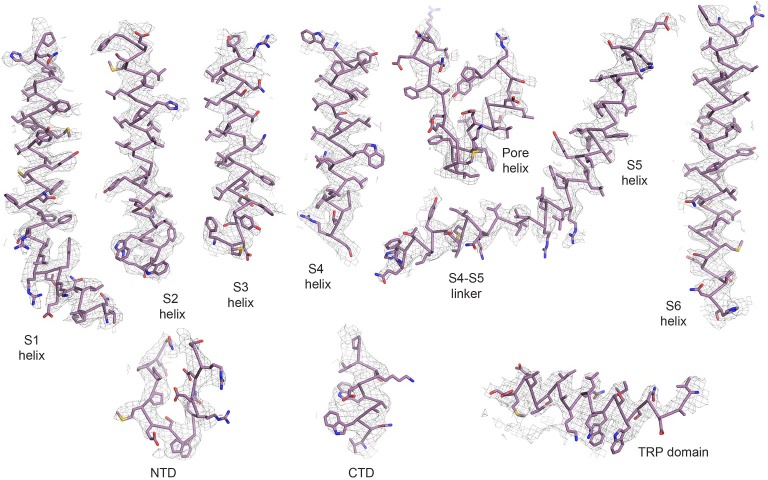
Figure 1u2014figure supplement 6.
Representative densities from the TRPV2 APO_2 cryo-EM map.
Densities are contoured at u03c3u00a0=u00a05.
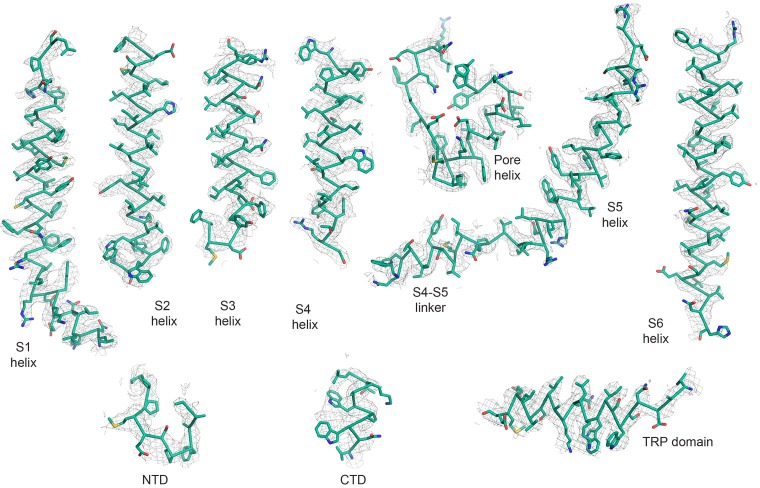
Figure 1u2014figure supplement 7.
Representative densities from the TRPV2 CBD_1 cryo-EM map.
Densities are contoured at u03c3u00a0=u00a05.
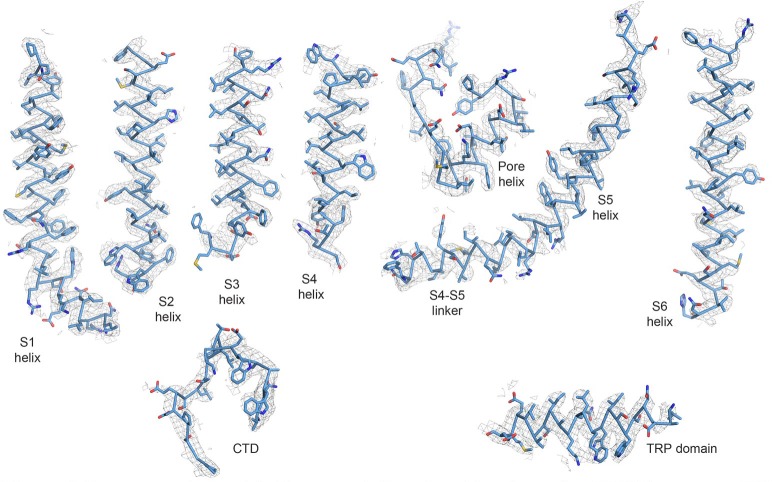
Figure 1u2014figure supplement 8.
Representative densities from the TRPV2 CBD_2 cryo-EM map.
Densities are contoured at u03c3u00a0=u00a05.
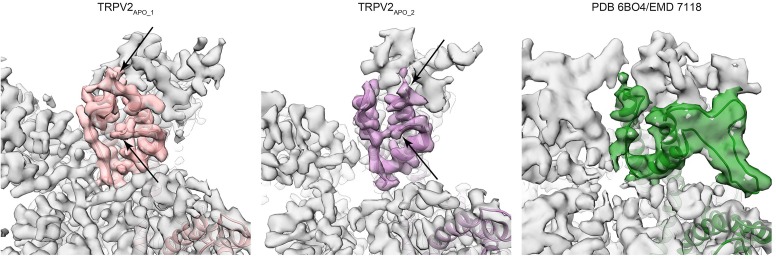
Figure 1u2014figure supplement 9.
Apo full-length rat TRPV2 pore turret comparison.
Comparison of cryo-EM density maps of TRPV2 APO_1 (left, salmon), TRPV2 APO_2 (middle, purple) and full-length rat TRPV2 in detergent (EMD 7118; right, green) in the pore turret region. The density su...
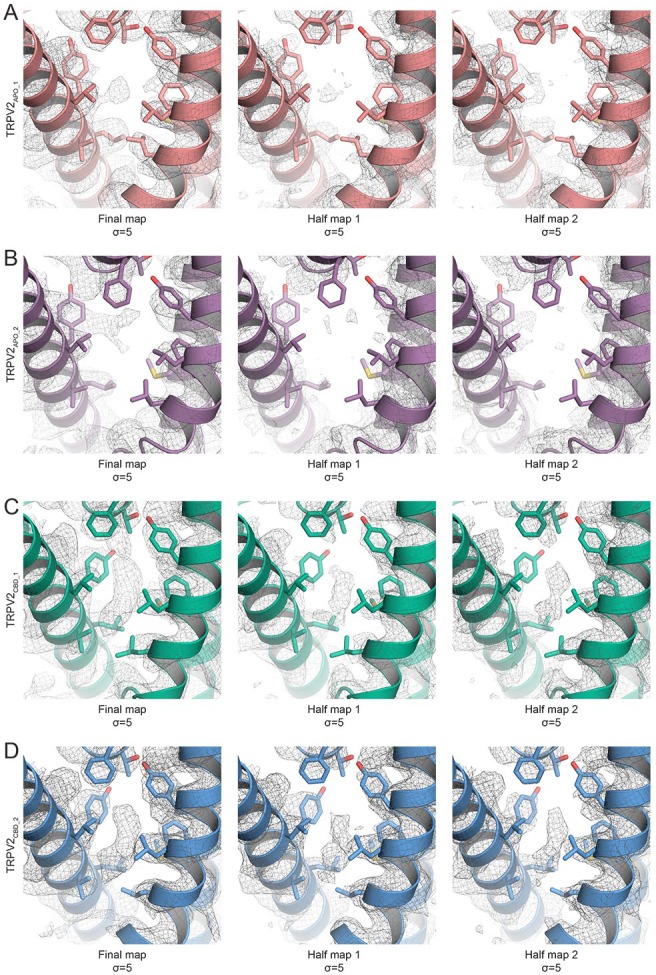
Figure 1u2014figure supplement 10.
Cryo-EM density in the CBD binding pocket.
TRPV2 models overlaid with the final postprocessed map and the two corresponding half maps for ( A ) TRPV2 APO_1 , ( B ) TRPV2 APO_2 , ( C ) TRPV2 CBD_1 , and ( D ) TRPV2 CBD_2 . Cryo-EM densities are...
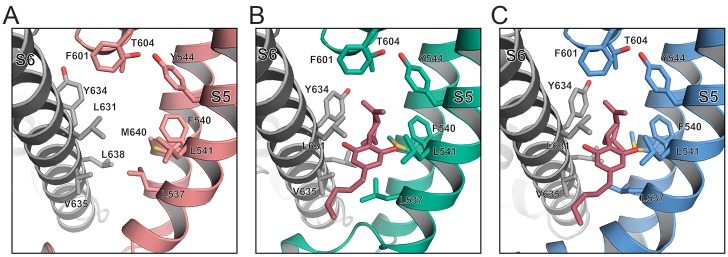
Figure 2.
The CBD binding site.
Model representations of the CBD binding pockets in the ( A ) TRPV2 APO_1 (salmon), ( B ) TRPV2 CBD_1 (green) and ( C ) TRPV2 CBD_2 (blue) structures. CBD is shown as pink sticks. Residues of interest...
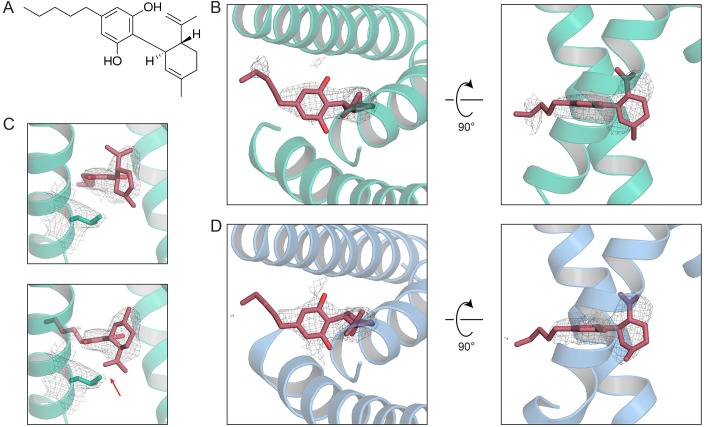
Figure 2u2014figure supplement 1.
CBD fit in the cryo-EM map.
( A ) Chemical diagram of cannabidiol (CBD). ( B ) Fit of CBD into the TRPV2 CBD_1 map. ( C ) Comparison of two poses of CBD in the TRPV2 CBD_1 map. The residue shown in sticks is Leu537. The red arro...
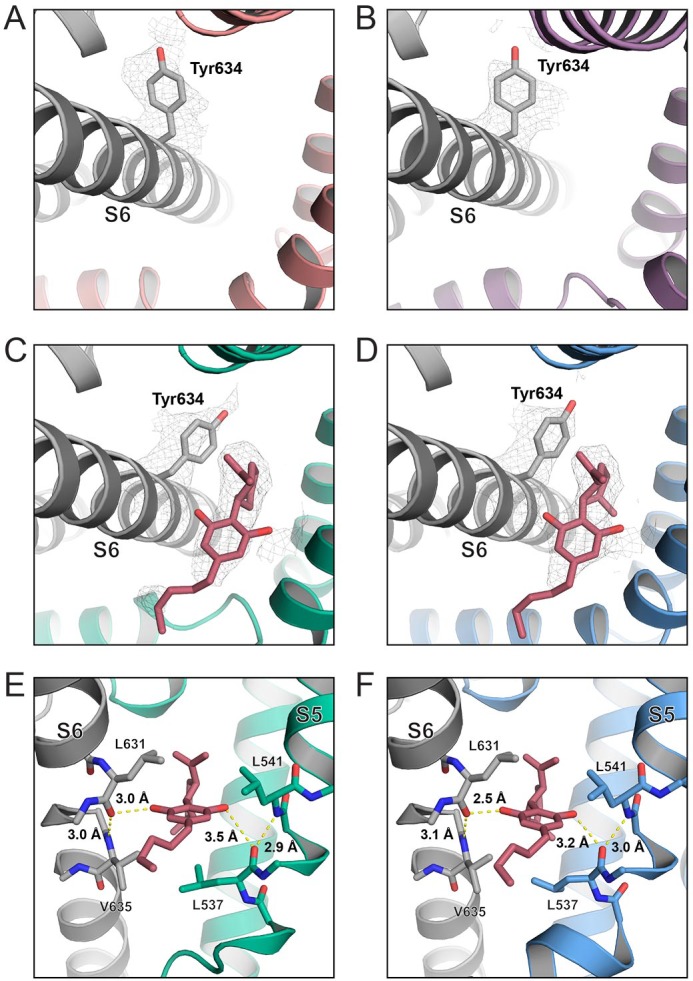
Figure 2u2014figure supplement 2.
Hydrogen binding between CBD and the helical backbone.
The CBD binding pocket of ( A ) TRPV2 CBD_1 (green) and ( B ) TRPV2 CBD_2 (blue) represented as cartoons and sticks. Dashed yellow lines indicate measured distances and residues of interest are labele...
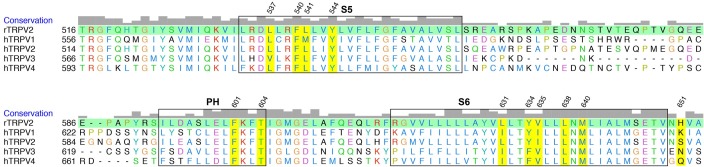
Figure 2u2014figure supplement 3.
Sequence alignment of thermoTRPV channels.
Alignment of human thermo TRPV channels and rat TRPV2 (highlighted in green). Residues are colored using the Clustal X coloration scheme. Residues of interest in this study are highlighted in yellow.
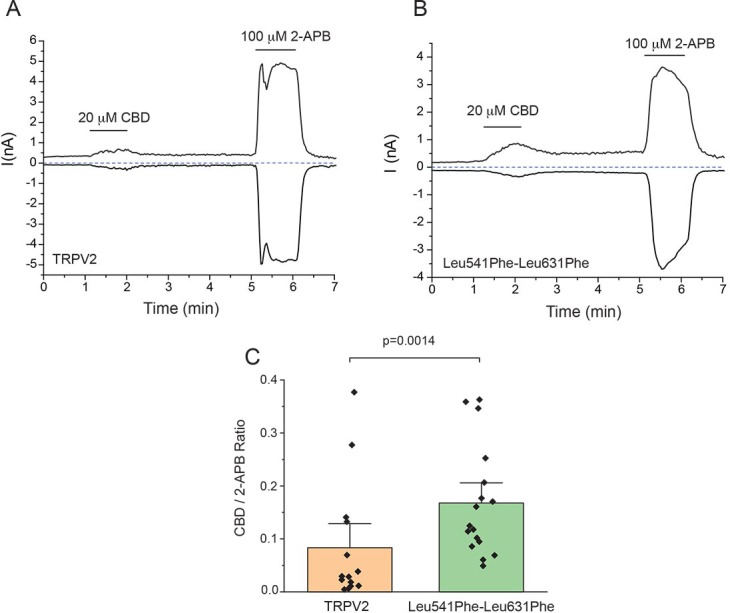
Figure 2u2014figure supplement 4.
The double mutant L541F-L631F increases current responses to CBD.
Whole cell patch clamp experiments in HEK293T cells were performed as described in the Materialsu00a0andu00a0methods section. Representative current traces in response to 20 u03bcM CBD and 100 u03bcM ...
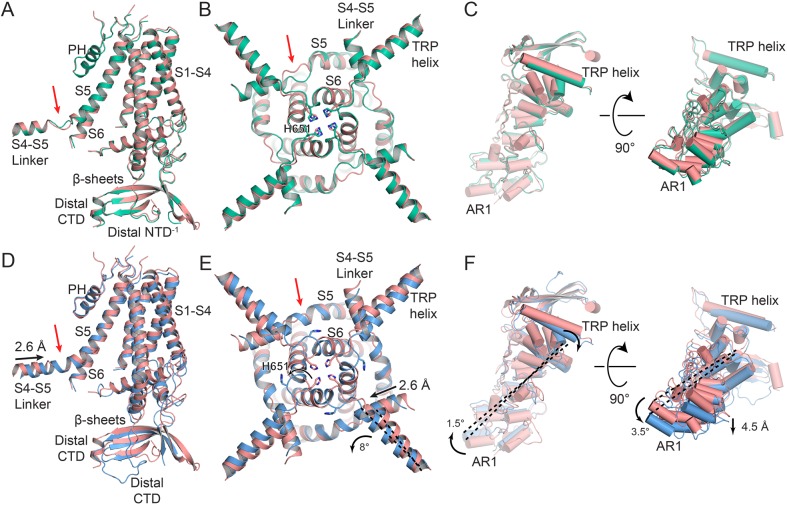
Figure 3.
Conformational changes upon CBD binding.
( A ) Overlay of the TRPV2 APO_1 (salmon) and TRPV2 CBD_1 (green) structures, aligned to the tetrameric pore (S5u2013PHu2013S6). ( B ) Zoom view from the intracellular side of the membrane on the over...
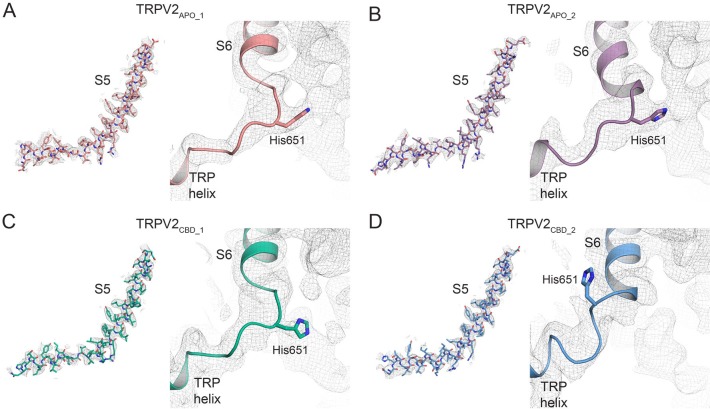
Figure 3u2014figure supplement 1.
Cryo-EM map density around the S4-S5 linker, S5, and the TRP helices.
Density for ( A ) TRPV2 APO_1 (salmon), ( B ) TRPV2 APO_2 (purple), ( C ) TRPV2 CBD_1 (green), and ( D ) TRPV2 CBD_2 (blue) is contoured to u03c3u00a0=u00a05. The view of the S4-S5 linker and S5 is fr...
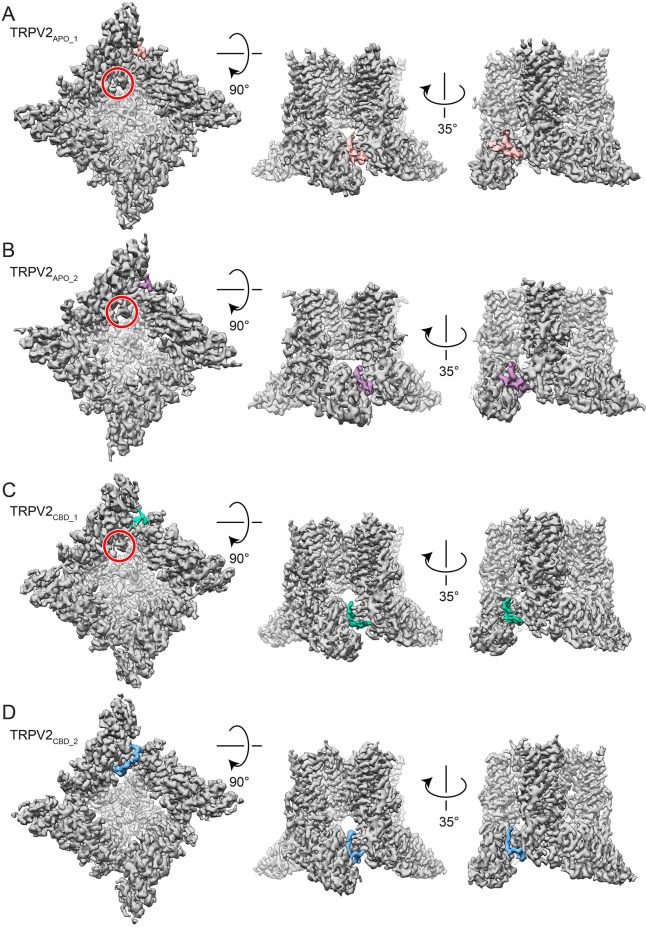
Figure 3u2014figure supplement 2.
Cryo-EM maps highlighting the CTD and NTD.
Cryo-EM maps showing the overall channel in gray with the NTD and CTD highlighted. ( A ) Cryo-EM map of TRPV2 APO_1 with density for the NTD colored salmon. ( B ) Cryo-EM map of TRPV2 APO_2 with densi...
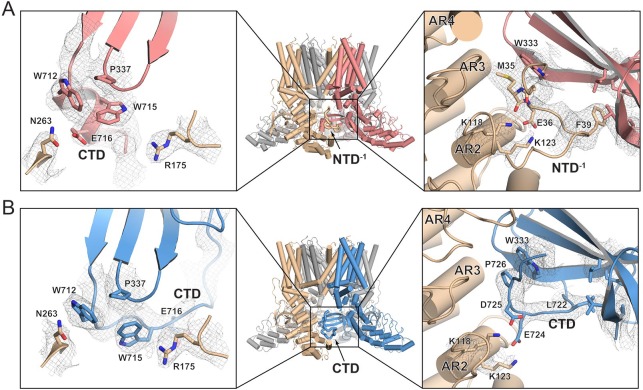
Figure 3u2014figure supplement 3.
Cryo-EM map density around the CTD and NTD of TRPV2 APO_1 and TRPV2 CBD_2 .
Model representation of the distal CTDs of ( A ) left panel) TRPV2 APO_1 (salmon) and ( B ) left panel) TRPV2 CBD_2 (blue). This view is of the back of the region indicated by the black square on the ...
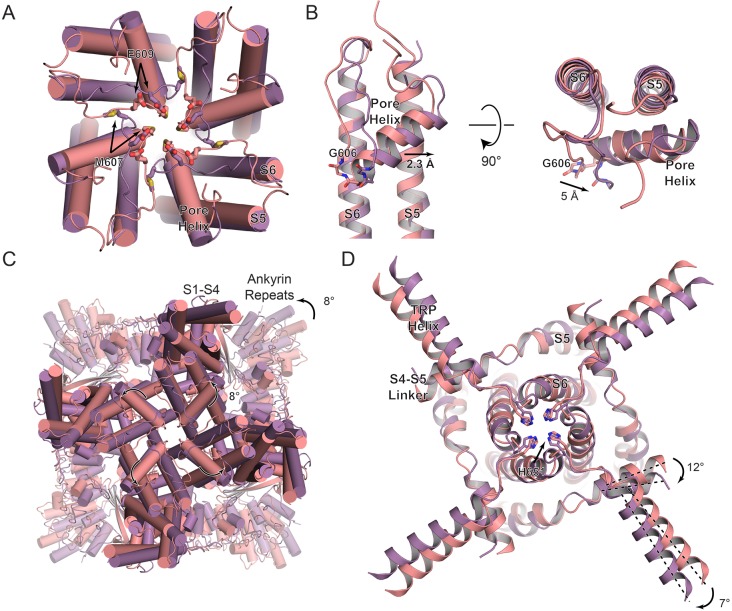
Figure 4.
Conformational changes between apo TRPV2 states.
( A ) Overlay of the TRPV2 APO_1 (salmon) and TRPV2 APO_2 (purple) selectivity filter, viewed from the extracellular side of the membrane. ( B ) Zoom view of the overlay at S5-PH-S6. ( C ) Overlay of ...
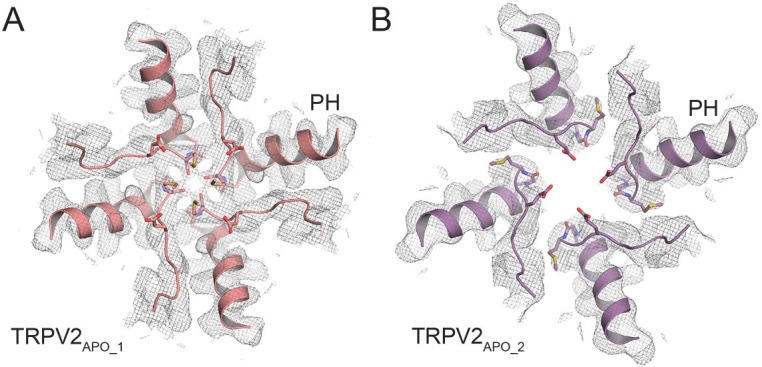
Figure 4u2014figure supplement 1.
Cryo-EM map density around the selectivity filter of TRPV2 APO_1 and TRPV2 APO_2 .
Density for ( A ) TRPV2 APO_1 (salmon) and ( B ) TRPV2 APO_2 (purple) is contoured to u03c3u00a0=u00a05. The selectivity filter is viewed from the extracellular side of the membrane. Residues of inter...
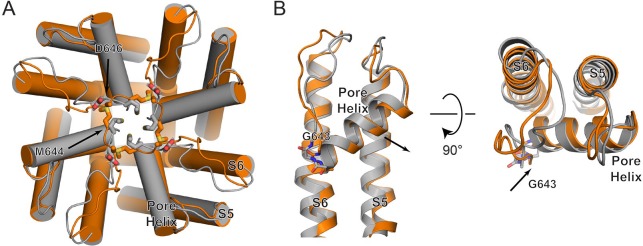
Figure 4u2014figure supplement 2.
Conformational changes at the selectivity filter between TRPV1 apo and DkTx/RTX-bound structures in nanodiscs.
( A ) Overlay of the TRPV1 apo state (PDB 5IRZ, gray) and TRPV1 DkTx/RTX-bound state (PDB 5IRX, orange) selectivity filter, viewed from the extracellular side of the membrane. ( B ) Zoom view of the o...
Figure images are served from the NIH/NLM PubMed Central Open Access Subset or Europe PMC; copyright remains with the publishers and authors.
💬 Discussion
0 commentsNo comments yet. Be the first to start a discussion!
Leave a Comment