Abstract
AbstractHigh power lasers are used extensively in medicine while lower power applications are popular for optical imaging, optogenetics, skin rejuvenation and a therapeutic modality termed photobiomodulation (PBM). This study addresses the therapeutic dose limits, biological safety and molecular pathway of near-infrared (NIR) laser phototoxicity. Increased erythema and tissue damage were noted in mice skin and cytotoxicity in cell cultures at phototoxic laser doses involving generation of reactive oxygen species (ROS) coupled with a rise in surface temperature (>45 °C). NIR laser phototoxicity results from Activating Transcription Factor-4 (ATF-4) mediated endoplasmic reticulum stress and autophagy. Neutralizations of heat or ROS and overexpressing ATF-4 were noted to rescue NIR laser phototoxicity. Further, NIR laser mediated phototoxicity was noted to be non-genotoxic and non-mutagenic. This study outlines the mechanism of NIR laser phototoxicity and the utility of monitoring surface temperature and ATF4 expression as potential biomarkers to develop safe and effective clinical applications.
🔬 Techniques
🧪 Sample Preparation
🔬 Cell Lines
🧪 Reagent Suppliers
🎨 Filters
💻 Software Details
🏛️ Research Organizations (ROR)
Affiliated research institutions:
📋 Methods
Cell lines Human dermal keratinocytes
(HaCaT) cells and human normal oral keratinocyte (NOKSI) cells were maintained in DMEM (Sigma-Aldrich, USA) supplemented with 10% fetal bovine serum (Invitrogen corporation, USA) along with 100 units/ml penicillin and 100 μg/ml streptomycin (Invitrogen Life Sciences, USA). Cells were grown at 37 °C in a humidified chamber with 5% CO 2 . Animal studies All experiments were performed in accordance with the institute guidelines and approved by the animal care and use committee (ASP#13-693). The dorsal skin of 5 weeks old C57BL/6NCr male mice (NCI Frederick) were shaved and naired. A baseline erythema and melanin score was obtained using a Derma lab probe (Cortex Technology, USA). An infrared camera ICI7640 (Infrared Cameras Incorporation, USA) was used to measure surface temperature of skin. Laser (810 nm diode) (AMD Lasers, USA) treatment was performed on the left and right dorsal skin of the mouse, ensuring the spine was avoided. The laser probe was setup 2 cm perpendicular to the mouse with a spot size of 2 cm in diameter (Irradiance = 1 W/cm 2 and fluence = 21 J/cm 2 ). The laser was used for various treatment time based on the melanin score and dynamically adjusted (laser switched on/off) to maintain specific surface temperature (45-55 °C) as monitored by the IR camera. For higher temperature (>55 o C), the probe was moved continuously in a controlled manner to prevent excessive heating as shown in Supporting Video 1 . For neutralization experiments, laser treated area was either cooled with cryogen spray cooling (1,1 Difluoroethane Falcon Safety Products, Inc., USA) or N-Acetyl Cysteine (NAC, 100 mM) or N-Acetyl Alanine (NAA, 100 mM) (Sigma-Aldrich, USA) applied topically as a gel (OptixCare, Eyelube, USA) or injected subcutaneously (100 μl) 15 min prior to laser treatments.
Show full methods section
Cell lines Human dermal keratinocytes
(HaCaT) cells and human normal oral keratinocyte (NOKSI) cells were maintained in DMEM (Sigma-Aldrich, USA) supplemented with 10% fetal bovine serum (Invitrogen corporation, USA) along with 100 units/ml penicillin and 100 μg/ml streptomycin (Invitrogen Life Sciences, USA). Cells were grown at 37 °C in a humidified chamber with 5% CO 2 . Animal studies All experiments were performed in accordance with the institute guidelines and approved by the animal care and use committee (ASP#13-693). The dorsal skin of 5 weeks old C57BL/6NCr male mice (NCI Frederick) were shaved and naired. A baseline erythema and melanin score was obtained using a Derma lab probe (Cortex Technology, USA). An infrared camera ICI7640 (Infrared Cameras Incorporation, USA) was used to measure surface temperature of skin. Laser (810 nm diode) (AMD Lasers, USA) treatment was performed on the left and right dorsal skin of the mouse, ensuring the spine was avoided. The laser probe was setup 2 cm perpendicular to the mouse with a spot size of 2 cm in diameter (Irradiance = 1 W/cm 2 and fluence = 21 J/cm 2 ). The laser was used for various treatment time based on the melanin score and dynamically adjusted (laser switched on/off) to maintain specific surface temperature (45-55 °C) as monitored by the IR camera. For higher temperature (>55 o C), the probe was moved continuously in a controlled manner to prevent excessive heating as shown in Supporting Video 1 . For neutralization experiments, laser treated area was either cooled with cryogen spray cooling (1,1 Difluoroethane Falcon Safety Products, Inc., USA) or N-Acetyl Cysteine (NAC, 100 mM) or N-Acetyl Alanine (NAA, 100 mM) (Sigma-Aldrich, USA) applied topically as a gel (OptixCare, Eyelube, USA) or injected subcutaneously (100 μl) 15 min prior to laser treatments.
Laser treatments in cell culture
Laser treatments were performed using an 810 nm, continuous wave GaAlAs laser (AMD lasers, USA). Treatments were given at a distance of 10 cm or 14.5 cm for 96 well and 6 well plate, respectively, such that the spot size covered treatment surfaces. To assess phototoxicity, the bottom surfaces of 96 well (black well clear bottom) or 6 well tissue culture plate were covered with a black rubber mastic tape (Scotch, USA). Cells were treated in 96 well and 6 well plates containing 200 μl and 2 ml media, respectively. Various irradiances (W/cm 2 ) were used to generate phototoxicity by adjusting power and distances as outlined in Supplementary Table 4 . Following laser treatments, cells were assessed for viability with AlamarBlue dye (Life Technologies, USA) at 24 hours. Laser doses that result in ≥70% cytotoxicity of cells in the laser treatment were considered as phototoxic dose. For neutralization experiment cells were pre incubated with NAC (1 mM), Catalase (1000units/ml) (Sigma-Aldrich, USA) for 2 hrs, followed by laser treatment. For the helium treatments, helium gas (Worthington, USA) was bubbled through media for 5 min and decreased oxygen percentage (311 mV to 200 mV) was verified by a redox probe (Redox/ORP electrode, Orion, Thermo Scientific, USA).
Surface temperature measurements
Surface temperature during the laser treatments were measured using IR camera ( in vitro and in vivo ). Measurements using IR camera (ICI7640, Infrared Cameras Incorporation, USA) was used to non-invasively measure surface temperature of skin or cell culture plates in real time (one frame per second) using IR flash software (version 2.14.19.5 Infrared Cameras Incorporation, USA) with accuracy of ±1 o C.
Cell viability assay
Cellular viability after laser treatment was measured using AlamarBlue dye (Thermo scientific, USA)). The AlamarBlue dye is an oxidized form of resazurin dye that is blue in color and non-fluorescent but if incubated with viable cells, the reagent changes color from blue to red and becomes fluorescent which can be measured at 530/590 (excitation/emission) 55 . Percent viability was calculated using the following formula: % Viability = (Fluorescence of treated cells/Fluorescence of untreated cells) x 100.
Tunel assay
Apoptosis, characterized by the genomic DNA fragmentation that can be detected by labeling the terminal end of nucleic acids using Terminal deoxynucleotidyl transferase dUTP Nick End Labeling (TUNEL), was detected with a kit (TACS 2TdT-DAB In situ Apoptosis Detection kit, Trevigen, Inc., USA) 56 . For adherent cells, cells cultured in glass chamber slides (Lab-TekII, Nunc, USA) were treated and fixed in 3.7% buffered formaldehyde (Sigma-Aldrich, USA) followed by the labeling reaction. For tissues, sections were deparaffinized in xylene (Sigma-Aldrich, USA) for 15 minutes and then transferred to absolute alcohol for 10 minutes followed by incubation in Phosphate buffered saline (1x PBS) (Life Technologies, USA) for 10 minutes. Tissue or adherent cells samples were then incubated with 50 μl of Proteinase K solution at 37 °C for 30 minutes followed by two washes in deionized water. Endogenous peroxidase activity was then blocked using 5% hydrogen peroxide in methanol and washed in PBS for 1 minute. Samples were incubated in TdT labeling buffer for 5 minutes and then incubated with 50 μl of labeling reaction (containing TdT dNTP, TdT Enzyme, 1X Manganese Cation and TdT labeling buffer) for 1 hr at 37 °C. Reaction was stopped using TdT stop buffer for 5 minutes. Samples were washed twice in deionized water for 5 minutes each. Further, tissue samples were incubated with 50 μl of Strep-HRP solution (secondary) for 10 minutes at 37 °C followed by two washes in PBS for 2 minutes each. Finally, the colorimetric substrate diaminobenzidine (DAB) and enhancer H 2 O 2 were used followed by counterstaining with Haematoxylin and mounted using Toluene-based mounting media (TBS, SHUR/Mount, USA).
ROS detection
In vitro assay Quantitation of Reactive Oxygen Species (ROS) generated by laser treatments was performed by DCFDA staining and flow cytometric analysis 57 . The CM-H 2 DCFDA (Molecular Probes, USA) is a membrane permeable molecule which passes easily through the cell membrane and increase in its fluorescence signal can be observed upon stimulation by an ROS inducing agent. HaCaT or NOKSI cells were trypsinized and 1 × 10 6 cells per ml suspension was made in PBS. 200 μl of the above cell suspension were treated with phototoxic dose in clear and dark tube (2 W at 10 cm). The cells were then incubated with 1 μM DCFDA solution in DMSO in dark for 5-10 minutes at room temperature. The distribution of DCFDA stained HaCaT and NOKSI cells were determined by flow cytometry (BD, FACS Canto, USA) using the FL-1 channel (Excitation/Emission: 492–495 nm/517–527 nm). In vivo assay Detection of ROS in mice was performed using an in vivo fluorescent ROS probe (ROSstar 800CW probe, Licor, USA). ROSstar is a hydrocyanine (reduced dyes) based probe design to detect extracellular reactive oxygen species. Immediately after laser treatment 50 μl of ROSstar probe was injected subcutaneously and incubated for 20 min. After the incubation fluorescence was detected using the IVIS (Caliper, USA) in vivo imaging system. Glutathione Reductase (GR) assay Glutathione Reductase activity was measured by the increase in absorbance due to reduction of DTNB [5,5’-dithiobis(2-nitrobenzoic acid)] at 412 nm (Colorimetric assay), as per the manufacturer protocol (GRSA, Sigma-Aldrich, USA). Briefly, 0.6 million per 20 μl of HaCaT and NOKSI cells were exposed with phototoxic dose in clear and black well plates. Cells were lysed (5-10 min after exposure) using 0.1% Triton X-100 and color development was performed using reaction mixture containing oxidized glutathione (1 mM), DTNB (0.7 mM), NADPH (40 μM) in assay buffer. The reaction was started by the addition of NADPH solution to the remaining mixture. GR activity was calculated by the following formula: Units/ml = (Change in Abs. sample – Change in Abs. blank) x (dilution factor)/ε mM x (volume of sample in ml); For NADPH ε mM = 6.22 mM −1 cm −1 ; For TNB6 ε mM = 14.15 mM −1 cm −1 . Activity of purified Glutathione Reductase enzyme was assessed in clear and black well plates following phototoxic laser treatments. Glutathione Reductase pure enzyme (EC 1.6.4.2) in potassium phosphate buffer, pH 7.5, with EDTA and trehalose as a stabilizer (G0665, Sigma-Aldrich, USA) was used for the assay. This GR solution containing >1 unit per ml (20 μl) was directly exposed to laser treatment in clear and black well plates and enzymatic activity was assessed.
Catalase Assay
Catalase enzyme converts hydrogen peroxide to water and oxygen (catalytic pathway) and hence this assay is based on the measurement of hydrogen peroxide substrate remaining after the action of catalase on the cellular lysate. This colorimetric method uses a substituted phenol (3,5-dichloro-2-hydroxybenzenesulfonic acid), which couples oxidatively to 4-aminoantipyrine in the presence of hydrogen peroxide and horseradish peroxidase (HRP) to give a red quinoneimine dye (N-(4-antipyryl)-3-chloro-5-sulfonatep-benzoquinone-monoimine) that absorbs at 520 nm (CAT100, Sigma-Aldrich, USA). Absorbance of the red quinoneimine dye versus amount of H 2 O 2 standard curve provides catalase activity in μmoles/min/ml by using the following formula: Activity (μmoles/min/ml) = [Change in μmoles (H 2 O 2 ) x dilution of sample x 100]/[V (Sample volume in ml) x reaction time]. For assessing the effect of phototoxic dose on pure enzyme, Catalase enzyme (C8362, Sigma-Aldrich, USA) was diluted (dilution 1:10,000) in enzyme dilution buffer and treated with 810 nm laser at phototoxic doses followed by the color development as described above.
Statistical Analyses
Statistical analyses were performed in Graphpad prism software (GraphPad Software, Inc., USA). Significance among two groups was assessed using paired Student’s t-test while multiple groups were assessed using analysis of variance (ANOVA) with Bonferroni’s Multiple Comparison Test. All treatments were compared to untreated control and p < 0.05 was considered significant. P value are indicated in figures as
📊 Figures
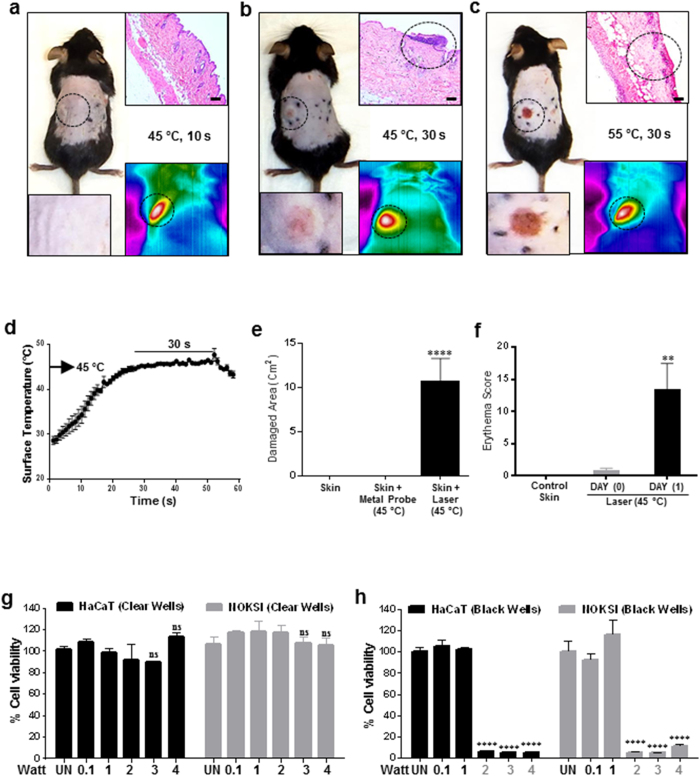
Figure 1
Laser induces phototoxicity in vivo and in vitro .
Dorsal skin of 5-week-old C57BL/6NCr male mice were shaved and naired and were dynamically treated with 3.2u2009W laser to maintain ( a ) 45u2009u00b0C for 10u2009s, ( b ) 45u2009u00b0C for 30u2009s a...
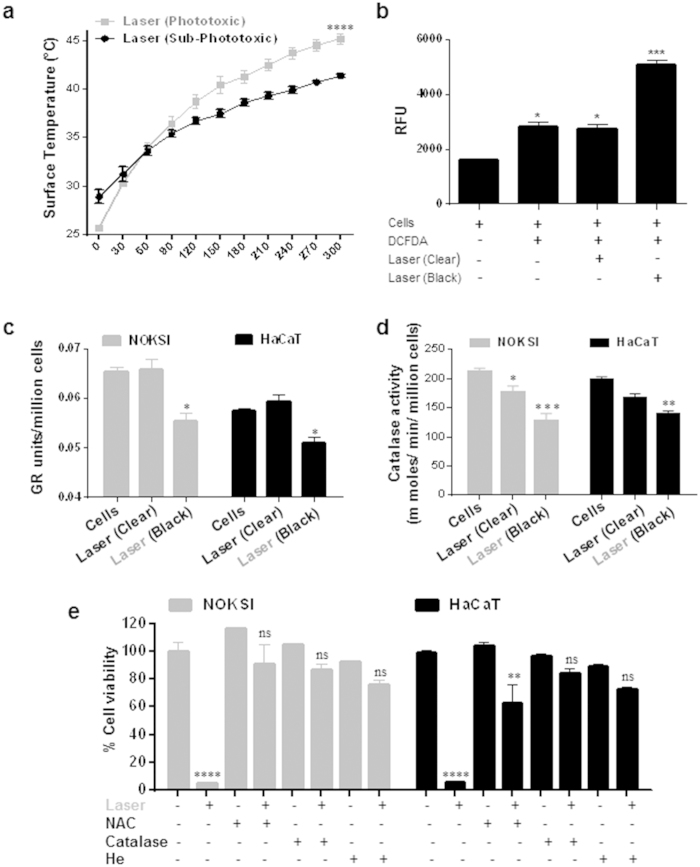
Figure 2
Laser induced phototoxicity is mediated by heat and ROS.
Surface temperature of cells treated with laser as assessed by IR camera (nu2009=u20093) ( a ) is shown. ( b ) ROS generation was assessed with DCFDA by FACS analyses following laser treatments in cle...
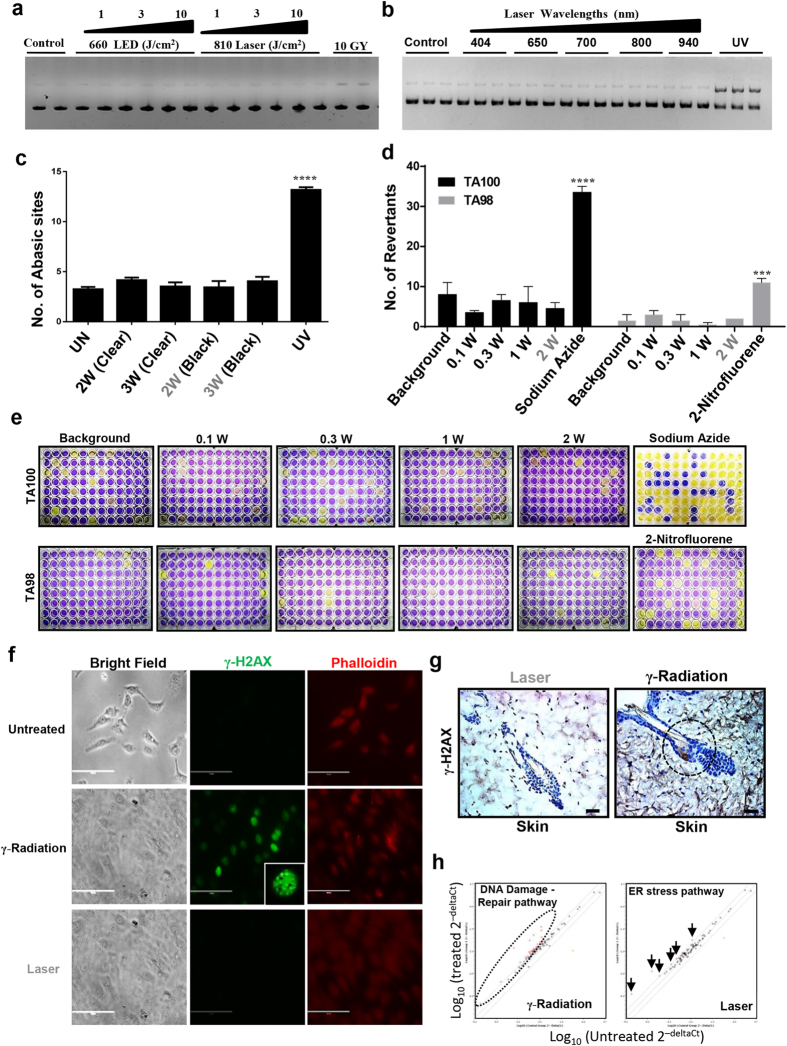
Figure 3
Laser does not cause DNA damage (Non-genotoxic).
Plasmid cleavage assay was performed using PUC19 and following laser treatments with varying doses ( a ) and wavelengths ( b ) plasmid was analyzed by gel electrophoresis on 1% agarose gel that was qu...
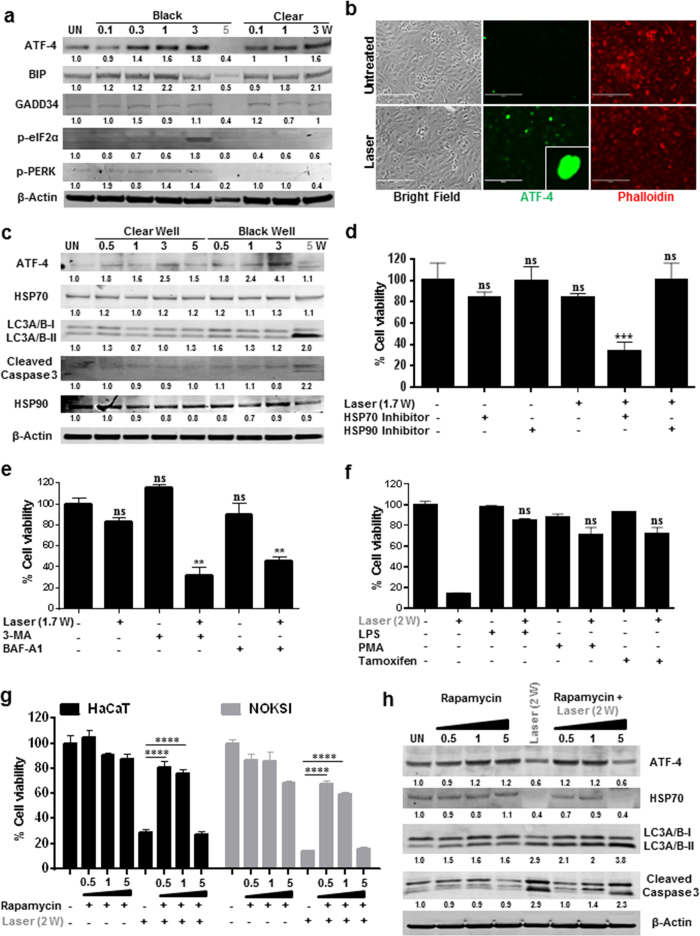
Figure 4
Laser induces ER stress at sub-phototoxic doses.
( a ) ER stress markers after varying doses of laser treatment were assessed at 24u2009hrs using immunoblotting. ( b ) Localization of ATF 4 in HaCaT cells were assessed after 6u2009hrs following lase...
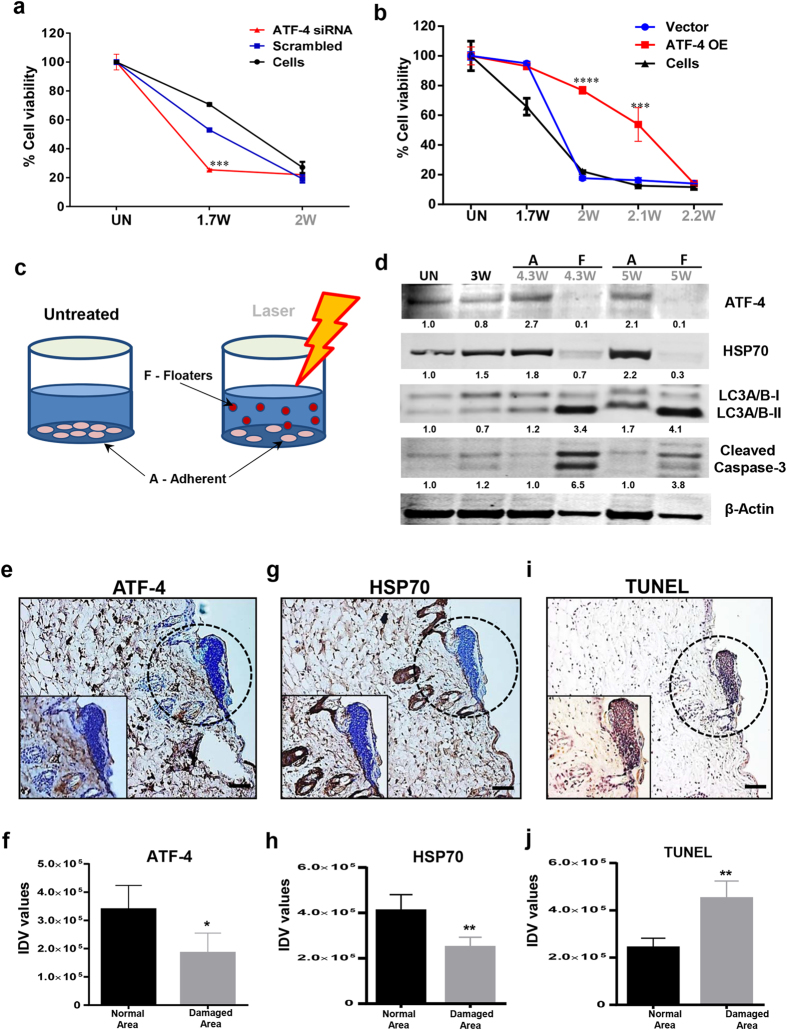
Figure 5
ATF-4 protects cells from cellular stress.
HaCaT cells were transfected with ATF-4 siRNA and were treated with different laser doses. Cellular viability ( a ) (nu2009=u20093) was assessed at 24 hrs. ( b ) Conversely, over expressing ATF-4 stab...
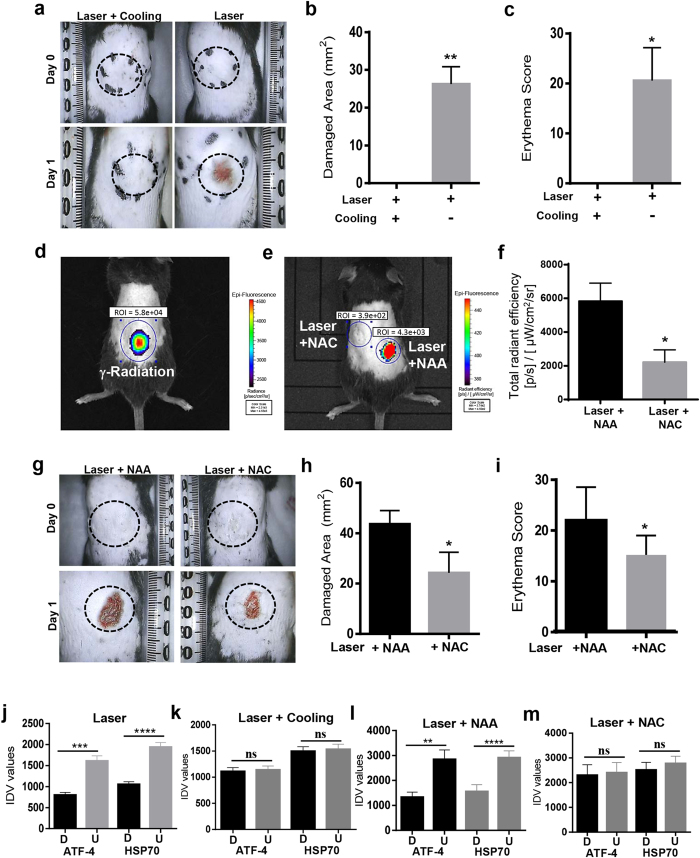
Figure 6
Laser mediated damage is via heat and ROS in vivo .
( a ) Images of the dorsal portion of 5-week-old C57BL/6NCr male mice treated with laser (55u2009u00b0C) or following skin cooling for 30 s. Quantitation of damaged area ( b ) and erythema score ( c )...
Figure images are served from the NIH/NLM PubMed Central Open Access Subset or Europe PMC; copyright remains with the publishers and authors.
💬 Discussion
0 commentsNo comments yet. Be the first to start a discussion!
Leave a Comment