Abstract
AbstractLarge-scale microscopy approaches are transforming brain imaging, but currently lack efficient multicolor contrast modalities. We introduce chromatic multiphoton serial (ChroMS) microscopy, a method integrating one‐shot multicolor multiphoton excitation through wavelength mixing and serial block-face image acquisition. This approach provides organ-scale micrometric imaging of spectrally distinct fluorescent proteins and label-free nonlinear signals with constant micrometer-scale resolution and sub-micron channel registration over the entire imaged volume. We demonstrate tridimensional (3D) multicolor imaging over several cubic millimeters as well as brain-wide serial 2D multichannel imaging. We illustrate the strengths of this method through color-based 3D analysis of astrocyte morphology and contacts in the mouse cerebral cortex, tracing of individual pyramidal neurons within densely Brainbow-labeled tissue, and multiplexed whole-brain mapping of axonal projections labeled with spectrally distinct tracers. ChroMS will be an asset for multiscale and system-level studies in neuroscience and beyond.
🔬 Techniques
✨ Fluorophores
🧪 Sample Preparation
🔬 Cell Lines
🏭 Microscope Brands
🔴 Lasers
📷 Detectors
💻 Software Details
💾 Data Repositories
🏛️ Research Organizations (ROR)
Affiliated research institutions:
📋 Methods
Multicolor transgenic mice
Mice were housed in a 12 h light/12 h dark cycle with free access to food, and animal procedures were carried out in accordance with institutional guidelines. Animal protocols were approved by the Charles Darwin animal experimentation ethical board (CEEACD/No 5). We used transgenic mice broadly expressing a CAG-Cytbow transgene 14 , modified to achieve random expression of mTurquoise2 55 , mEYFP 56 or tdTomato 57 from the broadly active CAG promoter following Cre recombination. These mice were crossed with Nestin-Cre (B6.Cg-Tg(Nes-cre)1Kln) animals 58 and their offspring analyzed at P29. This strategy triggers multicolor labels in Nestin+progenitors and their descendants, including both neuronal and glial cells.
Labeling of cortical astrocytes and upper layer pyramidal neurons
Cortical astroglial cells were labeled by targeting their progenitors in the dorsal telencephalon with the MAGIC markers strategy 14 . Briefly, a glass micropipette was used to inject into the lateral ventricle of E15 Swiss embryos 1 µl of DNA mix containing the three following plasmids: PB CAG-Cytbow (2 µg µl −1 ), in which PiggyBac transposition endfeet flanking a CAG-Cytbow cassette enable genomic integration, CAG-hyPBase (1 µg µl −1 ), expressing the corresponding transposase 59 , and CAG-seCre (0.2 µg µl −1 ) which expresses a self-excisable Cre recombinase. Four 35 V pulses of 50 ms were applied with a CUY21EDIT electroporator (NepaGene) and 3 mm diameter Tweezertrodes (Sonidel Limited) positioned to target the dorsal wall of the lateral ventricle. Electroporated animals were allowed to develop until analysis at P65. This procedure efficiently labels with FP combinations the cells originating from the electroporated cortical progenitors, i.e. upper layer pyramidal neurons and later-born glial cells, mostly astrocytes. Pyramidal neurons traced in Fig. 5 were labeled by electroporating PB CAG-Cytbow (1 µg µl −1 ) and CAG-seCre (0.1 µg µl −1 ) without transposase in E15 Swiss embryos and brains were imaged at P21. Multiplex tract tracing with AAVs Three topographically distinct areas within the antero-lateral sensorimotor cortex were injected with AAV2/9 encoding FPs respectively emitting in the cyan (mTurquoise2 55 or mCerulean 60 , yellow (mEYFP 56 ) or red (tdTomato 57 or DsRed-express 61 spectral range. Recombinant AAVs were based on a single-stranded (ss) AAV plasmid backbone with a CMV early enhancer/chicken β actin (CBA) promoter driving FP expression, except for DsRed-Express, driven by a CMV promoter. Detailed maps and sequences of the vectors are available upon request. Apart from the mCerulean vector, obtained from the Penn Vector Core (AV-9-PV1970), and the DsRed-Express vector generated as described in Kuhlman et al. 62 , all recombinant AAVs were produced by co-transfecting the corresponding vector plasmids along with packaging and helper plasmids in HEK293T cells. The AAV particles were harvested by centrifugation and dialyzed. AAV vector titers were then determined using real-time qPCR and adjusted to 0.5–5×10 13 vg ml − 1 by dilution in phosphate buffer saline (PBS) prior to injection. C57Bl6 female mice aged 11 weeks were anesthetized by inhalation of 2% isoflurane delivered with a constant oxygen flow (0.4 l min − 1 ). Dexamethasone (0.5 mg kg −1 ) and ketoprofen (5 mg kg −1 ) were administered subcutaneously for pre-emptive analgesia prior to the surgery and lidocaine (2-4 mg kg −1 ) was applied preemptively intra-incisionally. Mice were mounted in a stereotaxic headframe (Kopf Instruments, 940 series). Stereotactic coordinates were identified for three topographically distinct brain areas within the antero-lateral sensorimotor cortex that were respectively injected with the three AAVs. An incision was made over the scalp, three small burr holes drilled in the skull and brain surface exposed at each site. Injections were performed using the following AAVs and coordinates along the medio-lateral (ML), antero-posterior (AP), and dorso-ventral (DV) axis (defined relative to Bregma for ML and AP coordinates, and with reference to the surface of the brain for DV): in the whole brain projection mapping experiment (Fig. 6 ), we injected AAV2/9-CBA-tdTomato-WPRE (ML 2.4 mm, right; AP + 2.7 mm; DV 1 mm, α = −30 °), AAV2/9-CBA-mTurq2-WPRE (ML 2.4 mm, right; AP + 2.2 mm; DV 1 mm, α = 0°) and AAV2/9-CBA-EYFP-WPRE (ML 2.4 mm, right; AP + 1.9 mm; DV 1 mm, α = −30 °). For the WM and THG imaging experiment (Fig. 7 ), we used AAV2/9-CMV-BI-DsRed-Express-WPRE (ML 2.4 mm, right; AP + 2.7 mm; DV 1 mm, α = −30°); AAV2/9-CAG(CB7)-CI-mCerulean-WPRE-rBG (ML 2.5 mm, right; AP + 2.3 mm; DV 0.7 mm, α = 0°) and AAV2/9-CBA-EYFP-WPRE (ML 2.7 mm, right; AP + 2.0 mm; DV 1 mm, α = −30°). A pulled glass pipette tip of 20–30 μm containing the AAV suspension was lowered into the brain and 300 nl was delivered at a rate of 30 nl min − 1 using a Picospritzer (General Valve Corp) at each of the three sites; following each virus injection, the pipette was left in its location for 10 min to prevent backflow. After the injection, the incision was closed with 5/0 nylon suture thread (Ethilon Nylon Suture, Ethicon Inc. Germany), and animals were kept warm on a heating pad until complete recovery.
Show full methods section
Multicolor transgenic mice
Mice were housed in a 12 h light/12 h dark cycle with free access to food, and animal procedures were carried out in accordance with institutional guidelines. Animal protocols were approved by the Charles Darwin animal experimentation ethical board (CEEACD/No 5). We used transgenic mice broadly expressing a CAG-Cytbow transgene 14 , modified to achieve random expression of mTurquoise2 55 , mEYFP 56 or tdTomato 57 from the broadly active CAG promoter following Cre recombination. These mice were crossed with Nestin-Cre (B6.Cg-Tg(Nes-cre)1Kln) animals 58 and their offspring analyzed at P29. This strategy triggers multicolor labels in Nestin+progenitors and their descendants, including both neuronal and glial cells.
Labeling of cortical astrocytes and upper layer pyramidal neurons
Cortical astroglial cells were labeled by targeting their progenitors in the dorsal telencephalon with the MAGIC markers strategy 14 . Briefly, a glass micropipette was used to inject into the lateral ventricle of E15 Swiss embryos 1 µl of DNA mix containing the three following plasmids: PB CAG-Cytbow (2 µg µl −1 ), in which PiggyBac transposition endfeet flanking a CAG-Cytbow cassette enable genomic integration, CAG-hyPBase (1 µg µl −1 ), expressing the corresponding transposase 59 , and CAG-seCre (0.2 µg µl −1 ) which expresses a self-excisable Cre recombinase. Four 35 V pulses of 50 ms were applied with a CUY21EDIT electroporator (NepaGene) and 3 mm diameter Tweezertrodes (Sonidel Limited) positioned to target the dorsal wall of the lateral ventricle. Electroporated animals were allowed to develop until analysis at P65. This procedure efficiently labels with FP combinations the cells originating from the electroporated cortical progenitors, i.e. upper layer pyramidal neurons and later-born glial cells, mostly astrocytes. Pyramidal neurons traced in Fig. 5 were labeled by electroporating PB CAG-Cytbow (1 µg µl −1 ) and CAG-seCre (0.1 µg µl −1 ) without transposase in E15 Swiss embryos and brains were imaged at P21. Multiplex tract tracing with AAVs Three topographically distinct areas within the antero-lateral sensorimotor cortex were injected with AAV2/9 encoding FPs respectively emitting in the cyan (mTurquoise2 55 or mCerulean 60 , yellow (mEYFP 56 ) or red (tdTomato 57 or DsRed-express 61 spectral range. Recombinant AAVs were based on a single-stranded (ss) AAV plasmid backbone with a CMV early enhancer/chicken β actin (CBA) promoter driving FP expression, except for DsRed-Express, driven by a CMV promoter. Detailed maps and sequences of the vectors are available upon request. Apart from the mCerulean vector, obtained from the Penn Vector Core (AV-9-PV1970), and the DsRed-Express vector generated as described in Kuhlman et al. 62 , all recombinant AAVs were produced by co-transfecting the corresponding vector plasmids along with packaging and helper plasmids in HEK293T cells. The AAV particles were harvested by centrifugation and dialyzed. AAV vector titers were then determined using real-time qPCR and adjusted to 0.5–5×10 13 vg ml − 1 by dilution in phosphate buffer saline (PBS) prior to injection. C57Bl6 female mice aged 11 weeks were anesthetized by inhalation of 2% isoflurane delivered with a constant oxygen flow (0.4 l min − 1 ). Dexamethasone (0.5 mg kg −1 ) and ketoprofen (5 mg kg −1 ) were administered subcutaneously for pre-emptive analgesia prior to the surgery and lidocaine (2-4 mg kg −1 ) was applied preemptively intra-incisionally. Mice were mounted in a stereotaxic headframe (Kopf Instruments, 940 series). Stereotactic coordinates were identified for three topographically distinct brain areas within the antero-lateral sensorimotor cortex that were respectively injected with the three AAVs. An incision was made over the scalp, three small burr holes drilled in the skull and brain surface exposed at each site. Injections were performed using the following AAVs and coordinates along the medio-lateral (ML), antero-posterior (AP), and dorso-ventral (DV) axis (defined relative to Bregma for ML and AP coordinates, and with reference to the surface of the brain for DV): in the whole brain projection mapping experiment (Fig. 6 ), we injected AAV2/9-CBA-tdTomato-WPRE (ML 2.4 mm, right; AP + 2.7 mm; DV 1 mm, α = −30 °), AAV2/9-CBA-mTurq2-WPRE (ML 2.4 mm, right; AP + 2.2 mm; DV 1 mm, α = 0°) and AAV2/9-CBA-EYFP-WPRE (ML 2.4 mm, right; AP + 1.9 mm; DV 1 mm, α = −30 °). For the WM and THG imaging experiment (Fig. 7 ), we used AAV2/9-CMV-BI-DsRed-Express-WPRE (ML 2.4 mm, right; AP + 2.7 mm; DV 1 mm, α = −30°); AAV2/9-CAG(CB7)-CI-mCerulean-WPRE-rBG (ML 2.5 mm, right; AP + 2.3 mm; DV 0.7 mm, α = 0°) and AAV2/9-CBA-EYFP-WPRE (ML 2.7 mm, right; AP + 2.0 mm; DV 1 mm, α = −30°). A pulled glass pipette tip of 20–30 μm containing the AAV suspension was lowered into the brain and 300 nl was delivered at a rate of 30 nl min − 1 using a Picospritzer (General Valve Corp) at each of the three sites; following each virus injection, the pipette was left in its location for 10 min to prevent backflow. After the injection, the incision was closed with 5/0 nylon suture thread (Ethilon Nylon Suture, Ethicon Inc. Germany), and animals were kept warm on a heating pad until complete recovery.
ChroMS setup and image acquisition
Imaging was performed on a lab-built laser scanning microscope. The excitation source used was a Ti:Sapphire+OPO chain (Chameleon Ultra2 and MPX, Coherent, CA, USA). The two synchronous output beams were combined using a dichroic filter (DMSP-1000, Thorlabs) and temporally synchronized using a long-range motorized delay line (Thorlabs) placed on the OPO beam path, as described in ref. 30 . The power of the TiS and OPO beams were controlled using motorized waveplates and polarizers. In multicolor experiments, efficiency of the 2c2P virtual green excitation was independently controlled by adjusting the motorized delay line 30 . Scanning was performed with galvanometric scanners (series 6215, Cambridge Technology, MA, USA). Excitation beams were focused into the sample using a water immersion objective (25×, 1.05NA, XLPLN25XWMP2, Olympus, Japan). Beam size at the rear pupil of the excitation objective and beam divergence were adjusted using two-lens telescopes, one on each beam path. To prevent photobleaching, an electronically controlled beam shutter was installed after beam recombination together with an electro-optical modulator blocking TiS excitation during laser fly-back in unidirectional scan mode. A vibrating blade microtome (Tissue Vision, USA) was integrated into the upright microscope setup, together with long-range high-precision XYZ translation stage (Physik Instrumente, Germany/ Tissue Vision, USA) for mosaic imaging and serial z-sectioning. Scanning and acquisition were synchronized using lab-written LabVIEW software and a multichannel I/O board (PCI-6115, National Instruments, USA). Mosaic acquisition and tissue slicing were controlled by a custom version of the Orchestrator software (Tissue Vision, USA) synchronized with the acquisition software through a lab-written LabVIEW module. Signals were detected in the backward (epi) direction by photomultiplier tubes (SensTech, UK) and/or GaAsP detectors (H7422P-40, Hamamatsu, Japan) using lab-designed electronics enabling either counting or analog detection. Fluorescence and coherent signals were collected using a dichroic mirror (Semrock 751 nm, USA) and directed towards four independent detectors using dichroic mirrors (Chroma 405 nm, Semrock 521 and 561 nm). Bandpass filters were used in front of the detectors to collect blue (Semrock 475/25), green (Semrock 547/22), and red (Semrock 607/70) light. The latter red bandpass filter was removed for CARS imaging. Third harmonic generation was collected with a dichroic mirror (Chroma, 405 nm). Sample mount consisted of a rotating slide holder fixed into an ~2 l plastic tank installed on the translating stage. The objective and microtome arm were immersed in the PBS-filled tank during the entire duration of acquisitions (see Supplementary Fig. 13 ). For vibrational imaging, excitation wavelengths were set to 832/1090 nm. Otherwise, excitation wavelengths were set to 850/1100 nm. To minimize lateral chromatic aberration and field curvature, the scan system was designed using a Plössl-lens configuration 63 , and optics coating were also chosen to minimize aberrations (see Supplementary Fig. 14 ). Individual tile size was 300–360 µm × 300-360 µm in multicolor experiments (Supplementary Fig. 14 ) and 200 µm × 200 µm in THG-CARS experiments. A 10% lateral overlap was used for mosaic reconstruction. In the tomography acquisition mode, imaging was typically performed 40 µm below the surface. In the continuous acquisition mode, 80–130-µm-thick stacks were acquired after each 60–110-µm-thick tissue section to allow 3D stitching. For robust tissue slicing, the frequency of the microtome vibrating blade was set to 60 Hz and slicing speed to 0.3-0.5 mm s −1 . Axial sampling were set to 1.8 µm (TiS) and 2.6 µm (OPO) with 500 regions of interest (ROIs) selected in color-labeled zones. The representative pool was plotted in a ternary color diagram and a linear transform was applied to stretch RGB values over the entire color diagram. Channel intensities were modeled as follow: documentclass[12pt]{minimal} usepackage{amsmath} usepackage{wasysym} usepackage{amsfonts} usepackage{amssymb} usepackage{amsbsy} usepackage{mathrsfs} usepackage{upgreek} setlength{oddsidemargin}{-69pt} begin{document}$$left{ {begin{array}{*{20}{c}} {R_{{mathrm{raw}}} = R_{{mathrm{corr}}} + a_{{mathrm{GR}}}.G_{{mathrm{corr}}} + a_{{mathrm{BR}}}.B_{{mathrm{corr}}}} \ {G_{{mathrm{raw}}} = a_{{mathrm{RG}}}.R_{{mathrm{corr}}} + G_{{mathrm{corr}}} + a_{{mathrm{BG}}}.G_{{mathrm{corr}}}} \ {B_{{mathrm{raw}}} = a_{{mathrm{RB}}}.R_{{mathrm{corr}}} + a_{{mathrm{GB}}}.G_{{mathrm{corr}}} + B_{{mathrm{corr}}}} end{array}} right.$$end{document} R raw = R corr + a GR . G corr + a BR . B corr G raw = a RG . R corr + G corr + a BG . G corr B raw = a RB . R corr + a GB . G corr + B corr In images of Brainbow mice (Fig. 1 ) or MAGIC markers (Figs. 2 , 3 , and 5 ), the a XX coefficients were determined using maximum red, green and blue intensity ROIs R max ( r r , g r , b r ), G max ( r g , g g , b g ), B max ( r b , g b , b b ) and by projecting the maximum blue intensity ROI to the ‘pure blue’ point in the ternary diagram. The stretching coefficients were then obtained by inverting the system associated matrix. The same procedure was used for unmixing the AAV-labeled datasets (Fig. 6 ), using barycentres of the ROI distributions obtained for each AAV (red, green, and blue) instead of maxima.
Astroglial network reconstruction and segmentation
Analyses of cortical protoplasmic astroglial cell distribution and contacts (Fig. 4 ) were done using Fiji 64 and Matlab (Mathworks, USA). A partial rendering of the astroglial network was obtained by reconstructing 3D color-clusters of astrocytes labeled with MAGIC markers. A 3D color-cluster was defined as an ensemble of astrocytes expressing a same color combination and continuously in contact with each other (see Fig. 4a ). Individual astrocytes were considered as color-clusters of size 1. Within each cluster, the positions of astrocyte somata were pointed, together with the positions of negatively contrasted contacting cell bodies of 4–6 µm diameter size. Cell bodies were discriminated from transverse blood vessel sections using adjacent upper and lower slices within the z-stack. Both cell bodies engulfed within protoplasmic astrocytic domains and those located at the astrocytes’ periphery were included in this analysis. The ratio of contacted cells over labeled astrocytes was computed for all clusters, except pial. For the analysis of astrocyte contacted cell number in different cortical layers (Fig. 4c ), only clusters of size ≤3 which were entirely comprised within an identified cortical layer were considered. Cortical layers were identified based on morphological landmarks (see Supplementary Fig. 4b ): layer 2/3 was identified by the neuronal labeling resulting from E15 electroporation 66 ; layer 5a was discriminated using visible projections from layer 2/3 pyramidal neurons 66 ; and layers 5b and 6 were discriminated based on cell density, size and distance to the corpus callosum. The pial surface was automatically segmented using intensity thresholding and morphometric boundaries detection. The segmented surface was then downscaled and fitted with linear interpolation for 3D visualization. 3D segmentation of individual astrocyte domains was done on isolated or color-segregated cells using IMARIS 8.4v (Bitplane, Switzerland). For each astrocyte, semi-automatic iso-intensity contours were drawn in all slices of the corresponding z-stack (see Supplementary Fig. 4a ). When the iso-intensity contour tool did not provide accurate segmentation (low color SNR), manually defined contours were drawn. Only astrocytes that could be unambiguously attributed to a specific cortical layer (as defined above) were considered for layer analyses. To analyze the relation between contacted cells number and astrocyte domain volume (Fig. 4e ), only individual astrocytes and pairs comprised within an identified cortical layer of which contacting cells had been pointed were considered (the domain volume of astrocyte belonging to a pair being approximated as half of the total volume of the pair).
Statistical analysis
Statistical analysis of astrocyte volume distributions in different cortical layers was performed using GraphPad Prism software. Sample size being unequal across all the categories and without any assumption on the distributions, a non-parametric one-way anova test was first performed (Kruskal-Wallis), followed by a post hoc multiple comparisons test (Dunn).
Astrocytes tridimensional interface analysis
For each astrocyte pair analyzed, the interface between the two-color segregated astrocytes ( A 1 , A 2 ) was segmented using Fiji 64 resulting in a discrete set of 3D coordinates { x I , y I , z I } in the XYZ acquisition frame. The 3D positions { x A 1 , y A 1 , z A 1 } and { x A 2 , y A 2 , z A 2 } of A 1 and A 2 somatas defined the Voronoi axis, documentclass[12pt]{minimal} usepackage{amsmath} usepackage{wasysym} usepackage{amsfonts} usepackage{amssymb} usepackage{amsbsy} usepackage{mathrsfs} usepackage{upgreek} setlength{oddsidemargin}{-69pt} begin{document}$$overrightarrow {A_1A_2}$$end{document} A 1 A 2 → being set as axis orientation vector. The Voronoi plane was defined as the plane perpendicular to the Voronoi axis and passing through the astrocyte pair midpoint M defined as the center of the [ A 1 A 2 ] segment. Interface 3D coordinates were then expressed in the Voronoi frame and fitted with a 2D polynomial function (see Supplementary Fig. S5 ). The resulting fitting plane was defined as the interface plane. The angle between the Voronoi plane and the interface plane was computed (orientation parameter) together with the ratio of interface points above the Voronoi plane (bias parameter). The interface plane and a corresponding normal vector were used to define the interface frame. 3D interface coordinates were in turn expressed in the interface frame and fitted with a biharmonic surface model. Interfaces were then semi-automatically detoured and amplitude and gradient maps were generated. All interface computations were done using Matlab (Mathworks, USA). Neuron tracing Neurite tracing in Fig. 5 was done using the Imaris Filament Tracer tool, IMARIS v9.2 (Bitplane, Switzerland).
Quantitative topography with triple-AAV projection labeling
A pipeline for quantifying neuronal projection color maps was adapted from previously described methods designed for serial two-photon microscopy-based monochrome image analysis 23 , 24 , 27 , as follows. After spectral unmixing, fluorescence signal was separated from background for each channel. Square root transform followed by histogram matching was applied to intensity images for contrast enhancement and standardization prior to segmentation. Florescence signal was then separated from background using an intensity-based clustering algorithm (multi-Otsu) 67 combined with connected component labeling (see Supplementary Fig. 8 ). For each channel, the segmented binary mask was transformed into a color-exclusive mask by excluding signal pixels shared with other channels. Color-exclusive projection strength maps were then generated by computing the ratio of signal pixels over background in 30 × 30 pixel-size non-overlapping adjacent super-pixels. Finally, red, green and blue projection strength maps were combined onto RGB interdigitation maps (see Supplementary Fig. 9 ). Projection strength maps were generated together with confidence maps to account for quantification errors due to multi-channel pixel exclusion. Confidence maps were computed as the ratio of exclusive signal pixels over the total number of signal pixels in the 30 × 30 pixel-size super-pixels (see Supplementary Fig. 10 ). For quantitative analyses of cortical projections in the striatum (Fig. 6i, j ), the striatal area was first manually detoured based on the Allen Brain reference atlas and associated interdigitation maps were generated (see Supplementary Movie 14 ). Within each super-pixel, the relative contribution of red, green, and blue projection strength was calculated and the distance to seven reference points in the RGB color space ([1 0 0], [0 1 0], [0 0 1], [0.5 0.5 0], [0 0.5 0.5], [0.5 0 0.5], [0.33 0.33 0.33]) was calculated. Each super-pixel was classified in the category minimizing the distance in the RGB color space. This enabled to identify super-pixels containing single, dual and triple projections. For the analysis of cortical axons arbors in the caudoputamen (Fig. 6i ), masks encompassing arborizing axons and terminals and excluding fiber tracts and ventral striatal areas were manually detoured. For the analysis of corticofugal tracts (Fig. 6j ), the complementary masks encompassing passing fibers were used. Since tracts exhibited systematically high signal levels at their center, this resulted in residual spectral bleed-through despite the linear unmixing procedure which was manually removed. Non-exclusive interdigitation masks were considered for this analysis of fiber tract interdigitation, since it probes larger structures than that of axonal arbors interdigitation. All the analyses were implemented using custom-written Matlab (Mathworks,USA) scripts and Fiji 64 (NIH,USA).
Supplementary information Supplementary Information Peer Review File Description of Additional Supplementary Files Supplementary Movie 1 Supplementary Movie 2 Supplementary Movie 3 Supplementary Movie 4 Supplementary Movie 5 Supplementary Movie 6 Supplementary Movie 7 Supplementary Movie 8 Supplementary Movie 9 Supplementary Movie 10 Supplementary Movie 11 Supplementary Movie 12 Supplementary Movie 13 Supplementary Movie 14
📊 Figures
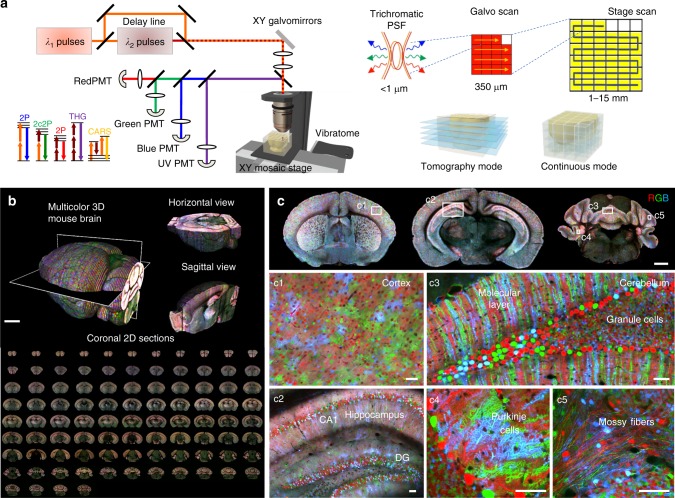
Fig. 1
ChroMS microscopy principle and application for brain-wide multicolor imaging. a ChroMS imaging principle and setup (see Methods). b 3D views from a whole CAG-Cytbow; Nestin-Cre mouse brain (10.5u2009...
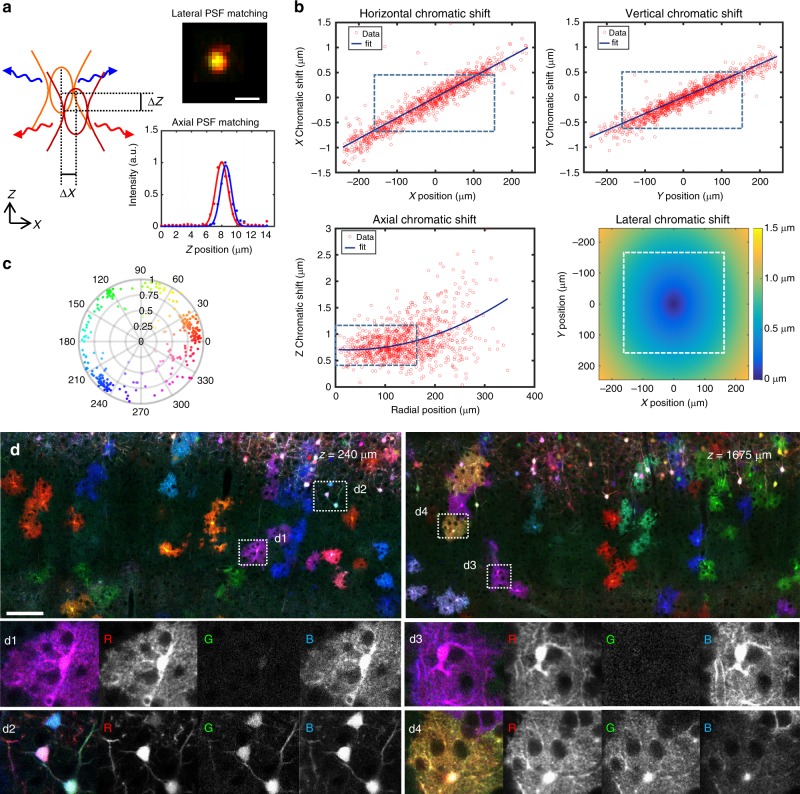
Fig. 2
Submicrometer-scale channel registration over millimeter-scale volumes. ChroMS provides multicolor excitation in the 850u20131100u2009nm range with 20) spanning the HSV color space can be distinguishe...
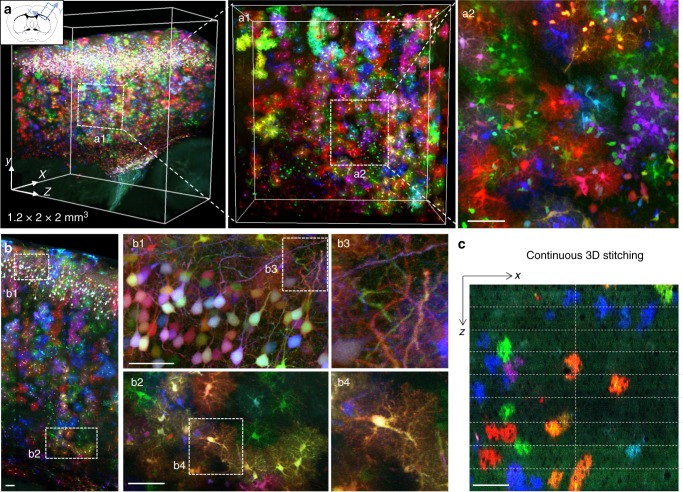
Fig. 3
Continuous 3D multicolor imaging of mouse cortical tissue. a Multicolor 3D micrometric imaging of a 1.2u2009u00d7u20092u2009u00d7u20092u2009mm 3 volume of a P65 mouse cerebral cortex with ChroMS micro...
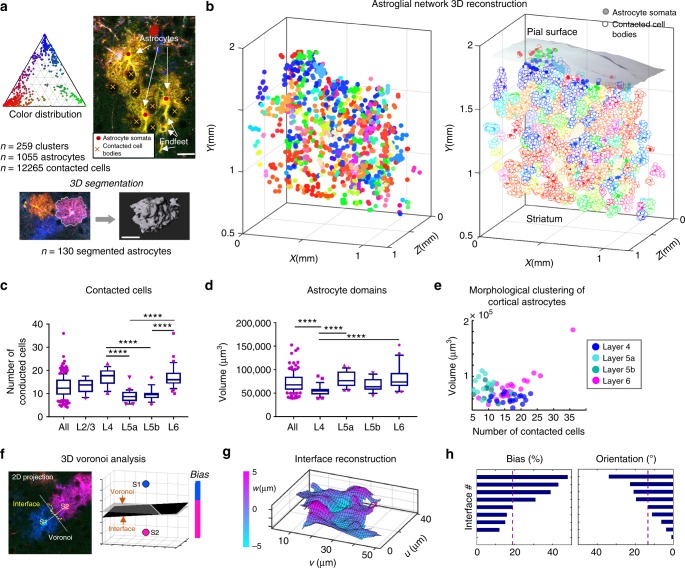
Fig. 4
3D analysis of cortical astrocyte morphology and heterogeneity across layers. a Colorimetric and morphological analyses performed on labeled astrocyte in the multicolor dataset shown in Fig. 3 . Top l...
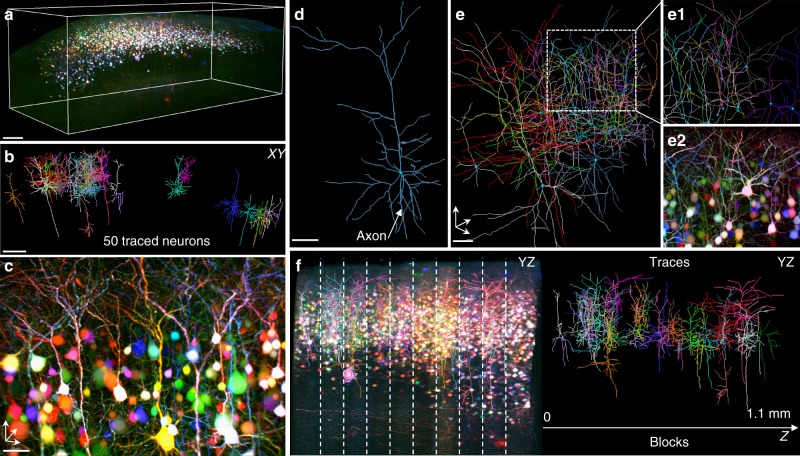
Fig. 5
Dense tracing of multicolor-labeled cortical pyramidal neurons. a 3D view of a 2.6u2009u00d7u20090.9u2009u00d7u20091.1u2009mm 3 portion of cerebral cortex electroporated at E15 with a CAG-Cytbow trans...
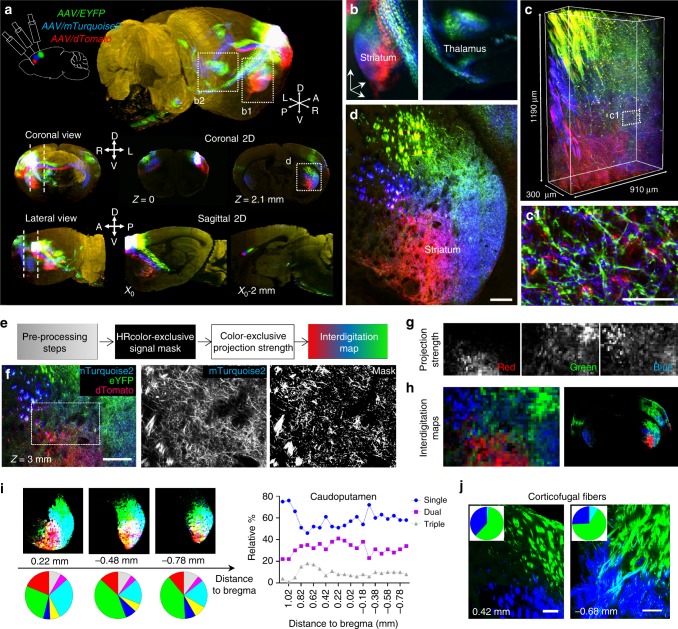
Fig. 6
Brain-wide multiplexed projection mapping with ChroMS microscopy. a Brain-wide mapping of neural projections using tricolor AAV anterograde labeling and ChroMS imaging. 3D, coronal and sagittal views ...
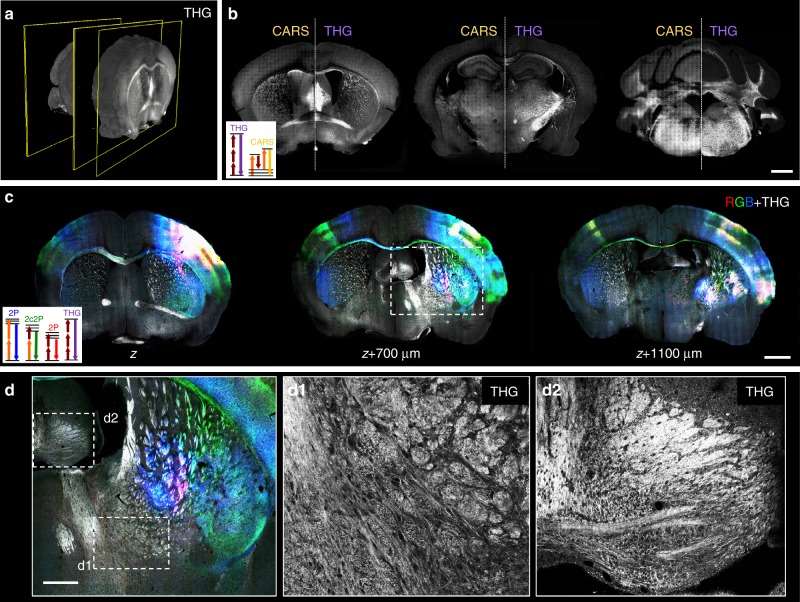
Fig. 7
Brain-wide multimodal imaging using endogenous nonlinear contrasts. a , b Label-free THG-CARS serial imaging. a Coronal 3D view from the brain-wide THG channel. b Representative coronal sections showi...
Figure images are served from the NIH/NLM PubMed Central Open Access Subset or Europe PMC; copyright remains with the publishers and authors.
💬 Discussion
0 commentsNo comments yet. Be the first to start a discussion!
Leave a Comment