Abstract
DNA point accumulation for imaging in nanoscale topography (PAINT) is a rapidly developing fluorescence super-resolution technique, which allows for reaching spatial resolutions below 10 nm. It also enables the imaging of multiple targets in the same sample. However, using DNA-PAINT to observe cellular structures at such resolution remains challenging. Antibodies, which are commonly used for this purpose, lead to a displacement between the target protein and the reporting fluorophore of 20⁻25 nm, thus limiting the resolving power. Here, we used nanobodies to minimize this linkage error to ~4 nm. We demonstrate multiplexed imaging by using three nanobodies, each able to bind to a different family of fluorescent proteins. We couple the nanobodies with single DNA strands via a straight forward and stoichiometric chemical conjugation. Additionally, we built a versatile computer-controlled microfluidic setup to enable multiplexed DNA-PAINT in an efficient manner. As a proof of principle, we labeled and imaged proteins on mitochondria, the Golgi apparatus, and chromatin. We obtained super-resolved images of the three targets with 20 nm resolution, and within only 35 minutes acquisition time.
🔬 Techniques
🧬 Organisms
✨ Fluorophores
🧪 Sample Preparation
🔬 Cell Lines
🏭 Microscope Brands
🧪 Reagent Suppliers
📷 Detectors
💻 Software Details
💾 Data Repositories
🏛️ Research Organizations (ROR)
Affiliated research institutions:
📋 Methods
2.1. Nanobody Coupling to Docking Oligo The unconjugated nanobodies FluoTag ® -Q anti-GFP, FluoTag ® -Q anti-RFP, and the FluoTag ® -Q anti-TagBFP (NanoTag Biotechnologies GmbH, Göttingen, Germany, Cat. No: N0301, N0401, and N0501, respectively) carry one ectopic cysteine at the C-terminus then allowing for chemical couplings via a thiol reactive compound. The DNA docking strands (Biomers GmbH, Ulm, Germany) were functionalized with an azide group at 5′-end and, in some cases, Atto488 fluorophore at the 3′-end. The coupling of the docking strands to the nanobodies were performed following the procedure from Schlichthärle and colleagues [ 34 ], with minor modifications. In brief, 15 to 20 nmol of nanobodies in phosphate buffer saline (PBS, 127 mM NaCl, 10 mM Na 2 HPO 4 , 2.7 mM KCl, 0.2 mM KH 2 PO 4 , pH7.4) were incubated with a final concentration of 5 mM TCEP (Sigma-Aldrich, Zwijndrecht, The Netherlands) for 2 h at 4 °C to reduce the ectopic cysteine. Afterwards, the excess of TCEP was removed by exchanging the buffer to PBS pH 6.5 using spin Amicon filters with a MWCO of 10 kDa (Merck/EMD Millipore, Molsheim, France, Cat. No. UFC501096). The reduced TCEP-free nanobodies were immediately mixed with 50 molar excess of maleimide-DBCO crosslinker (Sigma-Aldrich, Cat. No. 760668) and incubated overnight at 4 °C with mild stirring. The excess of DBCO crosslinker in the buffer was exchanged to PBS pH 7.4 using Amicon Filters (Molecular weight cut-off 10 kDa) as described previously. Azide functionalized docking strands were added (in 10 molar excess as performed also in [ 25 ]) to the crosslinker-coupled nanobody and incubated at room temperature for ~2 h with slow head-to-tail shaking. The excess of docking strands was then removed from the conjugated nanobodies using size exclusion chromatography (Superdex 75 Increase 10/300 column, Cat. No: 29148721) and ÄKTA pure 25 system (GE Healthcare life science, Chicago, Ill, USA). The correct fractions of labeled nanobodies were then identified by the SDS-PAGE followed by SYBR GOLD staining (Thermo Fisher, Waltham, MA, USA, Cat No: S11494). The docking strands sequences used for the assay were taken from Agasti et al [ 8 ]. FluoTag ® -Q anti-GFP was coupled to P1 * sequence (5′-CTAGATGTAT-Atto488-3′), FluoTag ® -Q anti-RFP was coupled to P2 * (5′-TATGTAGATC-3′), and the FluoTag ® -Q anti-TagBFP was coupled to P3* (5′-GTAATGAAGA-3′). Imager strands were labeled with Atto655 fluorophore at the 3′ end. 2.2. Immunostaining COS-7 cells were cultured in Dulbecco modified Eagle medium (DMEM) with 4 mM l-glutamine and 10% fetal calf serum (Thermo Fisher Scientific), supplemented with 60 U/mL of penicillin and 0.06 mg/mL streptomycin (Sigma-Aldrich) at 37 °C and 5% CO 2 . Prior immunostaining and imaging, ca. 20,000 cells/well, were plated in 8-well chamber (155411PK, Thermo Fisher Scientific). The next day, the cells were transfected using 2.5% lipofectamine 2000 ® and 300 ng of plasmid in Optimem medium (Thermo Fisher Scientific). After incubation of ca. for 16 h, the cells were fixed using 4% paraformaldehyde (PFA) for 30 min at room temperature. The remaining aldehydes were quenched with 0.1 M glycine in PBS for 30 min. Afterwards, cells were permeabilized and blocked using 3% bovine serum albumin (4) and 0.1% Triton X-100 in PBS for 30 min at room temperature. Buffer solution containing nanobodies coupled to the docking strand (50 nM) was used to stain the cells. For this purpose, we proceeded with incubation of 1 h at room temperature, with slow orbital shaking. Finally, the cells were rinsed with PBS and then post-fixed with 4% PFA for 30 min at the room temperature. As described previously, remaining aldehydes were quenched with 0.1 M glycine in PBS. Cells were stored in PBS buffer at 4 °C. 2.3. Exchange PAINT Experiment The imager strands P1 5′-CTAGATGTAT-3′-Atto655, P2 5′-TATGTAGATC-3′-Atto655, and P3 5′-GTAATGAAGA-3′-Atto655 (Eurofins Genomics) were aliquoted in TE buffer (Tris 10 mM, EDTA 1 mM, pH 8.0) at a concentration of 100 μM and stored at −20 °C. Prior to the experiment, the strands were diluted to the final concentration of 2 nM in PBS buffer, containing 500 mM NaCl. A chamber with eight wells (155411PK, Thermo Fisher Scientific) was fixed on the microscope stage with clips. A PDMS layer was used as a chamber cover and supported the inlet tubes and a tube for suction. The slide was held on the microscope stage for 0.5 h before the acquisition to equilibrate to the room temperature and achieve mechanical stability. Injection of fluids and its removal was done using our custom-built microfluidic setup, designed and constructed particularly for the Exchange PAINT experiment. First, the well was rinsed twice with 500 µL PBS buffer (pH 8.0, NaCl 500 mM). Then, suitable cells for imaging were selected based on the presence of the signal from the expressed fluorescent proteins: mTagBFP, mCherry, and EGFP. The cells were located by exposing them to the following laser excitation wavelengths and detecting the fluorescence in the corresponding emission channel: mTagBFP-405 nm laser, EGFP-488 nm laser, and mCherry-561 nm laser. A HILO-illumination scheme was used to excite the cells. The laser power was adjusted according to the sample brightness (respectively 0.5 mW, 1 mW, and 2 mW at the output of the optical fiber). Each selection movie of the fluorescent proteins included between 200–250 frames (Figure 4A1–A3). Afterwards, we proceeded with Exchange PAINT on the selected cell. All the solutions were injected into the cell by applying air pressure in the corresponding pressurized tube. First, imager strand P1 (2 nM) in PBS buffer (500 µL) was injected into the well and incubated for 10 min before the acquisition. Typical DNA-PAINT movie included 21,000 frames (corresponds to 35 min). The following acquisition settings for the emCCD camera was used: Exposure time 100 ms, pre-amplifier gain 3.0, EM gain 10. The laser 638 nm was set to 10–15 mW (corresponds to an excitation illumination power density of 0.4–0.6 kW/cm 2 ). After PAINT movie acquisition, an extensive wash of the well was performed (4–6 times volume exchange, in total about 3 mL buffer within 5 min), in order to remove the imager solution from the well completely. Suction was performed by the micro peristaltic pump (Makeblock) After the extensive wash, the next imager solution was introduced. We proceeded with the same solution exchange procedure also for the imagers P2 and P3 (see comprehensive chart in Figure 3B). All the experiments were carried out at a constant temperature of 22 ± 1 °C, which was crucial for the mechanical stability of the sample (remaining mechanical drifts were corrected for during the analysis). 2.4.
Show full methods section
2.1. Nanobody Coupling to Docking Oligo The unconjugated nanobodies FluoTag ® -Q anti-GFP, FluoTag ® -Q anti-RFP, and the FluoTag ® -Q anti-TagBFP (NanoTag Biotechnologies GmbH, Göttingen, Germany, Cat. No: N0301, N0401, and N0501, respectively) carry one ectopic cysteine at the C-terminus then allowing for chemical couplings via a thiol reactive compound. The DNA docking strands (Biomers GmbH, Ulm, Germany) were functionalized with an azide group at 5′-end and, in some cases, Atto488 fluorophore at the 3′-end. The coupling of the docking strands to the nanobodies were performed following the procedure from Schlichthärle and colleagues [ 34 ], with minor modifications. In brief, 15 to 20 nmol of nanobodies in phosphate buffer saline (PBS, 127 mM NaCl, 10 mM Na 2 HPO 4 , 2.7 mM KCl, 0.2 mM KH 2 PO 4 , pH7.4) were incubated with a final concentration of 5 mM TCEP (Sigma-Aldrich, Zwijndrecht, The Netherlands) for 2 h at 4 °C to reduce the ectopic cysteine. Afterwards, the excess of TCEP was removed by exchanging the buffer to PBS pH 6.5 using spin Amicon filters with a MWCO of 10 kDa (Merck/EMD Millipore, Molsheim, France, Cat. No. UFC501096). The reduced TCEP-free nanobodies were immediately mixed with 50 molar excess of maleimide-DBCO crosslinker (Sigma-Aldrich, Cat. No. 760668) and incubated overnight at 4 °C with mild stirring. The excess of DBCO crosslinker in the buffer was exchanged to PBS pH 7.4 using Amicon Filters (Molecular weight cut-off 10 kDa) as described previously. Azide functionalized docking strands were added (in 10 molar excess as performed also in [ 25 ]) to the crosslinker-coupled nanobody and incubated at room temperature for ~2 h with slow head-to-tail shaking. The excess of docking strands was then removed from the conjugated nanobodies using size exclusion chromatography (Superdex 75 Increase 10/300 column, Cat. No: 29148721) and ÄKTA pure 25 system (GE Healthcare life science, Chicago, Ill, USA). The correct fractions of labeled nanobodies were then identified by the SDS-PAGE followed by SYBR GOLD staining (Thermo Fisher, Waltham, MA, USA, Cat No: S11494). The docking strands sequences used for the assay were taken from Agasti et al [ 8 ]. FluoTag ® -Q anti-GFP was coupled to P1 * sequence (5′-CTAGATGTAT-Atto488-3′), FluoTag ® -Q anti-RFP was coupled to P2 * (5′-TATGTAGATC-3′), and the FluoTag ® -Q anti-TagBFP was coupled to P3* (5′-GTAATGAAGA-3′). Imager strands were labeled with Atto655 fluorophore at the 3′ end. 2.2. Immunostaining COS-7 cells were cultured in Dulbecco modified Eagle medium (DMEM) with 4 mM l-glutamine and 10% fetal calf serum (Thermo Fisher Scientific), supplemented with 60 U/mL of penicillin and 0.06 mg/mL streptomycin (Sigma-Aldrich) at 37 °C and 5% CO 2 . Prior immunostaining and imaging, ca. 20,000 cells/well, were plated in 8-well chamber (155411PK, Thermo Fisher Scientific). The next day, the cells were transfected using 2.5% lipofectamine 2000 ® and 300 ng of plasmid in Optimem medium (Thermo Fisher Scientific). After incubation of ca. for 16 h, the cells were fixed using 4% paraformaldehyde (PFA) for 30 min at room temperature. The remaining aldehydes were quenched with 0.1 M glycine in PBS for 30 min. Afterwards, cells were permeabilized and blocked using 3% bovine serum albumin (4) and 0.1% Triton X-100 in PBS for 30 min at room temperature. Buffer solution containing nanobodies coupled to the docking strand (50 nM) was used to stain the cells. For this purpose, we proceeded with incubation of 1 h at room temperature, with slow orbital shaking. Finally, the cells were rinsed with PBS and then post-fixed with 4% PFA for 30 min at the room temperature. As described previously, remaining aldehydes were quenched with 0.1 M glycine in PBS. Cells were stored in PBS buffer at 4 °C. 2.3. Exchange PAINT Experiment The imager strands P1 5′-CTAGATGTAT-3′-Atto655, P2 5′-TATGTAGATC-3′-Atto655, and P3 5′-GTAATGAAGA-3′-Atto655 (Eurofins Genomics) were aliquoted in TE buffer (Tris 10 mM, EDTA 1 mM, pH 8.0) at a concentration of 100 μM and stored at −20 °C. Prior to the experiment, the strands were diluted to the final concentration of 2 nM in PBS buffer, containing 500 mM NaCl. A chamber with eight wells (155411PK, Thermo Fisher Scientific) was fixed on the microscope stage with clips. A PDMS layer was used as a chamber cover and supported the inlet tubes and a tube for suction. The slide was held on the microscope stage for 0.5 h before the acquisition to equilibrate to the room temperature and achieve mechanical stability. Injection of fluids and its removal was done using our custom-built microfluidic setup, designed and constructed particularly for the Exchange PAINT experiment. First, the well was rinsed twice with 500 µL PBS buffer (pH 8.0, NaCl 500 mM). Then, suitable cells for imaging were selected based on the presence of the signal from the expressed fluorescent proteins: mTagBFP, mCherry, and EGFP. The cells were located by exposing them to the following laser excitation wavelengths and detecting the fluorescence in the corresponding emission channel: mTagBFP-405 nm laser, EGFP-488 nm laser, and mCherry-561 nm laser. A HILO-illumination scheme was used to excite the cells. The laser power was adjusted according to the sample brightness (respectively 0.5 mW, 1 mW, and 2 mW at the output of the optical fiber). Each selection movie of the fluorescent proteins included between 200–250 frames (Figure 4A1–A3). Afterwards, we proceeded with Exchange PAINT on the selected cell. All the solutions were injected into the cell by applying air pressure in the corresponding pressurized tube. First, imager strand P1 (2 nM) in PBS buffer (500 µL) was injected into the well and incubated for 10 min before the acquisition. Typical DNA-PAINT movie included 21,000 frames (corresponds to 35 min). The following acquisition settings for the emCCD camera was used: Exposure time 100 ms, pre-amplifier gain 3.0, EM gain 10. The laser 638 nm was set to 10–15 mW (corresponds to an excitation illumination power density of 0.4–0.6 kW/cm 2 ). After PAINT movie acquisition, an extensive wash of the well was performed (4–6 times volume exchange, in total about 3 mL buffer within 5 min), in order to remove the imager solution from the well completely. Suction was performed by the micro peristaltic pump (Makeblock) After the extensive wash, the next imager solution was introduced. We proceeded with the same solution exchange procedure also for the imagers P2 and P3 (see comprehensive chart in Figure 3B). All the experiments were carried out at a constant temperature of 22 ± 1 °C, which was crucial for the mechanical stability of the sample (remaining mechanical drifts were corrected for during the analysis). 2.4.
DNA-PAINT Movies Analysis Raw
DNA-PAINT movies were analyzed using the Picasso software package [ 10 ]. In the end, drift-corrected super-resolution images were reconstructed, and the average localization accuracy was estimated. For further analysis of the achieved image resolution, the Fourier Ring Correlation (FRC) [ 35 ] technique was employed. First, localization events were detected using Picasso: Localize. For the specific binding-events recognition, the signal box size length was set to 7 pixels and the minimum net gradient was limited to the range of 1700 to 3500 (depends on the protein expression level in a particular cell). Then, the localized bright spots were fitted with the LQ Gaussian method to obtain precise fluorophore coordinates. The total number of localization events varied from 150,000 to 2,500,000 for the whole movie. The output file with the localization coordinates was then loaded into Picasso: Render. Using the Undrift RCC feature (segmentation 500 frames), movies were corrected for mechanical drift. The final reconstructed super-resolved images were exported in PNG format. Finally, all three reconstructed images of different organelles were merged together for each imaged cell using ImageJ [ 36 ], see Figure 4 C1,C2, D1–D3. The average localization precision (NeNa [ 37 ]) was estimated for each reconstructed super-resolved image. For image resolution quantification, Fourier Ring Correlation (FRC) [ 35 ] was applied using the FIRE ImageJ plugin [ 38 ], for detailed numbers see Supplementary Information, Table S1 . Further image resolution analysis was performed by creating a resolution map using SQUIRREL [ 39 ] (super-resolution quantitative image rating and reporting of error locations), see Figure S4 in the Supplementary Information .
📊 Figures
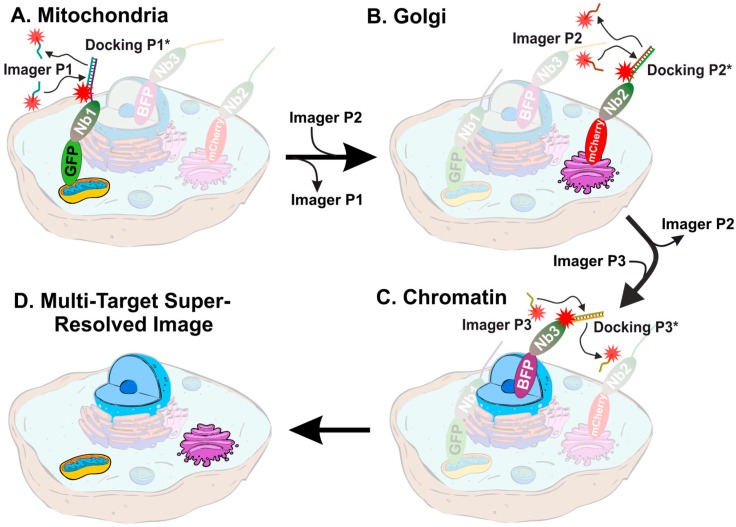
Figure 1
Schematic representation of multi-target exchange point accumulation for imaging in nanoscale topography (PAINT) in COS-7 cells. Sequential introduction of imager strands with different sequences reve...
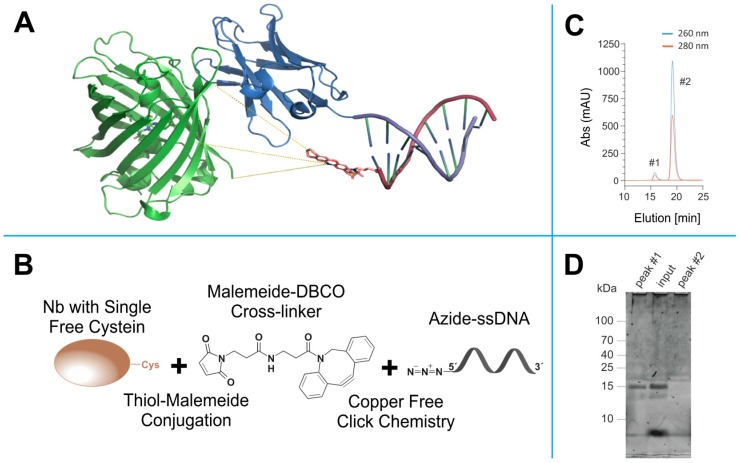
Figure 2
Click- and thiol-based strategy to conjugate nanobodies to a docking DNA strand for DNA-PAINT. ( A ) Anti-GFP nanobody (blue) bound to EGFP (green). The nanobody is modified with a docking stand with ...
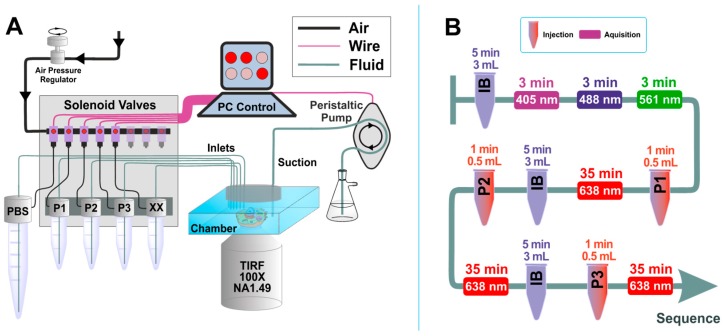
Figure 3
Scheme of custom-built microfluidics setup and Exchange PAINT experiment. ( A ) Microfluidics setup: The setup is controlled by a computer software, which includes both manual and automated operation ...
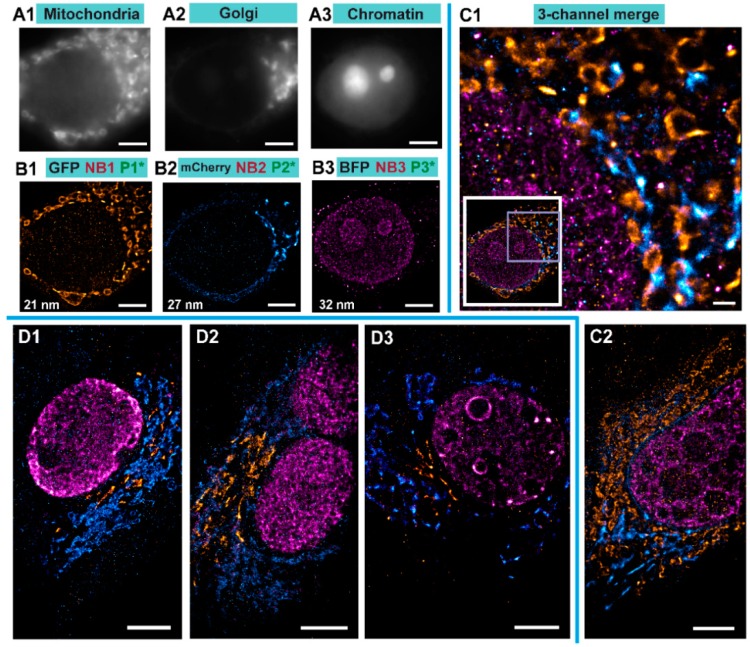
Figure 4
Exchange PAINT imaging. A1 u2013 A3 Diffraction-limited wide-field images of individual target fluorophores: Mitochondria with TOM70-EGFP ( A1 ), Golgi with GalNacT-mCherry ( A2 ), Chromatin with H2B-...
Figure images are served from the NIH/NLM PubMed Central Open Access Subset or Europe PMC; copyright remains with the publishers and authors.
💬 Discussion
0 commentsNo comments yet. Be the first to start a discussion!
Leave a Comment