Abstract
A planar slab of negative-index material works as a superlens with sub-diffraction-limited resolution, as propagating waves are focused and, moreover, evanescent waves are reconstructed in the image plane. Here we demonstrate a superlens for electric evanescent fields with low losses using perovskites in the mid-infrared regime. The combination of near-field microscopy with a tunable free-electron laser allows us to address precisely the polariton modes, which are critical for super-resolution imaging. We spectrally study the lateral and vertical distributions of evanescent waves around the image plane of such a lens, and achieve imaging resolution of λ/14 at the superlensing wavelength. Interestingly, at certain distances between the probe and sample surface, we observe a maximum of these evanescent fields. Comparisons with numerical simulations indicate that this maximum originates from an enhanced coupling between probe and object, which might be applicable for multifunctional circuits, infrared spectroscopy and thermal sensors.
🔬 Techniques
🧪 Sample Preparation
🏭 Microscope Brands
💻 Software Details
🏛️ Research Organizations (ROR)
Affiliated research institutions:
📋 Methods
Growth and absorption losses of perovskite oxides The various thin films were grown by pulsed laser deposition. Thin films of SrRuO 3 were grown at 680 °C and films of BiFeO 3 and SrTiO 3 were grown at 700 °C in 100 mTorr of oxygen 55 . Following the growth of the SrRuO 3 layer, features were defined using photo-lithography and samples were ion-milled to produce the objects; subsequently, BiFeO 3 and SrTiO 3 films were grown. Films were found to be single phase and fully epitaxial in all cases via X-ray diffraction and transmission electron microscopy. To compare the absorption of our perovskite-based superlens with former materials used, we calculate the ratios n / κ with n and κ being the real and imaginary parts of the refractive index at the wavelengths for which superlensing is expected. Larger n / κ corresponds to less material absorption losses. For SrTiO 3 this ratio is 12.7×10 −2 , three times larger than for SiC and silver, which both show a n / κ of about 4.2×10 −2 at their corresponding superlensing wavelengths 18 17 . Note that the superlensing condition for the perovskite-based superlenses is fulfilled for ɛ SrTiO 3 ≅−2, whereas for the SiC and silver superlens it was observed around ɛ ≅−3. However, even when ɛ SrTiO3 ≅−3 at λ =14.7 μm, we find n / κ =10.5×10 −2 being much larger than for the other superlenses. s-NSIM setup In s-NSIM, a scattering probe, namely a metal-coated atomic-force microscope tip with a typical radius of 50 nm, is placed close to the sample surface 34 35 . This probe transforms the evanescent fields into propagating waves, which can be detected in the far-field 34 56 . To separate the near-field from the much larger far-field signal, we use the method of higher-harmonic demodulation 56 57 : in tapping-mode atomic-force microscope, the distance between tip and sample is modulated with small amplitudes of about 30 nm at frequencies around Ω=150 kHz. On this scale, the far-field changes linearly with distance resulting in a modulation with the same frequency Ω. On the other hand, evanescent waves depend non-linearly on the distance, resulting in a modulation at n Ω ( n =1,2,3,...). Hence, when filtering the modulated signal at n Ω with n ≥2, at higher harmonics, we obtain near-field components only, with less far-field contributions for larger orders of n . If not stated otherwise, the near-field signals shown in this paper represent third-harmonic signals NF 3Ω to ensure pure near-field examination. For comparisons at different wavelengths, we nomalize NF 3Ω to the current laser power and to the spectral response of detector and optical elements in the beam path. Our investigation was performed using the free-electron laser FELBE at the Helmholtz-Zentrum Dresden-Rossendorf (www.hzdr.de), Germany, which offers continuous tunability across a wavelength range of 4–250 μm at an average power of up to 10 W (delivered as a picosecond pulse train at a repetition rate of 13 MHz). In the 10–20 μm wavelength regime, the typical spectral full width at half maximum (FWHM) of the FEL is 50–100 nm. Near-field interaction and probe-sample coupling When imaging a superlensed signal by s-NSIM, the near-field probe can not be assumed to be a passive element only, but the coupling between probe and objects needs to be taken into account. The origin of the coupling lies in the optical interaction principle of NSIM, which results in the consequences for the NSIM examination of superlenses as discussed in the following. In our s-NSIM and the similar one used in ref. 18 , the probe-sample system is illuminated from the probe side and, hence, the initial near field is generated by the probe rather than by the sample. The function of the probe is two-fold: first, the evanescent waves arising from the probe illuminate the sample locally and excite modes in the sample and on its surface. Second, the probe senses the fields of the sample modes and transforms them by scattering into propagating waves, which can be detected in the far-field. This probe-sample interaction depends on the scattering behaviour of the probe, the local optical properties of the sample, as well as the distance between the probe and the sample surface. As a first-order approximation, it can be described by the dipole model introduced by Knoll and Keilmann 56 : here, the s-NSIM signal is described by scattering in the near-field coupled probe-object system represented through an effective polarizability. A more sophisticated approach describes the probe-sample interaction through higher-order modes 58 showing the same qualitative results. A critical point for successful NSIM measurements is that the probe properties and illumination are kept constant during the measurements, therefore the changes in the near-field signal are essentially caused by local sample properties. In our study, we particularly keep the position of the probe fixed while the sample is scanned to ensure constant illumination. The probe properties like material, geometry and orientation with respect to the polarization of the incident light are fixed as well. Hence, the observed contrast arises from changes in the sample only. The influence of probe or object properties are enhanced, when either one of the two is excited close to its resonances. In the mid-infrared, a metallic probe shows no distinct resonances, whereas the samples discussed in our work support polariton resonances. Hence, it is the sample that determines the NSIM signal, whereas the tip acts solely as a small optical dipole. In the case of a superlens as the sample, the near-field interaction is extended: at the superlensing wavelength, the evanescent waves arising from the probe are transferred to the object plane. The objects are excited by these waves and generate additional evanescent fields, which are reconstructed by the superlens on the image side of the sample. Finally, the near-field signal at the image plane is transformed by the probe into detectable propagating waves. As the observed signal depends strongly on the properties of the superlens as well as the positions of both scatterers, probe and object, with respect to the superlens slab, we call this effect a superlens-enhanced probe-object interaction. Besides the superlens-enhanced interaction between probe and objects, the probe can also interact with the surface layer of the superlens, which is in our case either BiFeO 3 or SrTiO 3 for the symmetric or asymmetric superlens, respectively. We observe enhanced near-field signals due to propagating polariton modes at the toplayer-air interface of the samples at wavelengths around 17 and 14.6 μm for symmetric and asymmetric superlens, respectively. Please note that, unlike the localized modes at the superlensing wavelength, this signal does not carry any information about the SrRuO 3 objects (see Figs 3 and 4 ).
Show full methods section
Growth and absorption losses of perovskite oxides The various thin films were grown by pulsed laser deposition. Thin films of SrRuO 3 were grown at 680 °C and films of BiFeO 3 and SrTiO 3 were grown at 700 °C in 100 mTorr of oxygen 55 . Following the growth of the SrRuO 3 layer, features were defined using photo-lithography and samples were ion-milled to produce the objects; subsequently, BiFeO 3 and SrTiO 3 films were grown. Films were found to be single phase and fully epitaxial in all cases via X-ray diffraction and transmission electron microscopy. To compare the absorption of our perovskite-based superlens with former materials used, we calculate the ratios n / κ with n and κ being the real and imaginary parts of the refractive index at the wavelengths for which superlensing is expected. Larger n / κ corresponds to less material absorption losses. For SrTiO 3 this ratio is 12.7×10 −2 , three times larger than for SiC and silver, which both show a n / κ of about 4.2×10 −2 at their corresponding superlensing wavelengths 18 17 . Note that the superlensing condition for the perovskite-based superlenses is fulfilled for ɛ SrTiO 3 ≅−2, whereas for the SiC and silver superlens it was observed around ɛ ≅−3. However, even when ɛ SrTiO3 ≅−3 at λ =14.7 μm, we find n / κ =10.5×10 −2 being much larger than for the other superlenses. s-NSIM setup In s-NSIM, a scattering probe, namely a metal-coated atomic-force microscope tip with a typical radius of 50 nm, is placed close to the sample surface 34 35 . This probe transforms the evanescent fields into propagating waves, which can be detected in the far-field 34 56 . To separate the near-field from the much larger far-field signal, we use the method of higher-harmonic demodulation 56 57 : in tapping-mode atomic-force microscope, the distance between tip and sample is modulated with small amplitudes of about 30 nm at frequencies around Ω=150 kHz. On this scale, the far-field changes linearly with distance resulting in a modulation with the same frequency Ω. On the other hand, evanescent waves depend non-linearly on the distance, resulting in a modulation at n Ω ( n =1,2,3,...). Hence, when filtering the modulated signal at n Ω with n ≥2, at higher harmonics, we obtain near-field components only, with less far-field contributions for larger orders of n . If not stated otherwise, the near-field signals shown in this paper represent third-harmonic signals NF 3Ω to ensure pure near-field examination. For comparisons at different wavelengths, we nomalize NF 3Ω to the current laser power and to the spectral response of detector and optical elements in the beam path. Our investigation was performed using the free-electron laser FELBE at the Helmholtz-Zentrum Dresden-Rossendorf (www.hzdr.de), Germany, which offers continuous tunability across a wavelength range of 4–250 μm at an average power of up to 10 W (delivered as a picosecond pulse train at a repetition rate of 13 MHz). In the 10–20 μm wavelength regime, the typical spectral full width at half maximum (FWHM) of the FEL is 50–100 nm. Near-field interaction and probe-sample coupling When imaging a superlensed signal by s-NSIM, the near-field probe can not be assumed to be a passive element only, but the coupling between probe and objects needs to be taken into account. The origin of the coupling lies in the optical interaction principle of NSIM, which results in the consequences for the NSIM examination of superlenses as discussed in the following. In our s-NSIM and the similar one used in ref. 18 , the probe-sample system is illuminated from the probe side and, hence, the initial near field is generated by the probe rather than by the sample. The function of the probe is two-fold: first, the evanescent waves arising from the probe illuminate the sample locally and excite modes in the sample and on its surface. Second, the probe senses the fields of the sample modes and transforms them by scattering into propagating waves, which can be detected in the far-field. This probe-sample interaction depends on the scattering behaviour of the probe, the local optical properties of the sample, as well as the distance between the probe and the sample surface. As a first-order approximation, it can be described by the dipole model introduced by Knoll and Keilmann 56 : here, the s-NSIM signal is described by scattering in the near-field coupled probe-object system represented through an effective polarizability. A more sophisticated approach describes the probe-sample interaction through higher-order modes 58 showing the same qualitative results. A critical point for successful NSIM measurements is that the probe properties and illumination are kept constant during the measurements, therefore the changes in the near-field signal are essentially caused by local sample properties. In our study, we particularly keep the position of the probe fixed while the sample is scanned to ensure constant illumination. The probe properties like material, geometry and orientation with respect to the polarization of the incident light are fixed as well. Hence, the observed contrast arises from changes in the sample only. The influence of probe or object properties are enhanced, when either one of the two is excited close to its resonances. In the mid-infrared, a metallic probe shows no distinct resonances, whereas the samples discussed in our work support polariton resonances. Hence, it is the sample that determines the NSIM signal, whereas the tip acts solely as a small optical dipole. In the case of a superlens as the sample, the near-field interaction is extended: at the superlensing wavelength, the evanescent waves arising from the probe are transferred to the object plane. The objects are excited by these waves and generate additional evanescent fields, which are reconstructed by the superlens on the image side of the sample. Finally, the near-field signal at the image plane is transformed by the probe into detectable propagating waves. As the observed signal depends strongly on the properties of the superlens as well as the positions of both scatterers, probe and object, with respect to the superlens slab, we call this effect a superlens-enhanced probe-object interaction. Besides the superlens-enhanced interaction between probe and objects, the probe can also interact with the surface layer of the superlens, which is in our case either BiFeO 3 or SrTiO 3 for the symmetric or asymmetric superlens, respectively. We observe enhanced near-field signals due to propagating polariton modes at the toplayer-air interface of the samples at wavelengths around 17 and 14.6 μm for symmetric and asymmetric superlens, respectively. Please note that, unlike the localized modes at the superlensing wavelength, this signal does not carry any information about the SrRuO 3 objects (see Figs 3 and 4 ).
Numerical simulations
The numerical simulation results presented in the manuscript are all based on the commercial finite-element solver COMSOL 3.5. Because of memory limitation, the simulation is performed in two dimensions. The extremities of the simulation domain are assigned scattering properties, which essentially mimic the necessary open boundary conditions. We modify the size of simulation domain and (local) meshes to ensure that the field variation is less than 1%. Such a convergence of the numerical simulation verifies that the boundary condition and meshing are assigned properly. The total mesh number is up to 450,000. For a workstation with 32G RAM memory and two dual CPUs (2.66 GHz), each simulation takes less than 2 min to converge and reach the relative tolerance of 10 −6 . To numerically retrieve the s-NSIM signal shown in Figure 5 , iterative simulations with varying tip positions are performed by combining a Matlab script with COMSOL. The near-field probe is made by gold, whose dielectric constant is taken by fitting the data from Johnson and Christy 59 . The probe is modelled as a triangle, whose tip angle is about 22° and tip apex is a half sphere with the diameter of 100 nm. The superlens consists of layers of BiFeO 3 and SrTiO 3 with thicknesses of 200 and 400 nm, respectively, and the dielectric constants are taken from literature 20 21 . The SrRuO 3 objects are assumed to be rectangles of 50 nm×4 μm with a dielectric constant of SrRuO 3 determined by Fourier transform infrared spectroscopy (see Supplementary Fig. S1 ). The system is illuminated by monochromatic light with an incident angle of 75°. To study the response of the system, we calculate the electric-field distribution at all positions of the system. We observe a field enhancement underneath the tip and at the superlens interfaces because of polariton excitation. The scattering cross-sections ( Fig. 5b ) as measured in the experiment are related to the integrated Poynting vector over a solid angle about 70° from the tip apex. Such a simulation is repeated for different tip positions, in direct analogy to the scanning process. To simulate the higher-harmonic demodulation, we calculate the gradient of the Poynting vector to obtain the first-harmonic signal. Consequently, the gradient of the first harmonic reflects the second-harmonic signal and so on 60 .
Supplementary Material Supplementary Information Supplementary Figures S1-S4.
📊 Figures
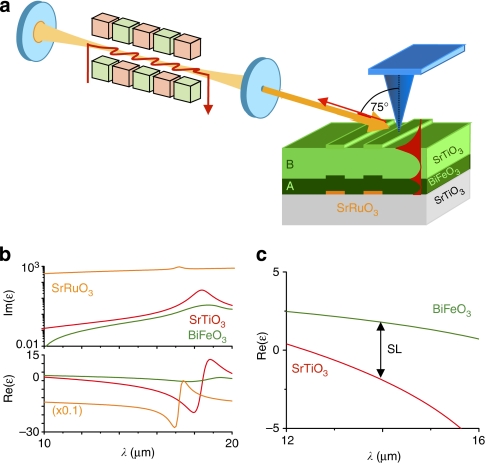
Figure 1
s-NSIM setup and perovskite properties.
( a ) Sketch of the experimental setup including the superlens, the geometry at the near-field probe (blue), and the free-electron laser light source. The superlens consists of the layers A (BiFeO 3 )...
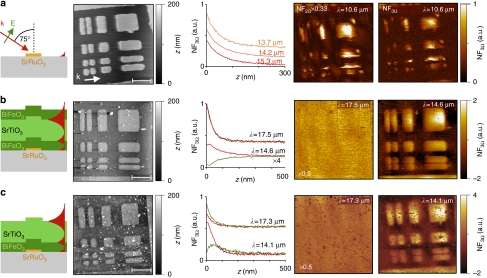
Figure 2
Near-field images of three different samples.
From left to right, the subfigures display: sketches of the sample, topography images obtained by atomic-force microscopy (scale bars, 10 u03bcm), near-field signals as functions of the probe-sample d...
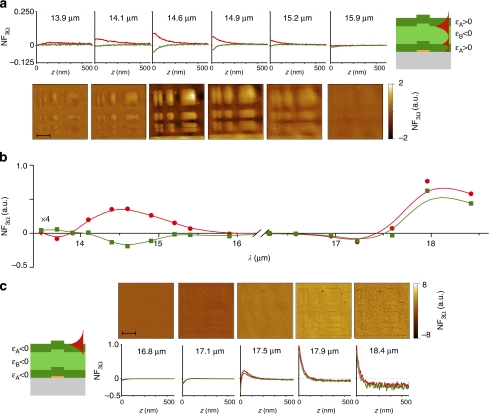
Figure 3
Spectral response of the symmetric superlens.
Near-field spectra as well as near-field images and NF 3u03a9 -distance curves for selected wavelengths (scale bars, 10 u03bcm). ( a ) For u03bb =13.9u201315.9 u03bcm, an imaging contrast exists becau...
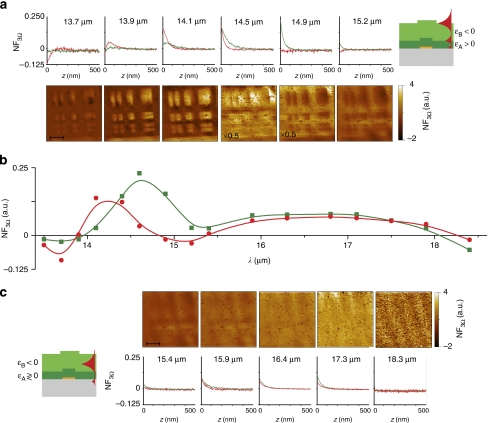
Figure 4
Spectral response of the asymmetric superlens.
Near-field spectra as well as near-field images and NF 3u03a9 -distance curves for selected wavelengths (scale bars,10 u03bcm). ( a ) For u03bb =13.7u201315.2 u03bcm, an imaging contrast exists becaus...
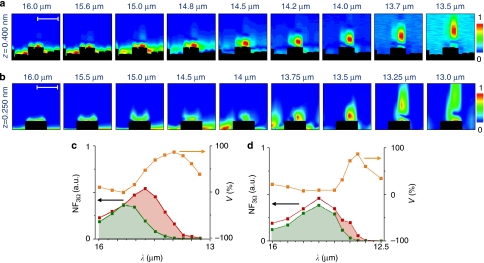
Figure 5
Normalized cross-sections on an asymmetric superlens.
( a ) Depicts experimental data, and ( b ) shows the results from numerical simulations (for details see text). The horizontal range in all cross-sections is 12 u03bcm (scale bars, 6 u03bcm). The topo...
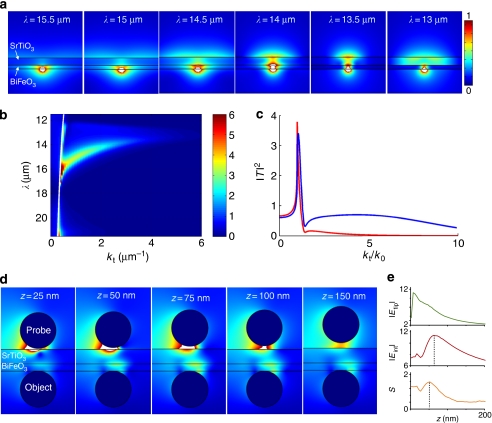
Figure 6
Simulations of electric field distributions and transfer function for the asymmetric superlens.
( a ) Planar superlens with a line source as object on one side for different wavelengths, showing a confined field on the image side of the lens for u03bb =13.5u201314 u03bcm due to superlensing (all...
Figure images are served from the NIH/NLM PubMed Central Open Access Subset or Europe PMC; copyright remains with the publishers and authors.
💬 Discussion
0 commentsNo comments yet. Be the first to start a discussion!
Leave a Comment