Abstract
We recently reported that centrosomal protein 164 (CEP164) regulates both cilia and the DNA damage response in the autosomal recessive polycystic kidney disease nephronophthisis. Here we examine the functional role of CEP164 in nephronophthisis-related ciliopathies and concomitant fibrosis. Live cell imaging of RPE-FUCCI (fluorescent, ubiquitination-based cell cycle indicator) cells after siRNA knockdown of CEP164 revealed an overall quicker cell cycle than control cells, although early S-phase was significantly longer. Follow-up FACS experiments with renal IMCD3 cells confirm that Cep164 siRNA knockdown promotes cells to accumulate in S-phase. We demonstrate that this effect can be rescued by human wild-type CEP164, but not disease-associated mutants. siRNA of CEP164 revealed a proliferation defect over time, as measured by CyQuant assays. The discrepancy between accelerated cell cycle and inhibited overall proliferation could be explained by induction of apoptosis and epithelial-to-mesenchymal transition. Reduction of CEP164 levels induces apoptosis in immunofluorescence, FACS and RT-QPCR experiments. Furthermore, knockdown of Cep164 or overexpression of dominant negative mutant allele CEP164 Q525X induces epithelial-to-mesenchymal transition, and concomitant upregulation of genes associated with fibrosis. Zebrafish injected with cep164 morpholinos likewise manifest developmental abnormalities, impaired DNA damage signaling, apoptosis and a pro-fibrotic response in vivo. This study reveals a novel role for CEP164 in the pathogenesis of nephronophthisis, in which mutations cause ciliary defects coupled with DNA damage induced replicative stress, cell death, and epithelial-to-mesenchymal transition, and suggests that these events drive the characteristic fibrosis observed in nephronophthisis kidneys.
🔬 Techniques
💻 Software
✨ Fluorophores
🧪 Sample Preparation
🔬 Cell Lines
🏭 Microscope Brands
🧪 Reagent Suppliers
💻 Software Details
🏛️ Research Organizations (ROR)
Affiliated research institutions:
📋 Methods
Ethics statement
Renal epithelial cells were obtained from a nephronophthisis patient that had been included in the AGORA (Aetiologic research into Genetic and Occupational/environmental Risk factors for Anomalies in children) biobank project. The regional Committee on Research involving Human Subjects (CMO Arnhem/Nijmegen) approved the study protocol. Written informed consent was obtained from the patient and the parents. All zebrafish experiments were approved by the Animal Care Committee of the University Medical Center Utrecht in the Netherlands.
Urine-derived renal epithelial cells
Renal epithelial cells were obtained from a nephronophthisis patient and a healthy gender- and age-matched control. The patient was determined to have isolated clinical diagnosis of NPHP. Urine-derived renal epithelial cells were derived as we have previously described [33] . IMCD3 cell culture Mouse Inner Medullar Collecting Duct (IMCD3) cells were cultured in Dulbecco's Modified Eagle's Medium (DMEM):F12 (1∶1) (GlutaMAX, Gibco), supplemented with 10% Fetal Calf Serum (FCS) and penicillin and streptomycin (1% P/S). Cells were incubated at 37°C in 5% carbon dioxide (CO 2 ) to approximately 90% confluence. IMCD3 cells were stably transfected with CEP164 constructs in a retroviral vector (pRetroX-Tight-Pur) for doxycyclin-inducible expression. Inducible overexpression was obtained of N terminally GFP-tagged human full-length CEP164 isoform 1 (NGFP-CEP164-WT), or truncated CEP164 , corresponding with the p.Q525X mutation, or non-functional CEP164 , corresponding with the p.R93W mutation by addition of 2 ng/ml doxycycline [7] .
Show full methods section
Ethics statement
Renal epithelial cells were obtained from a nephronophthisis patient that had been included in the AGORA (Aetiologic research into Genetic and Occupational/environmental Risk factors for Anomalies in children) biobank project. The regional Committee on Research involving Human Subjects (CMO Arnhem/Nijmegen) approved the study protocol. Written informed consent was obtained from the patient and the parents. All zebrafish experiments were approved by the Animal Care Committee of the University Medical Center Utrecht in the Netherlands.
Urine-derived renal epithelial cells
Renal epithelial cells were obtained from a nephronophthisis patient and a healthy gender- and age-matched control. The patient was determined to have isolated clinical diagnosis of NPHP. Urine-derived renal epithelial cells were derived as we have previously described [33] . IMCD3 cell culture Mouse Inner Medullar Collecting Duct (IMCD3) cells were cultured in Dulbecco's Modified Eagle's Medium (DMEM):F12 (1∶1) (GlutaMAX, Gibco), supplemented with 10% Fetal Calf Serum (FCS) and penicillin and streptomycin (1% P/S). Cells were incubated at 37°C in 5% carbon dioxide (CO 2 ) to approximately 90% confluence. IMCD3 cells were stably transfected with CEP164 constructs in a retroviral vector (pRetroX-Tight-Pur) for doxycyclin-inducible expression. Inducible overexpression was obtained of N terminally GFP-tagged human full-length CEP164 isoform 1 (NGFP-CEP164-WT), or truncated CEP164 , corresponding with the p.Q525X mutation, or non-functional CEP164 , corresponding with the p.R93W mutation by addition of 2 ng/ml doxycycline [7] .
RPE cell culture
Human retinal pigment epithelial
(RPE) cells were cultured in DMEM∶F12 (1∶1) (GlutaMAX, Gibco), supplemented with 10% FCS and 1% P/S. Cells were incubated at 37°C in 5% CO 2 to approximately 90% confluence. RPE cells were transfected with lentiviral vectors containing mKO2-hCdt1(30/120) and mAG-hGem(1/110). Fluorescent, ubiquitination-based cell cycle indicator (FUCCI) [16] expressing stable transformants were generated [15] . RPE 53BP1-GFP cells are described in Janssen et. al. [17] RPE cells were stably transfected with CEP164 constructs in a retroviral vector (pRetroX-Tight-Pur) for doxycyclin-inducible expression. Inducible overexpression was obtained of N terminally GFP-tagged human full-length CEP164 isoform 1 (NGFP-CEP164-WT). RPE cells were serum starved>24 hour in experiments for cilia quantification.
MEF cell culture
Mouse embryonic fibroblasts
(MEFs) were cultured in DMEM (Gibco), supplemented with 10% FCS and 1% P/S. Cells were incubated at 37°C in 5% CO 2 to approximately 90% confluence. Transfections At least 6 hours after plating, cells were transfected with Lipofectamine RNAimax (Invitrogen, 13778-075), according to the supplier's protocol. Opti-MEM (Invitrogen, 31985-062) was used to dilute the ON-TARGETplus siRNA SMARTpools (Thermo Scientific Dharmacon) for Non-targeting pool UGGUUUACAUGUCGACUAA/UGGUUUACAUGUUGUGUGA/UGGUUUACAUGUUUUCUGA/UGGUUUACAUGUUUUCCUA (D-001810-10), human CEP164 GAGUGAAGGUGUAUCGCUU/GAGAAGUGGCGCAAGUAUU/GGACCAUCCAUGUGACGAA/GAAGAGUGAACCUAAGAUU (L-020351-02), human CEP164 GAGUGAAGGUGUAUCGCUU (J-020351-17), or mouse Cep164 GGAGAGUGCAGGAGGGAGA/ACCCAGUGCAGGCAGGAAA/AGUCAGAGAUCCACGGACA/CCACAGAAAGAAAACGAGA (L-057068-01), mouse Cep164 CCACAGAAAGAAAACGAGA (J-057068-09) to 20 nM.
Real time imaging
RPE-FUCCI cells were seeded in 8 well Lab-Tek Chamber Slides (Thermo Scientific) without addition of serum. After 16 hours, the cells were transfected with Lipofectamine RNAimax. Seven hours after transfection, medium in the Lab-Tek Chamber Slides was replaced with Leibovitz's medium without phenol red (Gibco), supplemented with 6% FCS, 1% P/S and 1% Ultraglutamine. Real time imaging was performed using a Zeiss microscope using a 10× lens. Every 15 minutes images were made of the RPE-FUCCI cells in LED, GFP and dsRED channels for 72 hours. Three positions were imaged per experimental condition. Images were processed with the MetaMorph software. GraphPad Prism 5.0 was used to perform one-way ANOVA with Dunnett's post test.
Immunofluorescence and confocal imaging
For immunostaining, IMCD3, RPE-FUCCI, urine derived renal epithelial cells or RPE 53BP1-GFP cells were grown on coverslips and fixed for 30 minutes in 4%PFA at the indicated time points, followed by a 15 minutes permeabilization step in 0.5%Triton-X100/1%BSA/PBS. Primary antibody incubations (mouse anti-acetylated tubulin (Sigma, T7451, dilution 1∶20000), rabbit anti-CEP164, Novus 45330002, 1∶500, mouse anti-phospho-Histone H2A.X (Ser139), clone JBW301, Millipore 05-636, 1∶500 or rabbit anti-active Caspase-3 (BD Pharmingen, 559565, dilution 1∶250) were performed overnight in 1% BSA/PBS. Goat anti-mouse/rabbit Alexa 647 secondary antibody (Invitrogen, dilution 1∶500) incubations were performed for 2.5 hours at RT. DAPI incubations were performed for 10 minutes at RT. Coverslips were mounted in Fluormount G (Cell Lab, Beckman Coulter). Confocal imaging was performed using Zeiss Confocal laser microscope and images were processed with the ZEN 2011 software. Approximately 250 events per condition were scored. GraphPad Prism 5.0 was used to perform statistical analysis. To observe centrosomal localization of N-GFP-CEP164-WT, clonally inducible IMCD3 cell lines doxycylcin (Dox)-inducibly expressing human N-GFP-CEP164-WT were treated by double thymidine block (2 mM). Cells were also induced with doxycycline (10 ng/mL) during the thymidine block to express N-GFP-CEP164-WT . Cells were stained with CEP164-SR antibody followed by anti-rabbit-alexa fluor 594 antibody for confocal imaging to observe colocalization with the induced N-GFP-CEP164-WT -expressing cells. For live cell imaging, RPE cells were seeded in Lab-Tek Chamber Slides with cells at 30% confluency. RPE cells were transfected and after 16 hours, wells were washed once with PBS and once with 1× Binding Buffer (NucView Dual Apoptosis Kit for Live Cells, Biotium, 30067). Cells were incubated 40 minutes at RT with NucView 488 Caspase-3 substrate (5 µM) and CF 594-Annexin V (1∶40) in 1× Binding Buffer. Cells were washed once with 1× Binding buffer and confocal imaging was performed using a Zeiss Confocal laser microscope and images were processed with the LSM500 software. GraphPad Prism 5.0 was used to perform two-tailed student t-tests.
EdU staining
To examine cells in S phase, RPE-FUCCI cells were seeded on coverslips. After 48 hour EdU (Invitrogen, A10044) incorporation took place for 30 minutes using 10 µM in culture medium. The cells were fixed in 3% PFA and washed with PBS. Cells were shortly incubated with EdU staining buffer (100 mM Tris pH 8,5; 1 mM CuSO 4 ). Then the cells were incubated with EdU staining buffer containing Alexa Fluor 647 azide (1∶1000) (Invitrogen, A10277) and ascorbic acid (0.1 M) (Merck) for 30 minutes at RT in the dark. The coverslips were washed twice with PBS and incubated with DAPI for 30 minutes at RT in the dark. The coverslips were mounted with Fluormount G (Cell Lab, Beckman Coulter) after washing them once with PBS. Confocal imaging was performed using Zeiss Confocal laser microscope and images were processed with the ZEN 2011 software.
CyQUANT NF cell proliferation assay
RPE and IMCD3 cells were transfected in 96 well plates seeded with cells at 30% confluency. CyQUANT NF reagent (Invitrogen, C35006 ) was prepared according to the manufacturer's protocol. After 72 hour of incubation, 50 µl of CyQUANT NF Cell Proliferation Assay reagent was added to each well after aspiration of medium. After incubation for 30 minutes at 37°C, fluorescence was measured (excitation 485 nm, emission 538 nm) on a Fluoroskan Ascent FL apparatus (Thermo Scientific, 374-90441C) using Ascent Software version 2.6. Blanc measurement subtraction was performed and GraphPad Prism 5.0 was used to perform two-tailed student t-tests. Real-Time-Quantitative PCR (RT-QPCR) Cells were lysed and total RNA was isolated (RNeasy Mini Kit, Qiagen, 74106) and measured (NanoDrop spectrophotometer ND-1000, Thermo Fischer Scientific Inc.). cDNA was synthesized from 500 ng RNA template using the iScript cDNA Synthesis Kit (Bio-Rad, 170-8891) according to the supplier's protocol. Dilutions were made for RT-QPCR analysis to determine mRNA expression levels which were normalized against a reference gene. The iQ SYBR Green Supermix (Bio-Rad, 170-8880) was used to multiply and measure the cDNA with a CFX96 Touch Real-Time PCR Detection System (Bio-Rad). All samples were run in triplicate in 20 µl reactions. The following PCR program was used: 95°C for 3 min, followed by 40 cycles of 10 s at 95°C, 30 s at the indicated annealing temperature and 30 s at 72°C, then 10 s at 95°C followed by a melt of the product from 65°C–95°C. The primer sequences (Sigma) used and concomitant annealing temperatures are: hCEP164 forward 5′-GGCAAAGCTGTCAACTTCTGG , hCEP164 reverse 5′-GAACTGGGGCTAATGAGGAAC , 61°C, mCep164 forward 5′-AGAGTGACAACCAGAGTGTCC , mCep164 reverse 5′-GGAGACTCCTCGTACTCAAAGTT , 61°C, hRPLP0 forward 5′-TGCACAATGGCAGCATCTAC , hRPLP0 reverse 5′-ATCCGTCTCCACAGACAAGG , 58°C, hCaspase-3 forward 5′-ACATGGCGTGTCATAAAATACC , hCaspase-3 reverse 5′-CACAAAGCGACTGGATGAAC , 60°C, mE-cadherin forward 5′-CAGTTCCGAGGTCTACACCTT , mE-cadherin reverse 5′-TGAATCGGGAGTCTTCCGAAAA , 66°C, mCaspase-3 forward 5′-GGCTTGCCAGAAGATACCGGT , mCaspase-3 reverse 5′-GCATAAATTCTAGCTTGTGCGCGT , 67°C, mSnail forward 5′- CACACGCTGCCTTGTGTCT , mSnail reverse 5′- GGTCAGCAAAAGCACGGTT , 66°C, hSnail forward 5′-TCGGAAGCCTAACTACAGCGA , hSnail reverse 5′-AGATGAGCATTGGCAGCGAG , 64°C, mRPL27 forward 5′-CGCCCTCCTTTCCTTTCTGC , mRPL27 reverse 5′-GGTGCCATCGTCAATGTTCTTC , 53°C, hVimentin forward 5′-GACAATGCGTCTCTGGCACGTCTT , hVimentin reverse 5′-TCCTCCGCCTCCTGCAGGTTCTT , 67°C, ZfαSMA forward 5′- CATGTACCCGGGCATTGCAGA ,, ZfαSMA reverse 5′- GGAAGGTGGAGAGAGAGGCCA , zfSnail forward 5′-CTCCTGCCCACACTGTAACCG , zfSnail reverse 5′-CATGCGACTGAAGGTGCGAGA , zfFibronectin1 forward 5′-TCCCAGACATCACGGGCTACA , zfFibronectin1 reverse 5′-GCATGAGTTCTGTCCGGCCTT , zfβ-actin forward 5′-TCTGGATCTGGCTGGTCGTGA , zfβ-actin reverse 5′- CTCCTGCTCAAAGTCCAGGGC 63°C. Taqman assays were performed to measure mouse CTGF (Applied Biosystems, probe number Mm01546133_m1), Tieg1 (Mm00449812_m1), TGFβ1 (Mm01178820_m1), ACTA2 (αSMA, Mm00725412_s1), and Fn1 (Mm01256744_m1) gene expression levels. The following PCR program was used: 40 cycles of 15 s at 95°C, 60 s at 60°C. The ΔΔCT method was used for statistical analysis to determine gene expression levels.
Immunoblotting
Protein lysates were prepared using RIPA lysis buffer. To correct for protein content BCA protein assay (Pierce) was performed. Western blots were performed for Cep164 . β-actin was used as loading control in combination with Coomassie Blue staining. After blotting, the PVDF membranes were blocked in 5% dried skim milk in TBS with 0.5% Tween. And western blots were performed for γH2AX, PCNA and Snail. H2AX and β-actin were used as loading control in combination with Coomassie Blue staining. After dry blotting (iBlot Dry Blotting System, Invitrogen, IB3010-01), the nitrocellulose membranes were blocked in 5% BSA in TBS with 0.5% Tween. The primary antibodies (rabbit anti-Cep164, Novus 45330002, 1∶2000, rabbit anti-H2AX (pSer 139 ), Calbiochem DR1017, 1∶1000, mouse anti-phospho-Histone H2A.X (Ser139), clone JBW301, Millipore 05-636, 1∶1000 (Specificity of the gamma H2AX antibodies was determined by pre-treatment with phosphatases), rabbit anti-Histone H2A.X, Millipore 070627, 1∶1000, rat anti-PCNA, Antibodies Online ABIN334654, 1∶1000, rabbit anti-Snai1, Santa Cruz sc-28199, 1∶400, and mouse anti-β-actin AC-15, Sigma A5441, 1∶15000, rabbit anti-GFP Abcam, 1∶1000) were incubated overnight at 4°C. The secondary swine anti rabbit, goat anti rat and rabbit anti mouse antibodies which are HRP conjugated (DAKO, dilution 1∶2000) were incubated for 1 hour at RT. The ECL Chemiluminescent Peroxidase Substrate kit (Sigma, CPS1120-1KT) was used for development. Scans of the blots were made with the BioRad ChemiDoc XRS+ device with Image Lab software 4.0. GraphPad Prism 5.0 was used to perform two-tailed student t-tests. Fluorescence-activated cell sorting (FACS) To investigate S-phase progression, dox-inducible non-clonally and clonally selected mouse IMCD3 cells expressing wild type human CEP164 cDNA construct N-GFP-CEP164-WT or mutant human CEP164 construct N-GFP-CEP164-Q525X or N-GFP-CEP164-R93W were transfected with either negative control siRNA (50 nM) or anti-mouse Cep164 siRNA (50 nM) using Polyplus transfection reagents. Cells were treated for double thymidine block (2 mM) from time point 24–42 to 50–68 hrs post transfection. Cells were then also induced with doxycycline (10 ng/ml) at 24 hrs post siRNA transfection for expression of human wild type construct N-GFP-CEP164-WT or human mutant constructs. Cells were released from second thymidine block for 6 hrs and fixed with 2% PFA and stained with PI/RNAse staining solution. Events were acquired in a FACSCalibur flow cytometer (BD Biosciences) for the cell cycle histogram Mean and SD of percent of DNA amount for different phases (triplicate samples) were calculated and plotted as histograms. Apoptosis FACS To quantify apoptosis, IMCD3 cells were plated and transfected with siControl or siCep164. After 24 hours cells were exposed to 0 and 50 nM aphidicolin for 16 hours. Cells were harvested and washed once with 1% BSA-PBS. Cells were collected in FACS tubes in 200 µl 1% BSA-PBS containing Vybrant DyeCycle Violet Stain (Invitrogen, V35003, 1∶1000) to stain living and early apoptotic cells (7 minutes at 37°C) and 7-AAD viability stain (eBioscience, 00-6993, 1∶60) to stain late apoptotic cells (10 minutes on ice). Cells were measured (10.000 events) with a BD FACSCanto II flowcytometer and analyzed using BD FACSDiva Software [34] . GraphPad Prism 5.0 was used to perform two-way ANOVA with Bonferroni post hoc test.
Migration assay
IMCD3 cells were transfected overnight with non-targeting siControl or siCep164 oligonucleotides in 24 well plates seeded with cells at 40% confluency. 48 hour later, when the cells were>85% confluent, a plastic disposable pipette tip was used to create a scratch wound in the cell monolayer. After washing the wells once with PBS, the cells were incubated with serum-free medium for 18 hours containing no or 5 ng/mL TGFβ (Peprotech, 100-21). Images of the same positions of the scratch were made with a light microscope (4× objective) after 0 and 18 hours. Migration of cells was measured with Image-Pro. GraphPad Prism 5.0 was used to perform two-way ANOVA with Bonferroni post hoc test.
Zebrafish morpholino injections
Wild-type and p53-/- embryos ( tp53 M214K ) [35] at the 1–2 cell stage were injected with 1 or 2 nL of a 0.1 mM antisense morpholino oligonucleotide targeting Cep164 exon 3 in pure water with 0.1% Phenol Red using a nanoject2000 microinjector (World Precision Instruments). The sequence of the exon 3 morpholino was: TGTGTTGTGGAGTGTGTGTTACCAT . The sequence of the standard control morpholino was: 5′-CCT CTTACCTCAGTTACAATTTATA-3′ . Primers amplifying exon 3 (Cep164 ex 2–4 product length = 187) forward primer GGTGCTGGAGGAGGATTATG and reverse primer GTAGTAGACCTCGCCCGTCA were used. For western blot 15 embryos were pooled in 60 µL Triton X-100 lysis buffer. For RT-QPCR 5 embryos were pooled in 100 µL TRIzol reagent (Invitrogen, 15596-026) and RNA was isolated following standard procedures. Zebrafish acridine orange staining 24 and 72 (PTU treated) hpf live dechorionated embryos are incubated in a 2 mg/mL solution of acridine orange (Sigma) in PBS for 30 min at room temperature. Embryos are washed quickly in E3, then 5×5 minutes in E3 and visualized on a Zeiss LSM5 Pascal confocal microscope. No autofluorescence was detected in the regions analyzed. GraphPad Prism 5.0 was used to perform two-tailed student t-tests.
Zebrafish γH2AX staining Anti-phospho
H2AX antibody was a kind gift from James Amatruda (University of Texas Southwestern Medical Center, Dallas, Texas 75390). Embryos were fixed in 4% PFA overnight at 4°C and stained with Anti-phospho H2AX (1∶1500), Alexa 488 goat-anti-rabbit (Invitrogen A11008) secondary antibody and visualized on a Zeiss LSM5 confocal microscope.
Supporting Information Figure S1 Validation of RPE-FUCCI cells and knockdown of human CEP164 . (A) Relative CEP164 gene expression levels as measured by RT-QPCR in RPE-FUCCI cells, normalized to RPLP0 . Total RNA was isolated 48 hours after transfection with siControl or siCEP164-p or -i oligos. After 48 hour of transient transfection CEP164 levels are significantly reduced (***p
📊 Figures
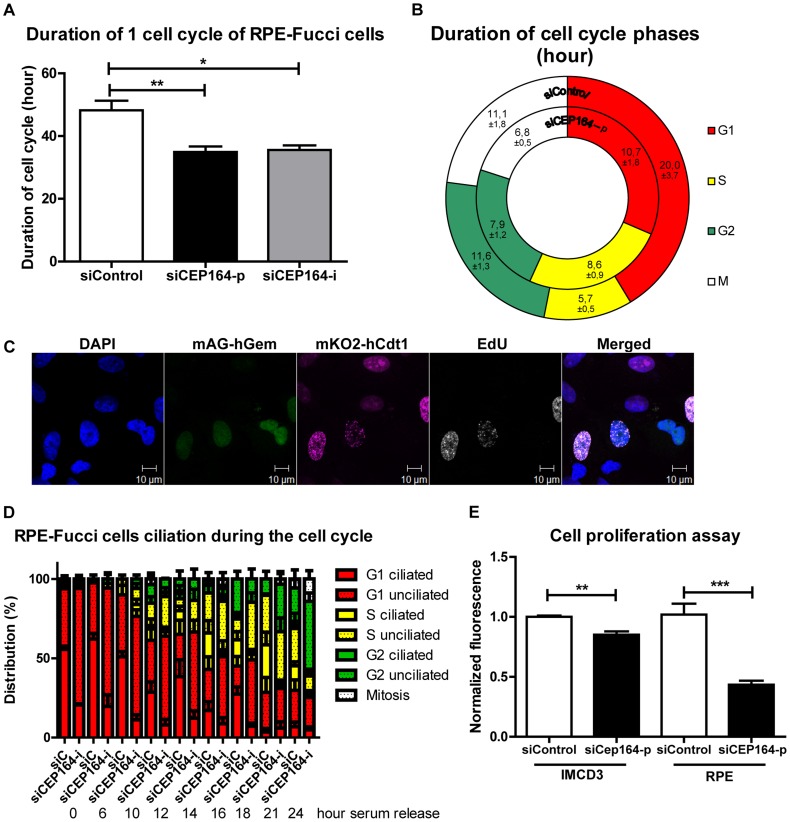
Figure 1
CEP164 regulates cell cycle progression and proliferation.
(A) RPE-FUCCI cells and their daughter cells were tracked by live cell imaging for 72 hours (hr) after transfection. CEP164 depleted cells have a quicker cell cycle (u223c35 hr) compared to control ce...
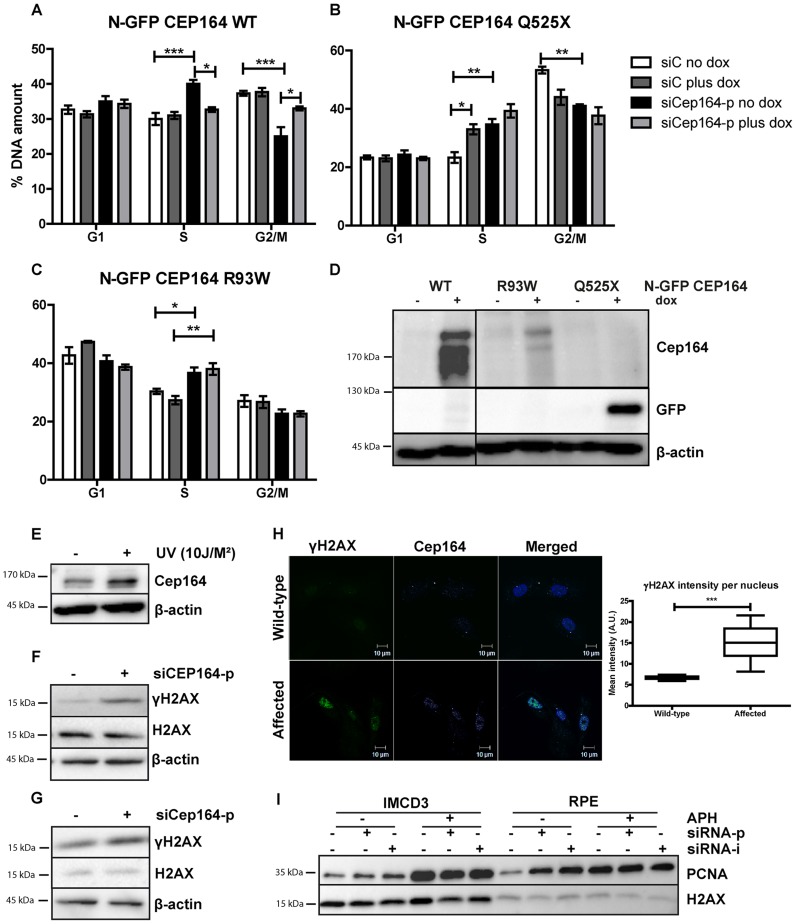
Figure 2
Knockdown of Cep164 causes S-phase delay.
(Au2013D) Endogenous Cep164 knockdown leads to block in S-phase and is rescued by inducible human wild type CEP164 but not by human mutant CEP164 . Under thymidine synchronization, Cep164 knockdown ce...
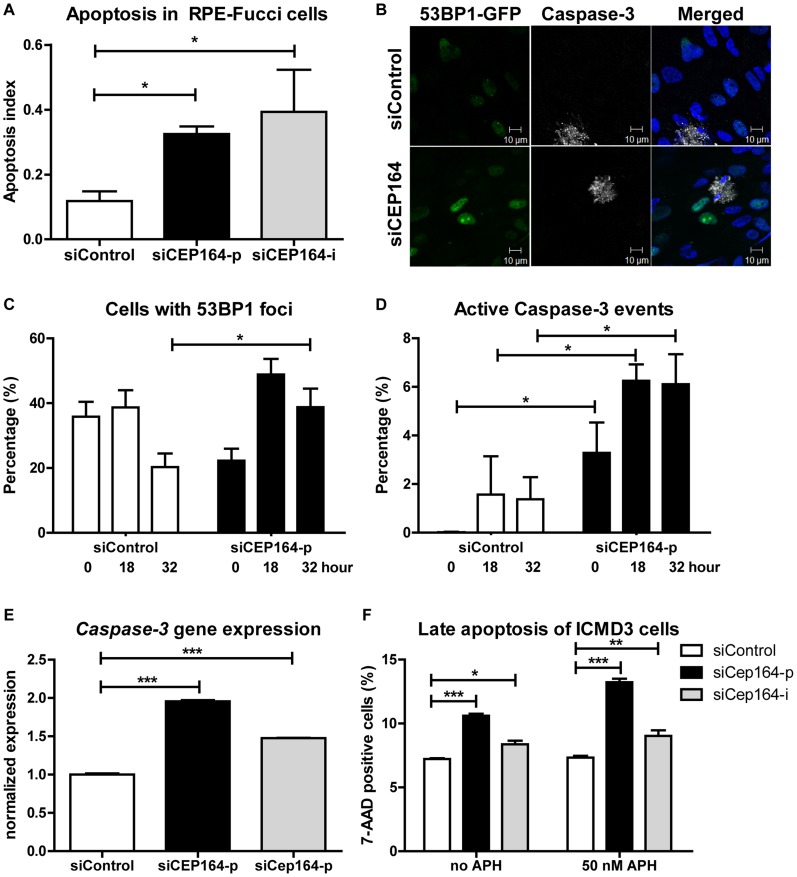
Figure 3
Induced apoptosis and DNA damage accumulation after loss of CEP164 .
(A) RPE-FUCCI cells and, after mitosis, their daughter cells are followed during 72 hours after transfection. The number of apoptotic events was scored and normalized to the total number of RPE-FUCCI ...
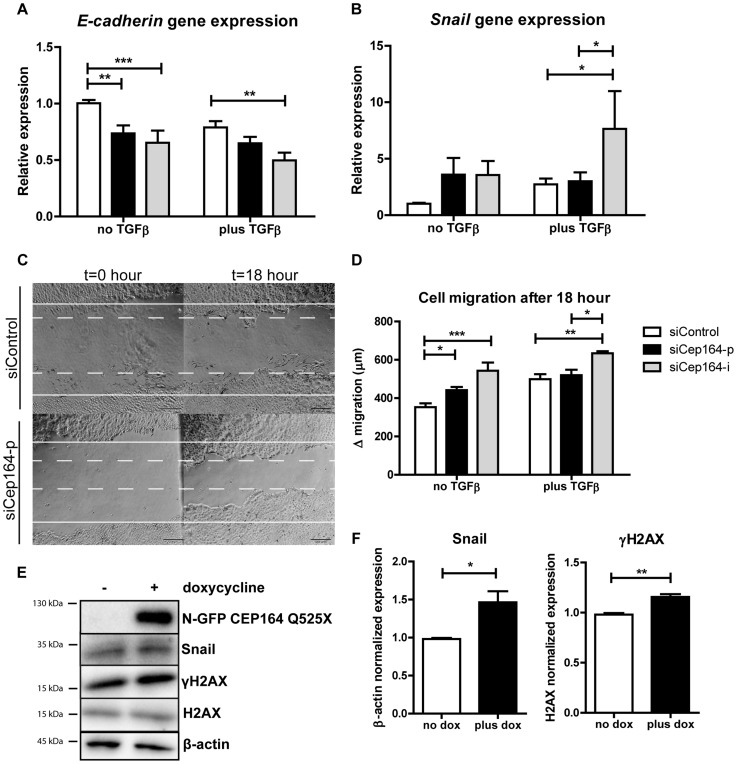
Figure 4
Loss of Cep164 induces EMT.
(A) Relative gene expression levels of epithelial marker E-cadherin as measured by RT-QPCR in IMCD3 cells, normalized to RPL27. Total RNA was isolated 6 days after transfection with siControl or siCep...
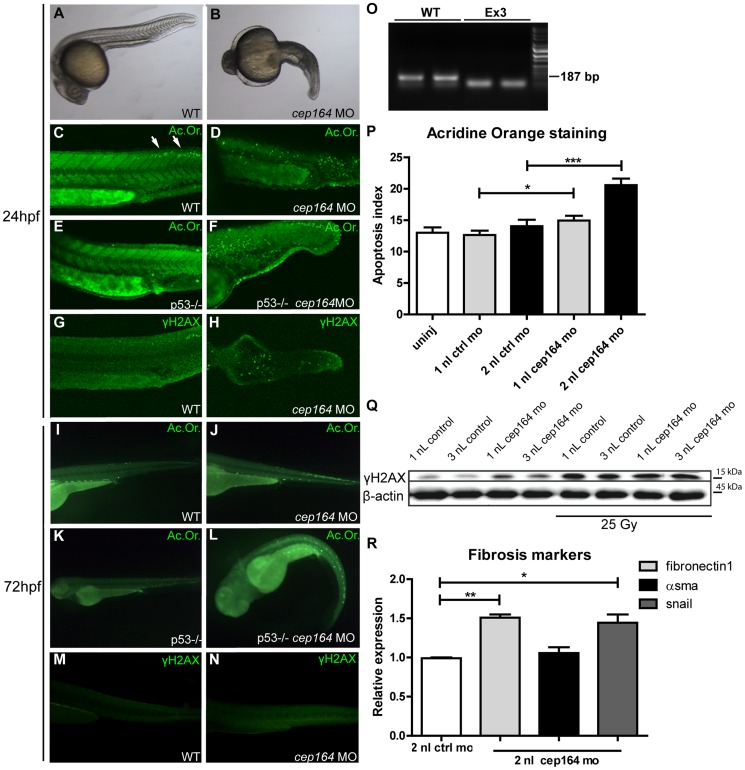
Figure 5
Apoptosis, DNA damage signaling and fibrosis in zebrafish.
Zebrafish cep164 knockdown leads to developmental abnormalities associated with apoptosis and DNA damage. A cep164 morpholino targeting the exon 3 splice donor reduces wildtype mRNA (lanes WT) and res...
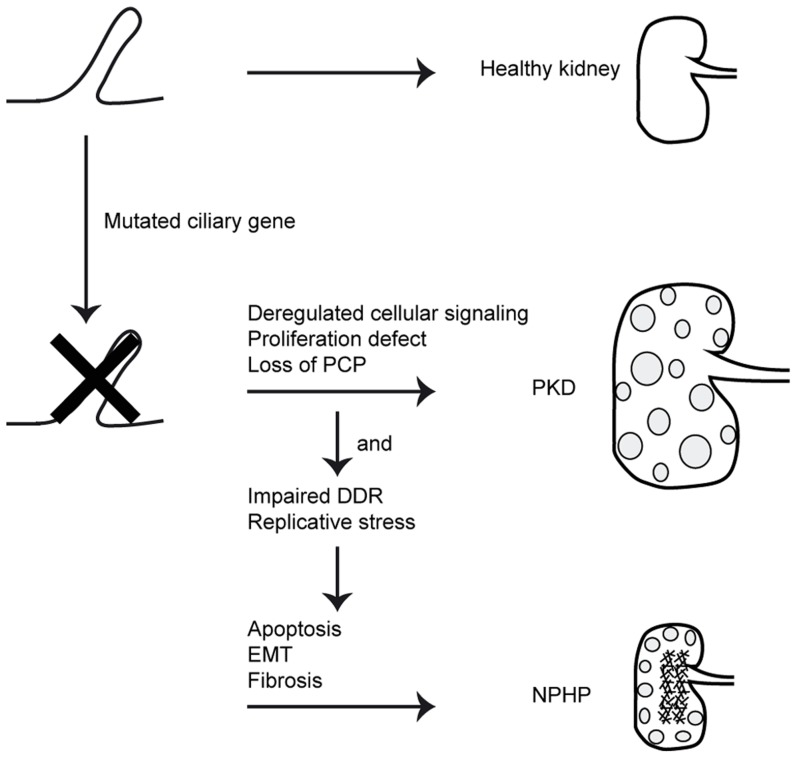
Figure 6
Schematic overview of signaling cascade involved in development of PKD and NPHP.
Mutations in ciliary genes cause ciliary defects. Ciliary defects result in proliferation defects, loss of planar cell polarity (PCP) and deregulated cellular signaling. This causes cystic kidney dise...
Figure images are served from the NIH/NLM PubMed Central Open Access Subset or Europe PMC; copyright remains with the publishers and authors.
💬 Discussion
0 commentsNo comments yet. Be the first to start a discussion!
Leave a Comment