Abstract
Abstract Background Automatic quantification of neuronal morphology from images of fluorescence microscopy plays an increasingly important role in high-content screenings. However, there exist very few freeware tools and methods which provide automatic neuronal morphology quantification for pharmacological discovery. Results This study proposes an effective quantification method, called NeurphologyJ, capable of automatically quantifying neuronal morphologies such as soma number and size, neurite length, and neurite branching complexity (which is highly related to the numbers of attachment points and ending points). NeurphologyJ is implemented as a plugin to ImageJ, an open-source Java-based image processing and analysis platform. The high performance of NeurphologyJ arises mainly from an elegant image enhancement method. Consequently, some morphology operations of image processing can be efficiently applied. We evaluated NeurphologyJ by comparing it with both the computer-aided manual tracing method NeuronJ and an existing ImageJ-based plugin method NeuriteTracer. Our results reveal that NeurphologyJ is comparable to NeuronJ, that the coefficient correlation between the estimated neurite lengths is as high as 0.992. NeurphologyJ can accurately measure neurite length, soma number, neurite attachment points, and neurite ending points from a single image. Furthermore, the quantification result of nocodazole perturbation is consistent with its known inhibitory effect on neurite outgrowth. We were also able to calculate the IC50 of nocodazole using NeurphologyJ. This reveals that NeurphologyJ is effective enough to be utilized in applications of pharmacological discoveries. Conclusions This study proposes an automatic and fast neuronal quantification method NeurphologyJ. The ImageJ plugin with supports of batch processing is easily customized for dealing with high-content screening applications. The source codes of NeurphologyJ (interactive and high-throughput versions) and the images used for testing are freely available (see Availability).
🔬 Techniques
💻 Software
✨ Fluorophores
🧪 Sample Preparation
🔬 Cell Lines
🏭 Microscope Brands
🧪 Reagent Suppliers
📷 Detectors
🔎 Objectives
💻 Software Details
🏛️ Research Organizations (ROR)
Affiliated research institutions:
📋 Methods
Neuron image acquisition
To evaluate whether NeurphologyJ can detect neuronal morphological changes upon pharmacological perturbation, we design an experiment to measure the effect of nocodazole on neurite length. Nocodazole is a known microtubule-destabilizing drug that has been shown to induce rapid neurite retraction when applied to neurons [ 25 , 26 ]. P19 neurons were incubated with increasing dosage of nocodazole for 24 hrs before being fixed and immunofluorescence stained. A total of 216 images (with a total size over 500 Mb) were analyzed using NeurphologyJ. The image acquisition procedure is described below. a) Cell culture and drug treatment Embryonic carcinoma P19 cells were maintained at 37°C in 5% CO2 in minimum essential medium supplemented with 2 mM glutamine, 1 mM sodium pyruvate, and 10% (v/v) fetal bovine serum. The drug experiment was performed on 96-well plates. Each well on the plate was pre-spotted with 800 ng of proneural gene (MASH1) expressing plasmid and 0.4 μL of Lipofectamine 2000 in a total of 50 μL serum-free minimum essential medium. After 20 minutes, 16000 P19 cells in differentiation medium (minimum essential medium supplemented with 2 mM glutamine, 1 mM pyruvate, 5% fetal bovine serum) were added to each well and maintain in a 37°C, 5% CO2 incubator. 72 hours post-transfection, P19 cell cultures were treated with DMSO (control) and various concentration of nocodazole (10, 50, 100, 200, and 1000 nM). After 24 hours of incubation, drug-treated cells were fixed with 3.6% formaldehyde in PBS. Fetal bovine serum was purchased from Biological Industries. Lipofectamine 2000, minimum essential medium, sodium bicarbonate, and trypsin-EDTA were purchased from Invitrogen. DMSO, nocodazole, and sodium pyruvate were purchased from Sigma-Aldrich. b) Indirect immunofluorescence staining and image acquisition Cells were fixed with 3.6% formaldehyde in PBS (prewarmed to 37°C) for 10 min at 37°C and permeabilized with 0.25% triton X-100 for 5 min at room temperature. Cells were blocked for 1 hr at room temperature with 10% BSA (bovine serum albumin), and incubated for 1 hr at 37°C with antibody against beta-III-tubulin (TUJ1) 1:4000 diluted in wash buffer (0.5% BSA, 0.05% tween-20 diluted in PBS). After being washed three times with wash buffer, cells were incubated with DyLight 488-labeled secondary antibodies (1:1000), and DNA-binding dye DAPI (5 μg/mL) for 1 hr at 37°C in the dark. Each well with cells were washed three times with wash buffer and stored in PBS. Formaldehyde and triton X-100 were purchased from J. T. Baker. BSA was purchased from Invitrogen. Mouse monoclonal antibody against beta-III-tubulin (TUJ1; MMS-435P) was purchased from Covence. DyLight 488-labeled goat-anti-mouse secondary antibody was purchased from Jackson ImmunoResearch. DAPI was purchased from Invitrogen. Fluorescence images were acquired with an Olympus IX-71 inverted microscope equipped with a CoolLED fluorescent light source (400 nm and 490 nm wavelength modules) and a Hamamatsu ORCA-R2 camera (6.45 μm × 6.45 μm pixel dimensions). Chroma BFP-A-Basic and Olympus U-MWIBA3 filter sets were used to image DAPI and DyLight488 fluorophores, respectively. Olympus Plan Apochromat objective lenses (10x 0.4 N.A. or 60x 1.35 N.A.) were used to collect images. A total of 216 images were taken and used for this experiment. The entire collection is over 500 Mb in size and can be downloaded from our FTP server upon request. Proposed method NeurphologyJ The design aims of NeurphologyJ are as following. 1) Minimizing human intervention. It is essential to minimize the human intervention and the number of control parameters without degrading performance during batch processing. A translation of Occam's razor principle suggests that ending up with a large number of user-settable parameters is indicative of poor algorithm design [ 20 ]. An elegant image enhancement method is proposed to facilitate the determination of threshold values of segmentation. 2) Convenience of use. NeuriteTracer [ 14 ] is effective and accurate, but a pair of nuclear and neurite marker images is needed. It is more convenient if a single image of fluorescence microscopy is sufficient to measure neurite outgrowth. Only one channel per image is needed for applying NeurphologyJ. 3) Maximizing the speed. Considering the vast amount of images generated from the high-content screening, a high analyzing speed is crucial to handle such task. NeurphologyJ makes the best use of both global morphology operations of image processing and local geometric properties of lines to speed up the quantification. 4) Achieving high accuracy. There are tradeoffs between the processing speed and the accuracy. For applications in pharmacological discoveries, the ratio of neurite lengths of the treated and non-treated neurons (rather than the absolute neurite length) is the major concern. As a result, NeurphologyJ aims to achieve high coefficient correlation with manual tracing by detecting line pixels of neurites without further using linking algorithms. 5) Robustness. Image segmentation plays an important role in quantifying neuronal morphology. The techniques of local exploration and global processing are combined to deal with the staining or the illumination variation of the high-content screenings. Some settings of threshold values can be automatically derived from the histogram of enhanced neuronal images. 6) Taking advantage of the free software ImageJ. NeurphologyJ makes the best use of ImageJ commands and uses a compact set of Java modules. Being designed as a plugin of ImageJ has the benefit of easy customization for dealing with specific applications or for future expansions. Two versions of NeurphologyJ are provided, interactive and high-throughput. The interactive version is useful for optimizing the parameters for the high-throughput version. The algorithm of NeurphologyJ consists of five parts, one image enhancement part and four morphological quantification parts. The schematic flowchart of NeurphologyJ is shown in Figure 1 . The major commands used in each part and detailed descriptions are shown below. Figure 1 The schematic flowchart of NeurphologyJ . NeurphologyJ consists of five parts, each part is highlighted by a specific color. Arithmetic and logical operations are shown in with logical operations capitalized. Image enhancement The image enhancement part is crucial for subsequent morphological quantifications. The proposed enhancement method aims to increase the signal-to-background ratio that can facilitate automatic determination of threshold values from the histograms of enhanced images. Furthermore, we examined and confirmed that thin and dim neurites are mostly preserved after this enhancement process using mouse hippocampal neuron images (Figure 2 ). The three functions used to achieve image enhancement are edge detection, uneven background correction, and intensity-based pixel selection. The detailed description is shown below. Figure 2 Image enhancement process of NeurphologyJ does not remove thin and dim neurites . Shown here is an example image of mouse hippocampal neurons analyzed by NeurphologyJ. Notice that both thick neurites and thin/dim neurites (arrowheads) are preserved after the image enhancement process. The scale bar represents 50 μm. 1) To detect edges based on local intensity variation, the original image is subtracted by the image which has been smoothened by a Gaussian smoothing kernel. The resulting image is then binarized using a given threshold ( lowc ) to select pixels with low local contrast. 2) To correct the uneven background, the "Subtract Background" command using a rolling ball with a radius of N pixels ( N is a constant 50 in this study) is applied to the original image. The flattened background image is binarized using a given threshold ( lowi ) to select low intensity pixels. 3) The gray levels of pixels selected by the first two steps (i.e., background pixels) are set to zero. These operations produce an image with increased signal-to-background ratio. Therefore, subsequent operations on foreground pixels can be easily done without background interference. Figure 3 shows the typical histograms of the original and the enhanced images. Figure 3 The histograms of the original and the enhanced images . After the enhancement, the background pixels of the original image were identified and their gray levels were set to zero (the red vertical line next to the Y-axis). The histogram of the original image is shown in blue and the enhanced image is shown in red. Notice that histogram stretching has been performed on both the original and the enhanced images for easy visualization. This enhancement algorithm of NeurphologyJ aims to generate an enhanced image I-new from the original image I . All the features of neuronal morphology are extracted from the image I-new . Some typical images produced in the following steps are shown in Figure 1 . Step 1) Detecting low contrast pixels to generate an image I-low_contrast 1.1) I-blur = run("Gaussian Blur") on image I . 1.2) I-sub_blurred = imageCalculator("Subtract create", " I ", " I-blur "). 1.3) I-low_contrast = Binarize I-sub_blurred by setThreshold(0, lowc ). Step 2) Detecting low intensity pixels to generate an image I-low_intensity 2.1) I-flatten = run("Subtract Background") on image I . 2.2) I-low_intensity = Binarize I-flatten by setThreshold(0, lowi ). Step 3) Create a new image I-new by removing low contrast and low intensity pixels 3.1) I-zero_intensity = imageCalculator("OR create", " I-low_contrast ", " I-low_intensity "). 3.2) I-new = imageCalculator("Multiply create", " I ", " I-zero_intensity "). The threshold values of lowc and lowi are manually determined by using the interactive version of NeurphologyJ. User-determined lowc and lowi values are reused in the high-throughput version for batch analysis.
Show full methods section
Neuron image acquisition
To evaluate whether NeurphologyJ can detect neuronal morphological changes upon pharmacological perturbation, we design an experiment to measure the effect of nocodazole on neurite length. Nocodazole is a known microtubule-destabilizing drug that has been shown to induce rapid neurite retraction when applied to neurons [ 25 , 26 ]. P19 neurons were incubated with increasing dosage of nocodazole for 24 hrs before being fixed and immunofluorescence stained. A total of 216 images (with a total size over 500 Mb) were analyzed using NeurphologyJ. The image acquisition procedure is described below. a) Cell culture and drug treatment Embryonic carcinoma P19 cells were maintained at 37°C in 5% CO2 in minimum essential medium supplemented with 2 mM glutamine, 1 mM sodium pyruvate, and 10% (v/v) fetal bovine serum. The drug experiment was performed on 96-well plates. Each well on the plate was pre-spotted with 800 ng of proneural gene (MASH1) expressing plasmid and 0.4 μL of Lipofectamine 2000 in a total of 50 μL serum-free minimum essential medium. After 20 minutes, 16000 P19 cells in differentiation medium (minimum essential medium supplemented with 2 mM glutamine, 1 mM pyruvate, 5% fetal bovine serum) were added to each well and maintain in a 37°C, 5% CO2 incubator. 72 hours post-transfection, P19 cell cultures were treated with DMSO (control) and various concentration of nocodazole (10, 50, 100, 200, and 1000 nM). After 24 hours of incubation, drug-treated cells were fixed with 3.6% formaldehyde in PBS. Fetal bovine serum was purchased from Biological Industries. Lipofectamine 2000, minimum essential medium, sodium bicarbonate, and trypsin-EDTA were purchased from Invitrogen. DMSO, nocodazole, and sodium pyruvate were purchased from Sigma-Aldrich. b) Indirect immunofluorescence staining and image acquisition Cells were fixed with 3.6% formaldehyde in PBS (prewarmed to 37°C) for 10 min at 37°C and permeabilized with 0.25% triton X-100 for 5 min at room temperature. Cells were blocked for 1 hr at room temperature with 10% BSA (bovine serum albumin), and incubated for 1 hr at 37°C with antibody against beta-III-tubulin (TUJ1) 1:4000 diluted in wash buffer (0.5% BSA, 0.05% tween-20 diluted in PBS). After being washed three times with wash buffer, cells were incubated with DyLight 488-labeled secondary antibodies (1:1000), and DNA-binding dye DAPI (5 μg/mL) for 1 hr at 37°C in the dark. Each well with cells were washed three times with wash buffer and stored in PBS. Formaldehyde and triton X-100 were purchased from J. T. Baker. BSA was purchased from Invitrogen. Mouse monoclonal antibody against beta-III-tubulin (TUJ1; MMS-435P) was purchased from Covence. DyLight 488-labeled goat-anti-mouse secondary antibody was purchased from Jackson ImmunoResearch. DAPI was purchased from Invitrogen. Fluorescence images were acquired with an Olympus IX-71 inverted microscope equipped with a CoolLED fluorescent light source (400 nm and 490 nm wavelength modules) and a Hamamatsu ORCA-R2 camera (6.45 μm × 6.45 μm pixel dimensions). Chroma BFP-A-Basic and Olympus U-MWIBA3 filter sets were used to image DAPI and DyLight488 fluorophores, respectively. Olympus Plan Apochromat objective lenses (10x 0.4 N.A. or 60x 1.35 N.A.) were used to collect images. A total of 216 images were taken and used for this experiment. The entire collection is over 500 Mb in size and can be downloaded from our FTP server upon request. Proposed method NeurphologyJ The design aims of NeurphologyJ are as following. 1) Minimizing human intervention. It is essential to minimize the human intervention and the number of control parameters without degrading performance during batch processing. A translation of Occam's razor principle suggests that ending up with a large number of user-settable parameters is indicative of poor algorithm design [ 20 ]. An elegant image enhancement method is proposed to facilitate the determination of threshold values of segmentation. 2) Convenience of use. NeuriteTracer [ 14 ] is effective and accurate, but a pair of nuclear and neurite marker images is needed. It is more convenient if a single image of fluorescence microscopy is sufficient to measure neurite outgrowth. Only one channel per image is needed for applying NeurphologyJ. 3) Maximizing the speed. Considering the vast amount of images generated from the high-content screening, a high analyzing speed is crucial to handle such task. NeurphologyJ makes the best use of both global morphology operations of image processing and local geometric properties of lines to speed up the quantification. 4) Achieving high accuracy. There are tradeoffs between the processing speed and the accuracy. For applications in pharmacological discoveries, the ratio of neurite lengths of the treated and non-treated neurons (rather than the absolute neurite length) is the major concern. As a result, NeurphologyJ aims to achieve high coefficient correlation with manual tracing by detecting line pixels of neurites without further using linking algorithms. 5) Robustness. Image segmentation plays an important role in quantifying neuronal morphology. The techniques of local exploration and global processing are combined to deal with the staining or the illumination variation of the high-content screenings. Some settings of threshold values can be automatically derived from the histogram of enhanced neuronal images. 6) Taking advantage of the free software ImageJ. NeurphologyJ makes the best use of ImageJ commands and uses a compact set of Java modules. Being designed as a plugin of ImageJ has the benefit of easy customization for dealing with specific applications or for future expansions. Two versions of NeurphologyJ are provided, interactive and high-throughput. The interactive version is useful for optimizing the parameters for the high-throughput version. The algorithm of NeurphologyJ consists of five parts, one image enhancement part and four morphological quantification parts. The schematic flowchart of NeurphologyJ is shown in Figure 1 . The major commands used in each part and detailed descriptions are shown below. Figure 1 The schematic flowchart of NeurphologyJ . NeurphologyJ consists of five parts, each part is highlighted by a specific color. Arithmetic and logical operations are shown in with logical operations capitalized. Image enhancement The image enhancement part is crucial for subsequent morphological quantifications. The proposed enhancement method aims to increase the signal-to-background ratio that can facilitate automatic determination of threshold values from the histograms of enhanced images. Furthermore, we examined and confirmed that thin and dim neurites are mostly preserved after this enhancement process using mouse hippocampal neuron images (Figure 2 ). The three functions used to achieve image enhancement are edge detection, uneven background correction, and intensity-based pixel selection. The detailed description is shown below. Figure 2 Image enhancement process of NeurphologyJ does not remove thin and dim neurites . Shown here is an example image of mouse hippocampal neurons analyzed by NeurphologyJ. Notice that both thick neurites and thin/dim neurites (arrowheads) are preserved after the image enhancement process. The scale bar represents 50 μm. 1) To detect edges based on local intensity variation, the original image is subtracted by the image which has been smoothened by a Gaussian smoothing kernel. The resulting image is then binarized using a given threshold ( lowc ) to select pixels with low local contrast. 2) To correct the uneven background, the "Subtract Background" command using a rolling ball with a radius of N pixels ( N is a constant 50 in this study) is applied to the original image. The flattened background image is binarized using a given threshold ( lowi ) to select low intensity pixels. 3) The gray levels of pixels selected by the first two steps (i.e., background pixels) are set to zero. These operations produce an image with increased signal-to-background ratio. Therefore, subsequent operations on foreground pixels can be easily done without background interference. Figure 3 shows the typical histograms of the original and the enhanced images. Figure 3 The histograms of the original and the enhanced images . After the enhancement, the background pixels of the original image were identified and their gray levels were set to zero (the red vertical line next to the Y-axis). The histogram of the original image is shown in blue and the enhanced image is shown in red. Notice that histogram stretching has been performed on both the original and the enhanced images for easy visualization. This enhancement algorithm of NeurphologyJ aims to generate an enhanced image I-new from the original image I . All the features of neuronal morphology are extracted from the image I-new . Some typical images produced in the following steps are shown in Figure 1 . Step 1) Detecting low contrast pixels to generate an image I-low_contrast 1.1) I-blur = run("Gaussian Blur") on image I . 1.2) I-sub_blurred = imageCalculator("Subtract create", " I ", " I-blur "). 1.3) I-low_contrast = Binarize I-sub_blurred by setThreshold(0, lowc ). Step 2) Detecting low intensity pixels to generate an image I-low_intensity 2.1) I-flatten = run("Subtract Background") on image I . 2.2) I-low_intensity = Binarize I-flatten by setThreshold(0, lowi ). Step 3) Create a new image I-new by removing low contrast and low intensity pixels 3.1) I-zero_intensity = imageCalculator("OR create", " I-low_contrast ", " I-low_intensity "). 3.2) I-new = imageCalculator("Multiply create", " I ", " I-zero_intensity "). The threshold values of lowc and lowi are manually determined by using the interactive version of NeurphologyJ. User-determined lowc and lowi values are reused in the high-throughput version for batch analysis.
Soma extraction and quantification
From the enhanced image I-new , an Open operation (Erosion followed by Dilation operations) is used to isolate somata. The Open operation needs a parameter of the radius which equals the width of the thickest neurite (called the parameter nwidth ). The value of nwidth is user-determined. This Open operation has an additional benefit of removing small contaminating objects such as cell debris. This "opened" image is then binarized for soma number and soma size quantification using the build-in command "Analyze Particles" of ImageJ. Step 1) I-open = Using an Open operation on I-new to isolate neuronal cell bodies. Step 2) I-soma = Binarize I-open by setThreshold( Th1 , Gmax). Step 3) Quantify soma pixels using "Analyze Particles". The constant Gmax is the largest value of gray levels which is predefined, e.g., 255 for 8-bit images and 4095 for 12-bit images. Because the gray levels of background pixels have all been set to zero, the threshold value of Th1 is always set to 1.
Neurite length extraction and quantification
The enhanced image is first binarized automatically and all cell debris and small particles are removed by a user-defined size (called the parameter psize ). The resulting "cleaned" image is skeletonized to thin all objects into one-pixel-width skeletons. Somata are subtracted from the "skeleton" image to obtain the image presenting neurite length. Neurite length is quantified by counting all the pixels in the "neurite length" image using the "Analyze Particles" command. Step 1) I-neuritesoma1 = Binarize I-new by setThreshold( Th2 , Gmax). Step 2) I-neuritesoma2 = run("Particle Remover") from I-neuritesoma1 . Step 3) I-neuritesoma = run("Skeletonize") on I-neuritesoma2 . Step 4) I-neurite_length = imageCalculator("Subtract create"," I-neuritesoma "," I-soma "). Step 5) Quantify neurite length using "Analyze Particles". The threshold value of Th2 is similarly set to 1 (like Th1 ).
Attachment point extraction
We defined the neurite attachment point as the location where neurite connect to the soma. To obtain the neurite attachment points, a Dilate command with the iteration value of 1 and the count value of 1 is used to increase the size of somata. Dilated soma image was combined with skeleton image using the logical operation "AND". The result image, "stem", consists of single-pixel wide objects located within the soma. An Erode command with the iteration value of 1 and the count value of 7 counts followed by a Subtraction command was then used to isolate the tip pixels of these single-pixel wide objects. The attachment points were "stem-point" pixels that do not intersect with somata. Create an image I-attachment_points for neurite attachment point detection Step 1) I-soma_dilate = run("Dilate") on I-soma Step 2) I-stem = imageCalculator("And create"," I-soma_dilate "," I-neuritesoma ") Step 3) I-stem_erode = run("Erode") on I-stem Step 4) I-stem_points = imageCalculator("Subtract create"," I-stem "," I-stem_erode ") Step 5 I-attachmentpoints = imageCalculator("Subtract create"," I-stem_points "," I-soma ") Step 6) Quantify attachment points using "Analyze Particles".
Ending point extraction
We define the ending point as the location at the tip of neurites. An Erode command with the iteration value of 1 and the count value of 7 was used to remove just one pixel from the tip of a filament. To obtain the neurite ending points, the end pixels of the single-pixel objects in the skeleton image were retained and the resulting pixels that do not intersect with dilated soma were assigned as ending points. Create image I-endpoints for ending point detection. Step 1) I-neurite_erode = run("Erode) on I-neurite_length Step 2) I-tip = imageCalculator("Subtract create"," I-neurite_length "," I-neurite_erode ") Step 3) I-end_points = imageCalculator("Subtract create"," I-tip "," I-soma_dilate ") Step 4) Quantify ending points points using "Analyze Particles".
Proposed method NeurphologyJ The design aims of NeurphologyJ are as following. 1) Minimizing human intervention. It is essential to minimize the human intervention and the number of control parameters without degrading performance during batch processing. A translation of Occam's razor principle suggests that ending up with a large number of user-settable parameters is indicative of poor algorithm design [ 20 ]. An elegant image enhancement method is proposed to facilitate the determination of threshold values of segmentation. 2) Convenience of use. NeuriteTracer [ 14 ] is effective and accurate, but a pair of nuclear and neurite marker images is needed. It is more convenient if a single image of fluorescence microscopy is sufficient to measure neurite outgrowth. Only one channel per image is needed for applying NeurphologyJ. 3) Maximizing the speed. Considering the vast amount of images generated from the high-content screening, a high analyzing speed is crucial to handle such task. NeurphologyJ makes the best use of both global morphology operations of image processing and local geometric properties of lines to speed up the quantification. 4) Achieving high accuracy. There are tradeoffs between the processing speed and the accuracy. For applications in pharmacological discoveries, the ratio of neurite lengths of the treated and non-treated neurons (rather than the absolute neurite length) is the major concern. As a result, NeurphologyJ aims to achieve high coefficient correlation with manual tracing by detecting line pixels of neurites without further using linking algorithms. 5) Robustness. Image segmentation plays an important role in quantifying neuronal morphology. The techniques of local exploration and global processing are combined to deal with the staining or the illumination variation of the high-content screenings. Some settings of threshold values can be automatically derived from the histogram of enhanced neuronal images. 6) Taking advantage of the free software ImageJ. NeurphologyJ makes the best use of ImageJ commands and uses a compact set of Java modules. Being designed as a plugin of ImageJ has the benefit of easy customization for dealing with specific applications or for future expansions. Two versions of NeurphologyJ are provided, interactive and high-throughput. The interactive version is useful for optimizing the parameters for the high-throughput version. The algorithm of NeurphologyJ consists of five parts, one image enhancement part and four morphological quantification parts. The schematic flowchart of NeurphologyJ is shown in Figure 1 . The major commands used in each part and detailed descriptions are shown below. Figure 1 The schematic flowchart of NeurphologyJ . NeurphologyJ consists of five parts, each part is highlighted by a specific color. Arithmetic and logical operations are shown in with logical operations capitalized.
Supplementary Material Additional File 1 User manual . This PDF file is the user's manual for NeurphologyJ interactive and high-throughput versions. It walks the users through step by step. Click here for file
📊 Figures
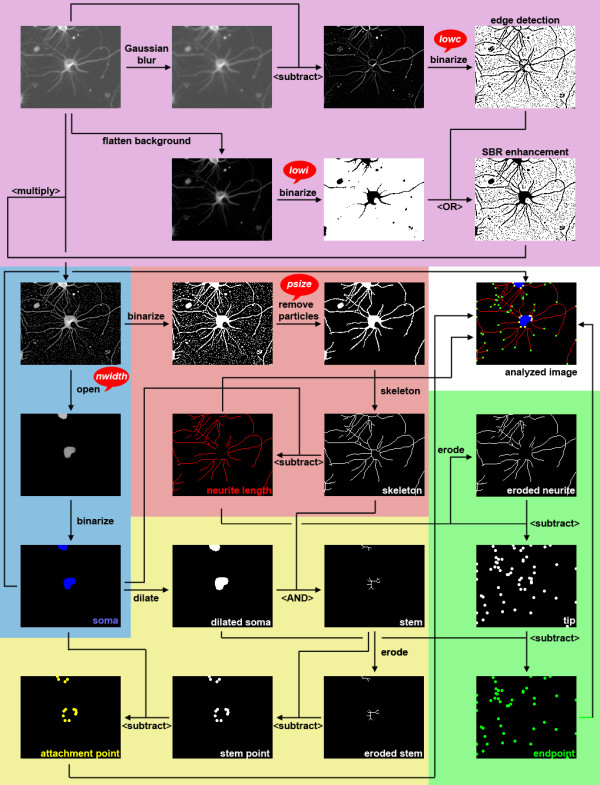
Figure 1
The schematic flowchart of NeurphologyJ . NeurphologyJ consists of five parts, each part is highlighted by a specific color. Arithmetic and logical operations are shown in with logical operations cap...
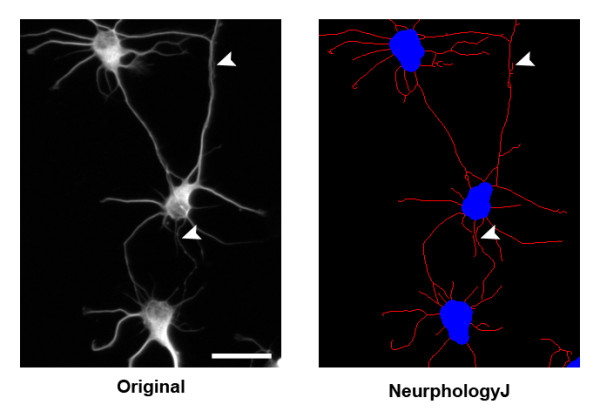
Figure 2
Image enhancement process of NeurphologyJ does not remove thin and dim neurites . Shown here is an example image of mouse hippocampal neurons analyzed by NeurphologyJ. Notice that both thick neurites ...
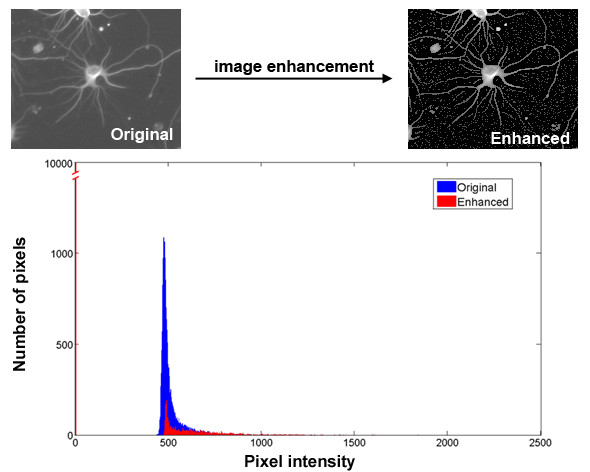
Figure 3
The histograms of the original and the enhanced images . After the enhancement, the background pixels of the original image were identified and their gray levels were set to zero (the red vertical lin...
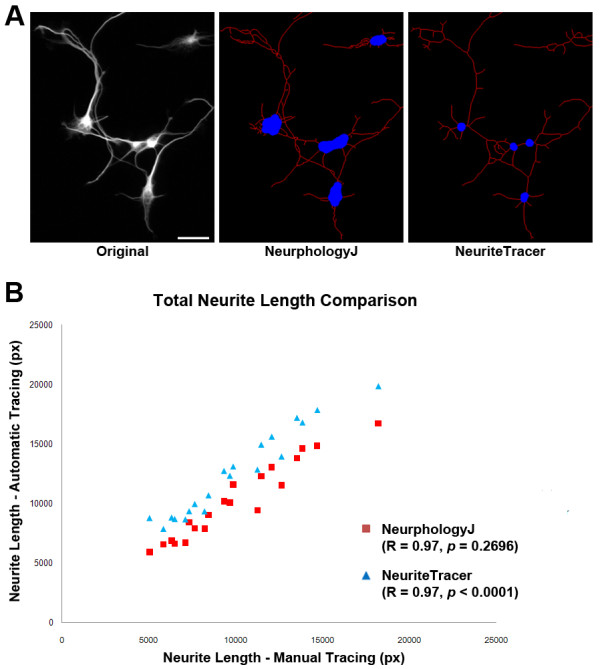
Figure 4
NeurphologyJ produces accurate neurite length estimation in images of primary hippocampal neurons . (A) Example image of mouse hippocampal neurons analyzed by NeurphologyJ and NeuriteTracer. Neurite t...
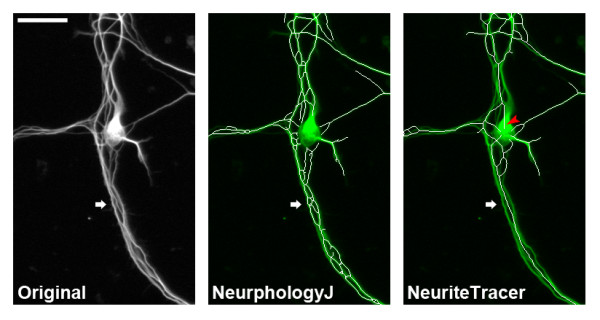
Figure 5
NeurphologyJ can identify neurites that lie in close proximity to each other . Mouse hippocampal neurons immunofluorescence stained were analyzed using NeurphologyJ and NeuriteTracer. Neurite tracings...
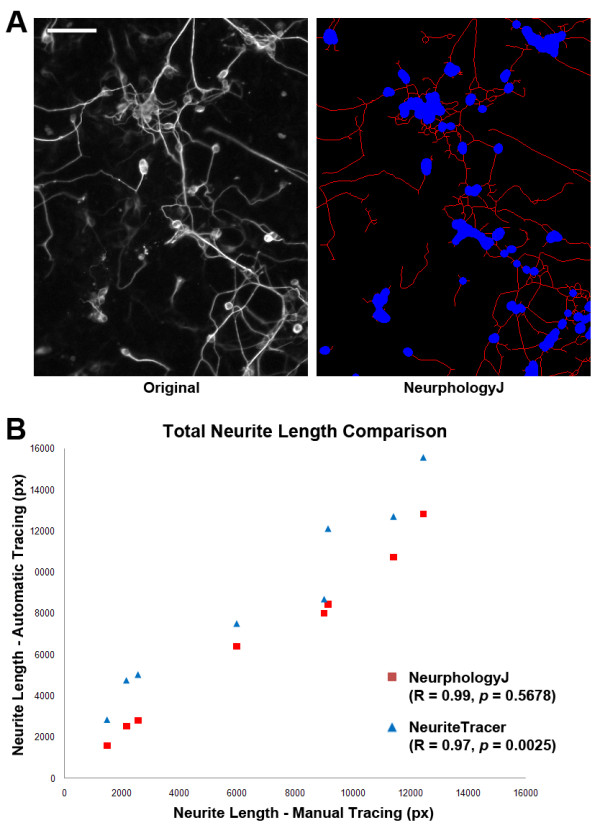
Figure 6
NeurphologyJ produces accurate neurite length estimation in images of P19 neurons . (A) Example image of P19 neurons analyzed by NeurphologyJ. Neurite tracings are shown in red and somata in blue in t...
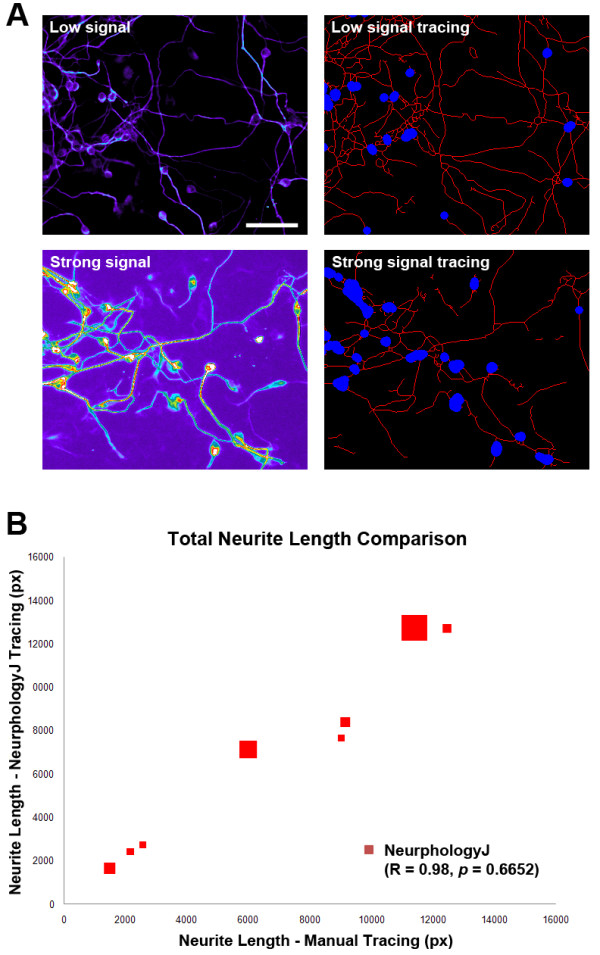
Figure 7
NeurphologyJ produces reliable neurite quantification in images with different signal intensities . (A) Examples of images with different signal intensity analyzed by NeurphologyJ. Original images are...
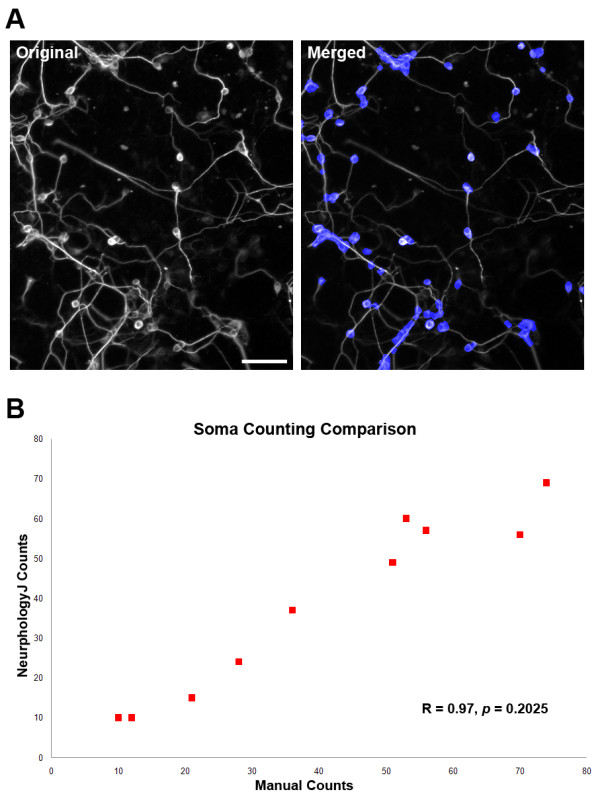
Figure 8
NeurphologyJ produces accurate soma counts . (A) An example of soma quantification on P19 neurons using NeurphologyJ. The merged image shows the NeurphologyJ identified somata in blue and the original...
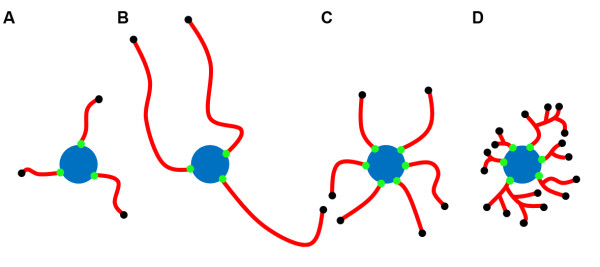
Figure 9
Neurite complexity can be deduced from neurite attachment point and ending point . Examples of neurons with different levels of neurite complexity are shown. Note that neuron A and neuron B can be dis...
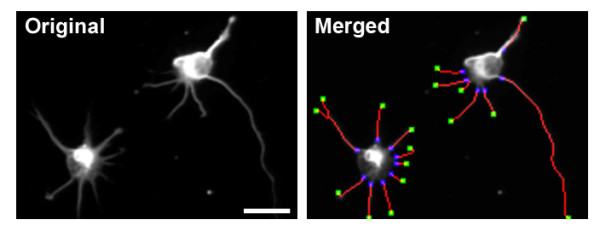
Figure 10
An example of hippocampal neuron image analyzed using NeurphologyJ . NeurphologyJ produces accurate neurite analysis of attachment point and ending point (also refer to Tables 3 and 4). Neurites are s...
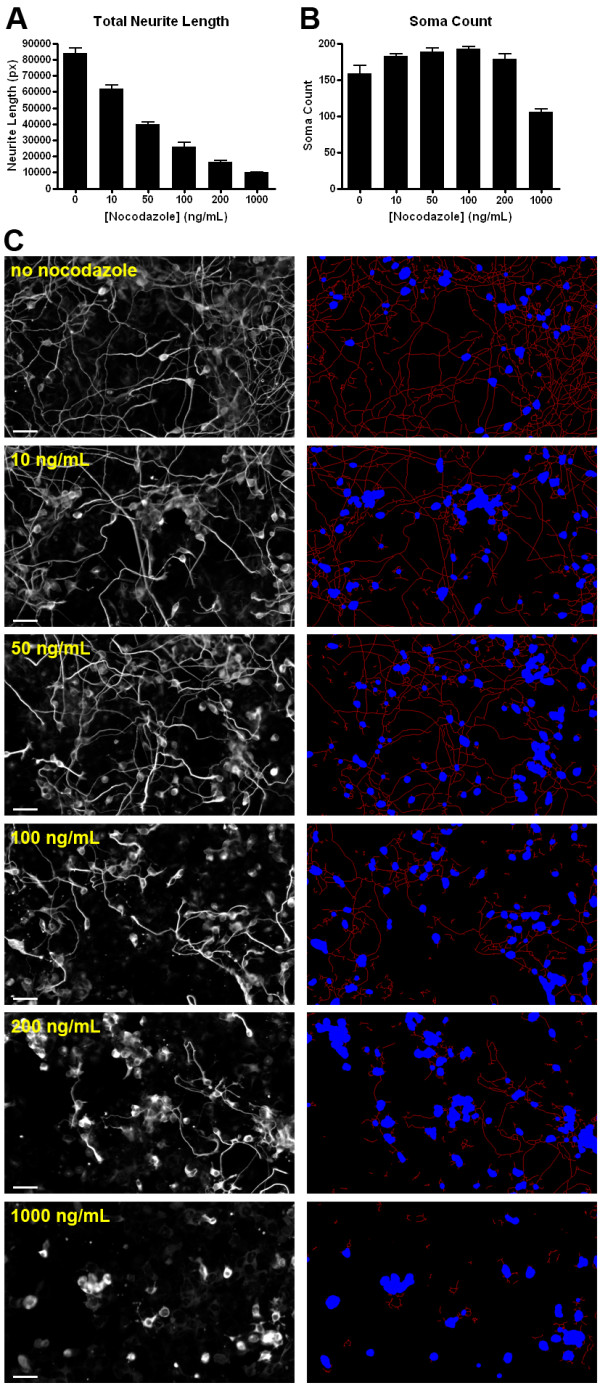
Figure 11
NeurphologyJ can quantify the neurite length reduction effect of nocodazole . (A) Bar graph showing the inverse relationship between the total neurite length and nocodazole concentration in P19 neuron...
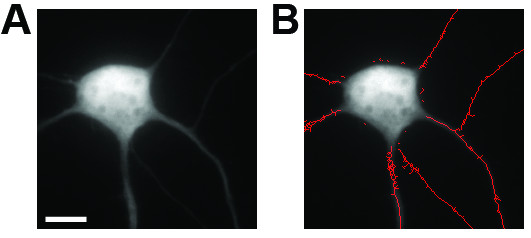
Figure 12
NeurphologyJ produces tree-like tracings when high magnification images are used . Shown here is (A) an example image of a mouse hippocampal neuron acquired using a 60x 1.35 N.A. objective lens and (B...
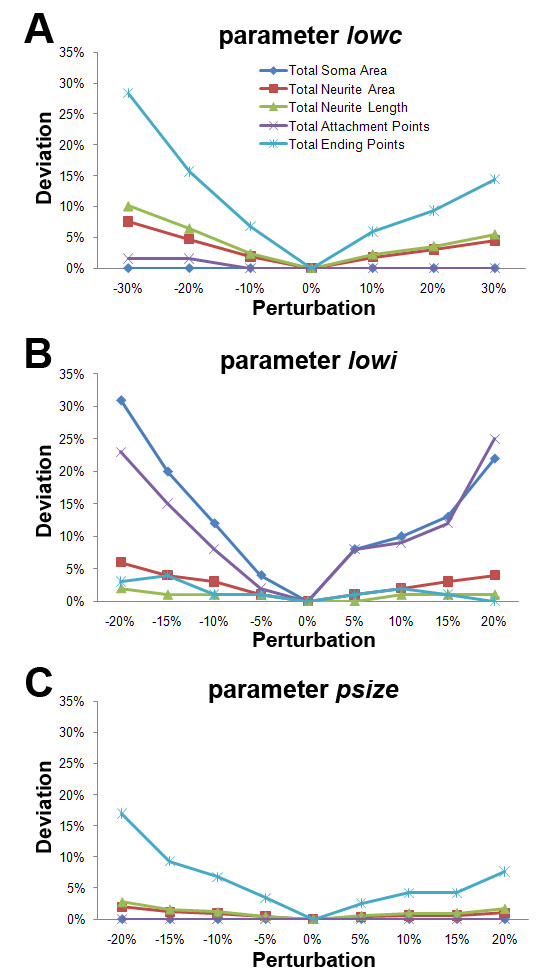
Figure 13
Robustness of each user-defined parameter on a typical image Robustness . The user-defined parameters are individually perturbed while keeping the other two constant. (A) Parameter lowc (the expert us...
Figure images are served from the NIH/NLM PubMed Central Open Access Subset or Europe PMC; copyright remains with the publishers and authors.
💬 Discussion
0 commentsNo comments yet. Be the first to start a discussion!
Leave a Comment