Abstract
AbstractOptogenetics, a widely used technique in neuroscience research, is often limited by its invasive nature of application. Here, we present a noninvasive, ultrasound-based technique to introduce optogenetic channels into the brain by temporarily opening the blood-brain barrier (BBB). We demonstrate the efficiency of the method developed and evaluate the bioactivity of the non-invasively introduced channelrhodopsin channels by performing stimulation in freely behaving mice.
🔬 Techniques
✨ Fluorophores
🧪 Sample Preparation
🔬 Cell Lines
🏭 Microscope Brands
🧪 Reagent Suppliers
💻 Software Details
🏛️ Research Organizations (ROR)
Affiliated research institutions:
📋 Methods
Microbubble and viral vector The lipid-shelled microbubbles were manufactured in-house following a previously published protocol 16 . Briefly, the 1,2-distearoyl-sn-glycero-3-phosphocholine (DSPC) and polyethylene Glycol 2000 (PEG2000) were mixed at a 9:1 ratio. Two milligrams of the mixture was dissolved in a 2 ml solution consisted of filtered PBS/glycerol (10% volume)/propylene glycol (10% volume) using a sonicator (Model 1510, Branson Ultrasonics, Danbury, CT, USA) and stored in a 5 ml vial. The remainder of the vial was filled with decafluorobutane (C 4 F 10 ) gas. The vial was then activated via mechanical agitation using VialMix TM (Lantheus Medical Imaging, N. Billerica, MA) shaker for a pre-set time of 45 s. The formed microbubbles were analyzed with a Coulter Counter Multisizer (Beckman Coulter Inc., Fullerton, CA). The distribution of these microbubbles is shown in Supplementary Fig. 1 and the mean diameter was measured to be 0.9 μm. The viral vectors used in this study was AAV9-mcherry-ChR2 with a titer of 2.48 × 10 13 GC/ml (Penn Vector Core, Philadelphia, PA). The vectors were diluted with phosphate buffered saline (PBS) at a 1:6 ratio before administration. FUS sonication A single element FUS transducer (focal length: 60 mm and radius: 30 mm, Imasonic, France) was used for all sonications in this study. The transducer has a center frequency of 1.5 MHz and a −6 dB focus of 7.5 × 1 × 1 mm 3 as determined by a needle hydrophone ( Supplementary Fig. 2 ). To monitor cavitation events, a pulse-echo transducer (radius: 11.2 mm, focal length: 60 mm, and center frequency: 10 MHz, Olympus NDT, Waltham, MA) was confocally aligned with the FUS transducer. The pulse-echo transducer was driven by a pulser-receiver (Olympus, Waltham, MA), which was connected to a digitizer (Gage Applied technologies, Inc., Lachine, QC, Canada) for data acquisition. The pulse-receiver was operated on a “receive mode” and served as an amplifier during PCD acquisition. The transducer setup was then mounted onto a three-dimensional positioning system (Velmex Inc., Lachine, QC, Canada) for accurate targeting. Targeting of specific brain regions was achieved by first visualizing the lambda suture through the shaved scalp which was described in greater details elsewhere 17 . Briefly, a small water tank with an ultrasound transparent opening was placed on top of the shaved scalp and a metallic cross was used to locate the lambda suture. C-mode ultrasound scans were then carried out to identify the position of the cross and therefore the lambda suture. The FUS transducer was then moved via the positioner to the following coordinates: AP +2.6 mm, ML −2 mm and DV +2.5 mm for hippocampus targeting; AP +6.3 mm, ML −1 mm and DV +0.5 mm for motor cortex targeting. For each target, a single sonication was performed with the following acoustic parameters: a free field (i.e. in water) peak rarefactional pressure (PRP) of 0.74 MPa, pulse repetition frequency (PRF) 5 Hz, pulse length 10 ms, and a total duration of 120 s. The collected cavitation signal was analyzed using a custom written program (MATLAB R2011a, MathWorks, Inc., Natick, MA). The appearance of ultraharmonics and broadband noise was deemed the signature of cavitation events. Immediately prior to the sonication, a mixture of 100 μl diluted AAV vectors and 5 μl microbubbles were injected intravenously via the tail vein. All experimental procedures involving animals were approved by the Columbia University Institutional Animal Care and Use Committee and in accordance to the Office of Laboratory Animal Welfare and the Association for Assessment and Accreditation of Laboratory Care regulations. MRI The BBB opening was confirmed with T1-weighted contrast enhanced MR imaging (9.4 T, Bruker Medical, Boston, MA). Upon the completion of the sonication, a bolus of 0.15 ml of gadodiamide (GD-DTPA) (Omniscan ® , GE Healthcare, Princeton, NJ) was administered intraperitoneally to each mouse. Approximately 50 min post GD-DTPA injection, the mice were placed in a birdcage coil (diameter 3 cm) and imaging was performed with a T1-weighted 2D FLASH sequence (TR/TE 230/3.3 ms, flip angle 70°, 20 slices, 10 averages, bandwidth 100 kHz, matrix size 256 × 256, resolution 100 μm × 100 μm × 400 μm).
Show full methods section
Microbubble and viral vector The lipid-shelled microbubbles were manufactured in-house following a previously published protocol 16 . Briefly, the 1,2-distearoyl-sn-glycero-3-phosphocholine (DSPC) and polyethylene Glycol 2000 (PEG2000) were mixed at a 9:1 ratio. Two milligrams of the mixture was dissolved in a 2 ml solution consisted of filtered PBS/glycerol (10% volume)/propylene glycol (10% volume) using a sonicator (Model 1510, Branson Ultrasonics, Danbury, CT, USA) and stored in a 5 ml vial. The remainder of the vial was filled with decafluorobutane (C 4 F 10 ) gas. The vial was then activated via mechanical agitation using VialMix TM (Lantheus Medical Imaging, N. Billerica, MA) shaker for a pre-set time of 45 s. The formed microbubbles were analyzed with a Coulter Counter Multisizer (Beckman Coulter Inc., Fullerton, CA). The distribution of these microbubbles is shown in Supplementary Fig. 1 and the mean diameter was measured to be 0.9 μm. The viral vectors used in this study was AAV9-mcherry-ChR2 with a titer of 2.48 × 10 13 GC/ml (Penn Vector Core, Philadelphia, PA). The vectors were diluted with phosphate buffered saline (PBS) at a 1:6 ratio before administration. FUS sonication A single element FUS transducer (focal length: 60 mm and radius: 30 mm, Imasonic, France) was used for all sonications in this study. The transducer has a center frequency of 1.5 MHz and a −6 dB focus of 7.5 × 1 × 1 mm 3 as determined by a needle hydrophone ( Supplementary Fig. 2 ). To monitor cavitation events, a pulse-echo transducer (radius: 11.2 mm, focal length: 60 mm, and center frequency: 10 MHz, Olympus NDT, Waltham, MA) was confocally aligned with the FUS transducer. The pulse-echo transducer was driven by a pulser-receiver (Olympus, Waltham, MA), which was connected to a digitizer (Gage Applied technologies, Inc., Lachine, QC, Canada) for data acquisition. The pulse-receiver was operated on a “receive mode” and served as an amplifier during PCD acquisition. The transducer setup was then mounted onto a three-dimensional positioning system (Velmex Inc., Lachine, QC, Canada) for accurate targeting. Targeting of specific brain regions was achieved by first visualizing the lambda suture through the shaved scalp which was described in greater details elsewhere 17 . Briefly, a small water tank with an ultrasound transparent opening was placed on top of the shaved scalp and a metallic cross was used to locate the lambda suture. C-mode ultrasound scans were then carried out to identify the position of the cross and therefore the lambda suture. The FUS transducer was then moved via the positioner to the following coordinates: AP +2.6 mm, ML −2 mm and DV +2.5 mm for hippocampus targeting; AP +6.3 mm, ML −1 mm and DV +0.5 mm for motor cortex targeting. For each target, a single sonication was performed with the following acoustic parameters: a free field (i.e. in water) peak rarefactional pressure (PRP) of 0.74 MPa, pulse repetition frequency (PRF) 5 Hz, pulse length 10 ms, and a total duration of 120 s. The collected cavitation signal was analyzed using a custom written program (MATLAB R2011a, MathWorks, Inc., Natick, MA). The appearance of ultraharmonics and broadband noise was deemed the signature of cavitation events. Immediately prior to the sonication, a mixture of 100 μl diluted AAV vectors and 5 μl microbubbles were injected intravenously via the tail vein. All experimental procedures involving animals were approved by the Columbia University Institutional Animal Care and Use Committee and in accordance to the Office of Laboratory Animal Welfare and the Association for Assessment and Accreditation of Laboratory Care regulations. MRI The BBB opening was confirmed with T1-weighted contrast enhanced MR imaging (9.4 T, Bruker Medical, Boston, MA). Upon the completion of the sonication, a bolus of 0.15 ml of gadodiamide (GD-DTPA) (Omniscan ® , GE Healthcare, Princeton, NJ) was administered intraperitoneally to each mouse. Approximately 50 min post GD-DTPA injection, the mice were placed in a birdcage coil (diameter 3 cm) and imaging was performed with a T1-weighted 2D FLASH sequence (TR/TE 230/3.3 ms, flip angle 70°, 20 slices, 10 averages, bandwidth 100 kHz, matrix size 256 × 256, resolution 100 μm × 100 μm × 400 μm).
Surgery and optical stimulation
For mice that received direct virus infusion, the following procedures were carried out. Mice were anesthetized with a mixture of oxygen and 1–3% isoflurane (SurgiVet, Smiths Medical PM, Inc., WI) and placed prone with its head immobilized by a stereotaxic apparatus (David Kopf Instruments, Tujunga, CA). The head was shaved and an incision was made to expose the skull. The hippocampus was located using the following coordinates centered at the bregma: AP −2.7 mm, ML −2 mm and DV +1.5 mm. A 34 G needle (Hamilton, Reno, NV) was used to infuse a total volume of 0.8 μl AAV vectors at approximately 0.003 μl/s. Upon completion, the needle was left in place for an additional 5 min to minimize back flow. Mice that received either FUS-facilitated viral delivery (N = 3) or direct infusion (N = 3) were allowed to survive two weeks before the implantation surgery. An optical fiber (Thorlabs Inc. Newton, NJ) and microdrive (Axona Ltd. UK) assembly was implanted to the targeted brain region for optical stimulation and neural activity recording. About 3–4 jeweler’s screws were inserted into the skull to support the implants. An additional screw connected with wire was also inserted into the skull which served as a reference electrode. Dental cement was spread across the exposed skull to secure the optical fiber and the microdrive assembly. The mice were allowed one day to recover from the surgery before undergoing optical stimulation. During each session, the optical fiber was connected to a LED light source and was stimulated with four 2-second pulses and one 10-second pulse of 470 nm (blue) light at 30 Hz frequency. The mouse implanted with electrodes was plugged to the electrophysiology setup (Axona) during each stimulation and neuronal activity was recorded as described previously 11 . The recorded signals were analyzed and visualized with a custom-written program (MATLAB R2011a, MathWorks, Inc., Natick, MA). To quantify the number of spikes, a threshold was set at three standard deviations above the mean of the resting state signals. Peaks above the threshold were deemed to be a spike and was binned into either 0.4 s or 0.5 s segments. The firing rate was quantified as the total number of spikes per second.
Histology and imaging
One hour post optical stimulations (for maximal c-Fos expression), mice were sacrificed and transcardially perfused with 30 mL PBS and followed by 60 mL 4% paraformaldehyde. The skull was removed upon sacrifice and the brain was soaked in paraformaldehyde overnight. The brain tissue was then cryo-protected with 30% sucrose solution for 48 hours and frozen on dry ice. Brain samples were sectioned coronally at 40 μm and mounted with ProLong ® Gold mounting solution with DAPI (ThermoFisher, Waltham, MA) to examine the distribution of ChR2 (mcherry). Neuronal activation was visualized via immunochemistry staining for c-Fos proteins. Brain sections were incubated with primary anti-c-Fos antibody (ab209794, Abcam, Cambridge, MA) at 1:100 dilution, and secondary antibody ( R37116 , ThermoFisher, Waltham, MA) at 1:250 dilution. All fluorescence images were taken with a Nikon confocal microscope (Nikon Instruments Inc., Melville, NY). A separate group of mice (N = 3) was used to evaluate the safety aspects of the FUS sonication. One day post the sonication, these mice were sacrificed as previously described and soaked in paraformaldehyde for two days. The brains were then paraffin fixed and serially sectioned at 7 μm. The structural integrity of the brain was examined via Hematoxylin and Eosin (H&E) staining and Nissl staining. Potential inflammatory response was evaluated by staining for microglia. The paraffin sections first underwent antigen retrieval process followed by incubation in primary anti-Iba-1 antibody (1:200, ab5076, Abcam, Cambridge, MA) and secondary donkey anti-goat Alexa 488 (1:200, A-11055, Invitrogen, Carlsbad, CA).
Statistical analysis
All statistical analyses were performed using GraphPad software (GraphPad Software, Inc., La Jolla, CA, USA). Unpaired two-tailed Student’s t-test was used to compare the volume of macromolecule delivery and a p-value < 0.05 was considered statistically significant.
Supplementary Material Supplementary Figure 1
📊 Figures
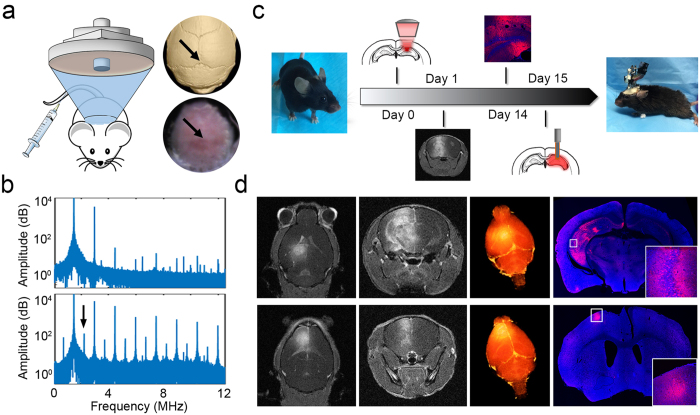
Figure 1
FUS-facilitated viral delivery of ChR2 protein and safety evaluation.
( a ) Experimental schematic and the targeted brain region was precisely located by identifying the lambda suture through shaved scalp. ( b ) The timeline for our technique. Subjects first received sy...
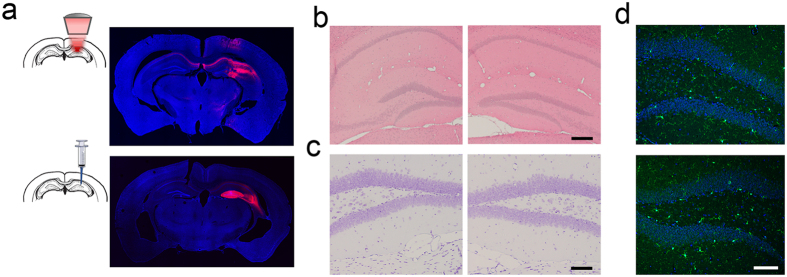
Figure 2
( a ) Comparison of ChR2 expression using FUS-facilitated viral delivery (top) and the direct infusion technique (bottom). ( b-c ) Hematoxylin and Eosin (H&E) staining ( b ) and Nissl staining ( c ) w...
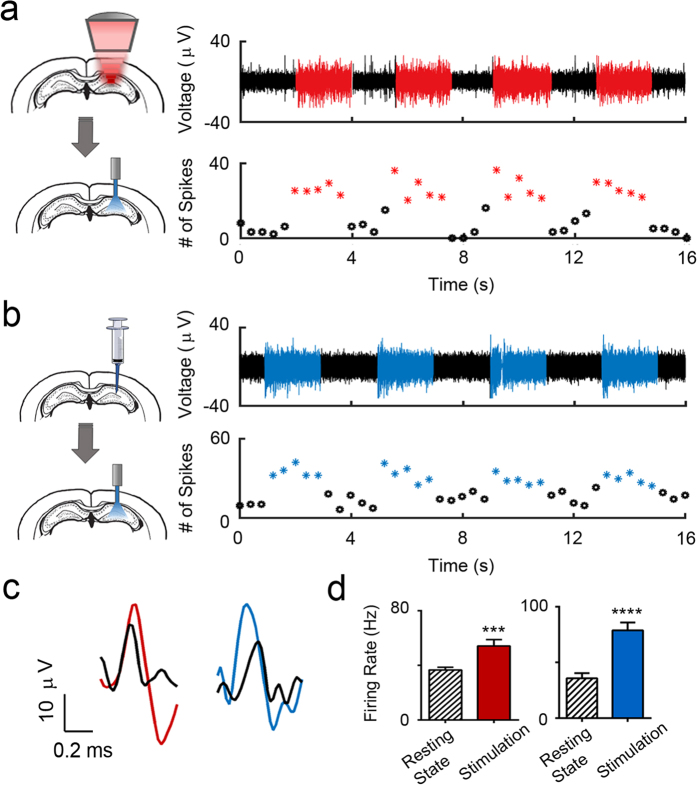
Figure 3
The bioactivity of FUS-facilitated viral delivery was tested via optical stimulation.
( a ) Four 2u2009s blue light (470u2009nm) pulses were given to elicit neuronal response in freely behaving mice. FUS-facilitated viral delivery was carried out in these mice (Nu2009=u20093) targeting...
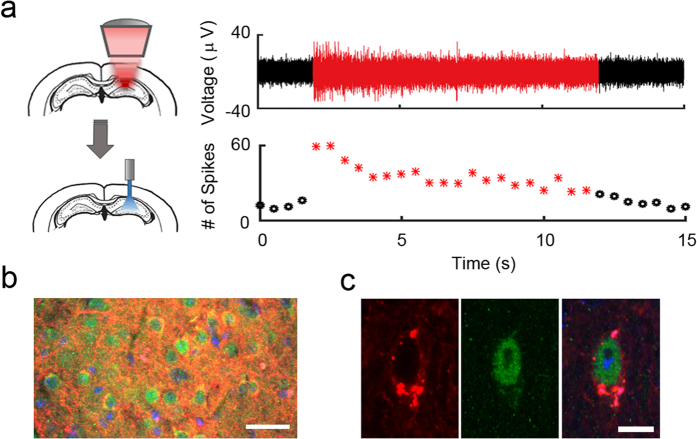
Figure 4
( a ) Ten-second long pulses were also applied (red). An increased spike amplitude and number of spikes were observed at the onset of stimulation, which was followed by a gradual decrease to baseline ...
Figure images are served from the NIH/NLM PubMed Central Open Access Subset or Europe PMC; copyright remains with the publishers and authors.
💬 Discussion
0 commentsNo comments yet. Be the first to start a discussion!
Leave a Comment