Abstract
Two-photon excitation microscopy can image retinal molecular processes in vivo. Intrinsically fluorescent retinyl esters in subcellular structures called retinosomes are an integral part of the visual chromophore regeneration pathway. Fluorescent condensation products of all-trans-retinal accumulate in the eye with age and are also associated with age-related macular degeneration (AMD). Here, we report repetitive, dynamic imaging of these compounds in live mice through the pupil of the eye. By leveraging advanced adaptive optics, we developed a data acquisition algorithm that permitted the identification of retinosomes and condensation products in the retinal pigment epithelium by their characteristic localization, spectral properties and absence in genetically modified or drug-treated mice. This imaging approach has the potential to detect early molecular changes in retinoid metabolism that trigger light- and AMD-induced retinal defects and to assess the effectiveness of treatments for these conditions.
🔬 Techniques
🔭 Microscopes
💻 Software
✨ Fluorophores
🏭 Microscope Brands
🔴 Lasers
📷 Detectors
🎨 Filters
💻 Software Details
🏛️ Research Organizations (ROR)
Affiliated research institutions:
📋 Methods
Mice
All animal procedures and experiments were approved by the Institutional Animal Care and Use Committee at Case Western Reserve University and conformed to recommendations of both the American Veterinary Medical Association Panel on Euthanasia and the Association for Research in Vision and Ophthalmology. B6(Cg)-Tyr c-2J /J mice were purchased from The Jackson Laboratory. Abca4 −/− Rdh8 −/− (DKO) and Rpe65 −/− mice were generated and genotyped as previously described 5 . Human opsin–GFP fusion, knock–in hrhoG/hrhoG mice, expressing human rhodopsin–GFP in photoreceptor outer segments were kindly provided by Dr. John H. Wilson (Baylor College of Medicine) 27 . All mice were housed in the animal facility at the School of Medicine, Case Western Reserve University, where they were provided with a regular mouse chow diet and maintained either under complete darkness or in a 12 h light (∼10 lux)/12 h dark cyclic environment. Euthanasia was performed in compliance with American Veterinary Medical Association (AVMA) Guidelines on Euthanasia, and approval by the Case Western Reserve University Institutional Animal Care and Use Committee. All mice used in this study were between 1–6-month-old. We used both male and female animals. DKO mouse pupils were dilated with 1% tropicamide prior to bright white light exposure at 10,000 lux (150 W spiral lamp, Commercial Electric) for 60 min. After bright light exposure animals were housed in the dark until subsequent imaging sessions.
Two-photon imaging to assess
RPE and retinal changes was performed 7 and 14 days after bright light exposure. Two–photon imaging was done through mouse eye pupil unless otherwise indicated, and either in vivo or with freshly enucleated mouse eyes for ex vivo imaging. For in vivo imaging, mice were anesthetized with an intraperitoneal injection of anesthetic solution consisting of ketamine (15 mg/ml), xylazine (3 mg/ml) and acepromazine 0.5 mg/ml diluted with water at a dose of 10 μl/g body weight (bw). To enhance the visibility of retinosomes, WT mice without any drug treatment or treated with Ret–NH 2 were exposed to 5,000 lux of white light for 5–30 min, 1 to 3 h before imaging. OCT OCT imaging to verify retina integrity after TPM imaging was performed using SD-OCT Envisu R2200 (Bioptigen, Morrisville, NC) Retinylamine treatment Ret–NH 2 was synthesized as described previously 20 . Mice (4– to 6-week-old) were gavaged with 2 mg of Ret–NH 2 solubilized in 100 μl soybean oil 13 to 16 h prior to bright light exposure. Two-photon imaging was performed 7 and 14 days after bright light exposure. After treatment with Ret–NH 2 the content of fluorescent retinyl esters increases in the eye as reported previously 20 , 41 . However, 7 days after treatment that increase has already diminished 42 . For quantification of the impact of drug treatment, the same detector settings were used for mice that were treated and not treated with Ret–NH 2 . This also applied to imaging with either 730 nm or 850 nm excitation. To prevent overload of the detector in this experiment, the settings were optimized to visualize condensation products (not retinyl esters), which were abundant in animals that were not treated with Ret–NH 2 . This is why outlines of RPE cell borders are only very slightly visible in animals that were treated with Ret–NH 2 . The fluorescence intensity was brighter 14 days after light exposure than 7 days after exposure because it took some time for RPE cells to accumulate condensation products resulting from light exposure in mice that were not treated with Ret–NH 2 . Two–photon imaging system for mouse retina and RPE To achieve 2PE images of the retina and RPE with laser light entering through the mouse eye pupil, we modified the Leica (Wetzlar, Germany) TCS SP5 to include: an upright DM600 microscope stand, a Chameleon Vision–S (Coherent, Santa Clara, CA) femtosecond laser, an objective with a 0.5 numerical aperture and 15 mm working distance, and a custom adaptive optics system including a deformable mirror (DM) (see Fig. 1a, 1b ). The tunable, 690–1050 nm, Chameleon Vision–S generated 75 fs laser pulses at 80 MHz pulse repetition frequency. To minimize laser pulse duration at the sample, the laser was equipped with a group velocity dispersion pre–compensation (DC) unit with a 0 to 43,000 fs 2 range. Laser beam power was controlled with an electro–optic modulator (EOM) contained within a safety box. After the EOM, the laser beam was directed to the adaptive optics component, namely DM, by the fold mirror on a kinematic magnetic base (FMK1). The laser beam was coupled to the DM with expander lenses L1 and L2 ( Fig. 1c ). A micro-electro-mechanical system DM (Boston Micromachines Corp., Cambridge MA) with 140 actuators, a 5.5 μm stroke, and gold coating provided fine focus adjustment and correction of aberrations introduced by the sample. In two–photon imaging, the excitation matters most because the emission fluorescence is generated only in the focal spot; therefore, it is critical to achieve a tightly focused excitation beam. Only the excitation light was modulated by the DM, which shape was controlled with software based on image quality metric feedback without the use of a wavefront sensor and associated components 7 , 39 , 43 . This design reduced the cost of the system and its footprint. Lenses L3 and L4 reduced the size of the beam which, after reflecting off the second fold mirror on a kinematic magnetic base (FMK2), was directed to the scan mirrors. The scan mirrors which operated with typical line frequency of 400 to 700 Hz and 512 to 1024 lines per frame, and typical pixel dwell time of 1.46 μs, were located at the plane conjugate to the back aperture of the 0.5 numerical aperture (NA) objective. In this configuration, the laser beam overfilled the mouse eye to take advantage of the NA of the dilated pupil. Laser power entering mouse pupil was 7.4 mW, based on an estimated 3.2 mm laser beam diameter and a 2 mm mouse eye pupil. We verified that estimate by placing a 2 mm iris at a location corresponding to the mouse eye pupil and measuring 8.5 mW using a laser power meter. Additionally, we measured that the needed laser light levels could be cut by over 25%. Only 6.3 mW of laser power was needed for imaging with this HYD detector, as compared to 8.5 mW of laser power required to obtain TPM images with the PMT detector. This represents over a 25% reduction in required laser power. This reduction is consistent with the HYD detector's higher quantum yield. At 500 nm, the quantum yield of the HYD detector was ∼ 45 % as compared to the 27 % quantum yield of the PMT R6357 detector used throughout the study, ( Supplementary Fig. 3 ). The fluorescence detector was located as close to the sample as possible to minimize loss of light available for image formation. Two–photon excited fluorescence leaving mouse eye pupil was collected by the same 0.5 NA lens, and directed to the photomultiplier tube (PMT) detector, Hamamatsu R6357, in a non–descanned manner after the excitation light was reflected off the dichroic mirror (DCh) and filtered by the 680SPET Leica filter. 2PE spectra were obtained with a spectrally sensitive detector in a descanned configuration. For ex vivo imaging, the mouse eye was submerged in phosphate–buffered saline composed of 9.5 mM sodium phosphate, 137 mM NaCl and 2.7 mM KCl, and pH 7.4, with the pupil facing the excitation laser beam. For in vivo mouse imaging, the animal was surrounded by a heating pad and placed on a mechanical stage, which provided controlled movement around two rotational and in three translational axes (Bioptigen, Morrisville, NC). The mouse eye was covered with GenTeal gel that provided lubrication and refractive index matching with the RGP hard contact lens with a refractive index of 1.46, a radius of 1.7 mm and a flat front surface (Cantor and Nissel, Northamptonshire, UK). This contact lens directed laser light into the mouse eye, compensated for the refractive power of the cornea–air interface, minimized the impact of corneal deformities and protected cornea from drying during the imaging session. No changes to the cornea and lens were detectable using a low magnification sectioning microscope after completion of the imaging. Additionally, four weeks after TPM imaging of Rpe65 −/− mice, we used OCT to check for integrity of retinal layers. No differences were noted between mice that were imaged with TPM and control age–matched Rpe65 −/− mice that were not imaged. Specifically, the outer nuclear layer average thickness in mice imaged with TPM was equal to 0.040 mm, with standard deviation of 0.002 mm, whereas corresponding measurements in control mice that were not imaged with TPM were 0.037 mm and 0.004 mm ( Supplementary Fig. 4 ). The scale bars displayed in the images were estimated by comparing measurements of en face TPM images of optic disks and histological sections. LAS AF Leica software and raw image data were used for quantification of fluorescent granules and fluorescence. Granules were counted in the inferior/central portion of the retina. The area selected was about 100 μm away from the edge of the optic disc. The RPE sampling area was kept between 0.05 mm 2 to 0.1 mm 2 for each eye. An example of the distribution of fluorescent granules around the optic disc is shown in Fig. 3e . To calculate resolution along the optical axis (z-axis) as described in results referring to Fig. 2d , we used 730 nm excitation, the numerical aperture (NA) of the mouse eye equal to 0.4 and the coefficient of refraction of the vitreous humor equal to 1.33 44 .
Show full methods section
Mice
All animal procedures and experiments were approved by the Institutional Animal Care and Use Committee at Case Western Reserve University and conformed to recommendations of both the American Veterinary Medical Association Panel on Euthanasia and the Association for Research in Vision and Ophthalmology. B6(Cg)-Tyr c-2J /J mice were purchased from The Jackson Laboratory. Abca4 −/− Rdh8 −/− (DKO) and Rpe65 −/− mice were generated and genotyped as previously described 5 . Human opsin–GFP fusion, knock–in hrhoG/hrhoG mice, expressing human rhodopsin–GFP in photoreceptor outer segments were kindly provided by Dr. John H. Wilson (Baylor College of Medicine) 27 . All mice were housed in the animal facility at the School of Medicine, Case Western Reserve University, where they were provided with a regular mouse chow diet and maintained either under complete darkness or in a 12 h light (∼10 lux)/12 h dark cyclic environment. Euthanasia was performed in compliance with American Veterinary Medical Association (AVMA) Guidelines on Euthanasia, and approval by the Case Western Reserve University Institutional Animal Care and Use Committee. All mice used in this study were between 1–6-month-old. We used both male and female animals. DKO mouse pupils were dilated with 1% tropicamide prior to bright white light exposure at 10,000 lux (150 W spiral lamp, Commercial Electric) for 60 min. After bright light exposure animals were housed in the dark until subsequent imaging sessions.
Two-photon imaging to assess
RPE and retinal changes was performed 7 and 14 days after bright light exposure. Two–photon imaging was done through mouse eye pupil unless otherwise indicated, and either in vivo or with freshly enucleated mouse eyes for ex vivo imaging. For in vivo imaging, mice were anesthetized with an intraperitoneal injection of anesthetic solution consisting of ketamine (15 mg/ml), xylazine (3 mg/ml) and acepromazine 0.5 mg/ml diluted with water at a dose of 10 μl/g body weight (bw). To enhance the visibility of retinosomes, WT mice without any drug treatment or treated with Ret–NH 2 were exposed to 5,000 lux of white light for 5–30 min, 1 to 3 h before imaging. OCT OCT imaging to verify retina integrity after TPM imaging was performed using SD-OCT Envisu R2200 (Bioptigen, Morrisville, NC) Retinylamine treatment Ret–NH 2 was synthesized as described previously 20 . Mice (4– to 6-week-old) were gavaged with 2 mg of Ret–NH 2 solubilized in 100 μl soybean oil 13 to 16 h prior to bright light exposure. Two-photon imaging was performed 7 and 14 days after bright light exposure. After treatment with Ret–NH 2 the content of fluorescent retinyl esters increases in the eye as reported previously 20 , 41 . However, 7 days after treatment that increase has already diminished 42 . For quantification of the impact of drug treatment, the same detector settings were used for mice that were treated and not treated with Ret–NH 2 . This also applied to imaging with either 730 nm or 850 nm excitation. To prevent overload of the detector in this experiment, the settings were optimized to visualize condensation products (not retinyl esters), which were abundant in animals that were not treated with Ret–NH 2 . This is why outlines of RPE cell borders are only very slightly visible in animals that were treated with Ret–NH 2 . The fluorescence intensity was brighter 14 days after light exposure than 7 days after exposure because it took some time for RPE cells to accumulate condensation products resulting from light exposure in mice that were not treated with Ret–NH 2 . Two–photon imaging system for mouse retina and RPE To achieve 2PE images of the retina and RPE with laser light entering through the mouse eye pupil, we modified the Leica (Wetzlar, Germany) TCS SP5 to include: an upright DM600 microscope stand, a Chameleon Vision–S (Coherent, Santa Clara, CA) femtosecond laser, an objective with a 0.5 numerical aperture and 15 mm working distance, and a custom adaptive optics system including a deformable mirror (DM) (see Fig. 1a, 1b ). The tunable, 690–1050 nm, Chameleon Vision–S generated 75 fs laser pulses at 80 MHz pulse repetition frequency. To minimize laser pulse duration at the sample, the laser was equipped with a group velocity dispersion pre–compensation (DC) unit with a 0 to 43,000 fs 2 range. Laser beam power was controlled with an electro–optic modulator (EOM) contained within a safety box. After the EOM, the laser beam was directed to the adaptive optics component, namely DM, by the fold mirror on a kinematic magnetic base (FMK1). The laser beam was coupled to the DM with expander lenses L1 and L2 ( Fig. 1c ). A micro-electro-mechanical system DM (Boston Micromachines Corp., Cambridge MA) with 140 actuators, a 5.5 μm stroke, and gold coating provided fine focus adjustment and correction of aberrations introduced by the sample. In two–photon imaging, the excitation matters most because the emission fluorescence is generated only in the focal spot; therefore, it is critical to achieve a tightly focused excitation beam. Only the excitation light was modulated by the DM, which shape was controlled with software based on image quality metric feedback without the use of a wavefront sensor and associated components 7 , 39 , 43 . This design reduced the cost of the system and its footprint. Lenses L3 and L4 reduced the size of the beam which, after reflecting off the second fold mirror on a kinematic magnetic base (FMK2), was directed to the scan mirrors. The scan mirrors which operated with typical line frequency of 400 to 700 Hz and 512 to 1024 lines per frame, and typical pixel dwell time of 1.46 μs, were located at the plane conjugate to the back aperture of the 0.5 numerical aperture (NA) objective. In this configuration, the laser beam overfilled the mouse eye to take advantage of the NA of the dilated pupil. Laser power entering mouse pupil was 7.4 mW, based on an estimated 3.2 mm laser beam diameter and a 2 mm mouse eye pupil. We verified that estimate by placing a 2 mm iris at a location corresponding to the mouse eye pupil and measuring 8.5 mW using a laser power meter. Additionally, we measured that the needed laser light levels could be cut by over 25%. Only 6.3 mW of laser power was needed for imaging with this HYD detector, as compared to 8.5 mW of laser power required to obtain TPM images with the PMT detector. This represents over a 25% reduction in required laser power. This reduction is consistent with the HYD detector's higher quantum yield. At 500 nm, the quantum yield of the HYD detector was ∼ 45 % as compared to the 27 % quantum yield of the PMT R6357 detector used throughout the study, ( Supplementary Fig. 3 ). The fluorescence detector was located as close to the sample as possible to minimize loss of light available for image formation. Two–photon excited fluorescence leaving mouse eye pupil was collected by the same 0.5 NA lens, and directed to the photomultiplier tube (PMT) detector, Hamamatsu R6357, in a non–descanned manner after the excitation light was reflected off the dichroic mirror (DCh) and filtered by the 680SPET Leica filter. 2PE spectra were obtained with a spectrally sensitive detector in a descanned configuration. For ex vivo imaging, the mouse eye was submerged in phosphate–buffered saline composed of 9.5 mM sodium phosphate, 137 mM NaCl and 2.7 mM KCl, and pH 7.4, with the pupil facing the excitation laser beam. For in vivo mouse imaging, the animal was surrounded by a heating pad and placed on a mechanical stage, which provided controlled movement around two rotational and in three translational axes (Bioptigen, Morrisville, NC). The mouse eye was covered with GenTeal gel that provided lubrication and refractive index matching with the RGP hard contact lens with a refractive index of 1.46, a radius of 1.7 mm and a flat front surface (Cantor and Nissel, Northamptonshire, UK). This contact lens directed laser light into the mouse eye, compensated for the refractive power of the cornea–air interface, minimized the impact of corneal deformities and protected cornea from drying during the imaging session. No changes to the cornea and lens were detectable using a low magnification sectioning microscope after completion of the imaging. Additionally, four weeks after TPM imaging of Rpe65 −/− mice, we used OCT to check for integrity of retinal layers. No differences were noted between mice that were imaged with TPM and control age–matched Rpe65 −/− mice that were not imaged. Specifically, the outer nuclear layer average thickness in mice imaged with TPM was equal to 0.040 mm, with standard deviation of 0.002 mm, whereas corresponding measurements in control mice that were not imaged with TPM were 0.037 mm and 0.004 mm ( Supplementary Fig. 4 ). The scale bars displayed in the images were estimated by comparing measurements of en face TPM images of optic disks and histological sections. LAS AF Leica software and raw image data were used for quantification of fluorescent granules and fluorescence. Granules were counted in the inferior/central portion of the retina. The area selected was about 100 μm away from the edge of the optic disc. The RPE sampling area was kept between 0.05 mm 2 to 0.1 mm 2 for each eye. An example of the distribution of fluorescent granules around the optic disc is shown in Fig. 3e . To calculate resolution along the optical axis (z-axis) as described in results referring to Fig. 2d , we used 730 nm excitation, the numerical aperture (NA) of the mouse eye equal to 0.4 and the coefficient of refraction of the vitreous humor equal to 1.33 44 .
Image acquisition algorithm
After focusing on the mouse RPE with a mechanical stage, optimization of the DM surface provided fine adjustments of focus and the excitation wavefront. Six Zernike modes were used as the set of basis functions for deformation of the DM surface. Zernike modes are a set of polynomials that are orthogonal to one another and frequently used to describe ophthalmic aberrations 45 . The six modes used were Z 2 0 , Z 2 2 , Z 2 2 , Z 3 1 Z 3 1 , Z 4 0 45 . The aberration compensation, φ , provided by the DM was Φ=Σ α j Z j , where Z j is the Zernike mode with index j and the coefficient α j is the contribution of Z j . The coefficients were constrained such that −1.0< α j 0.05 were considered not statistically significant.
Supplementary Material 1 2 Supplementary Video 1 . Imaging retina at different depths. 50 images were obtained ex vivo along the Z axis in an eye of a 2-month-old WT mouse. Details of different layers come into focus as the Z-axis translation stage moves at even intervals. The first image shows the nerve fiber layer and the 50 th image is just behind RPE. The optic disc is in the upper right corner. 3 Supplementary Video 2 . Stochastic parallel gradient descent (SPGD) optimization of imaging Rpe65 −/− mice. Forty steps of optimization were conducted, and the corresponding forty images for the trajectory are shown. The 30 th image is the one with the best normalized variance (shown in Fig. 4c ).
📊 Figures
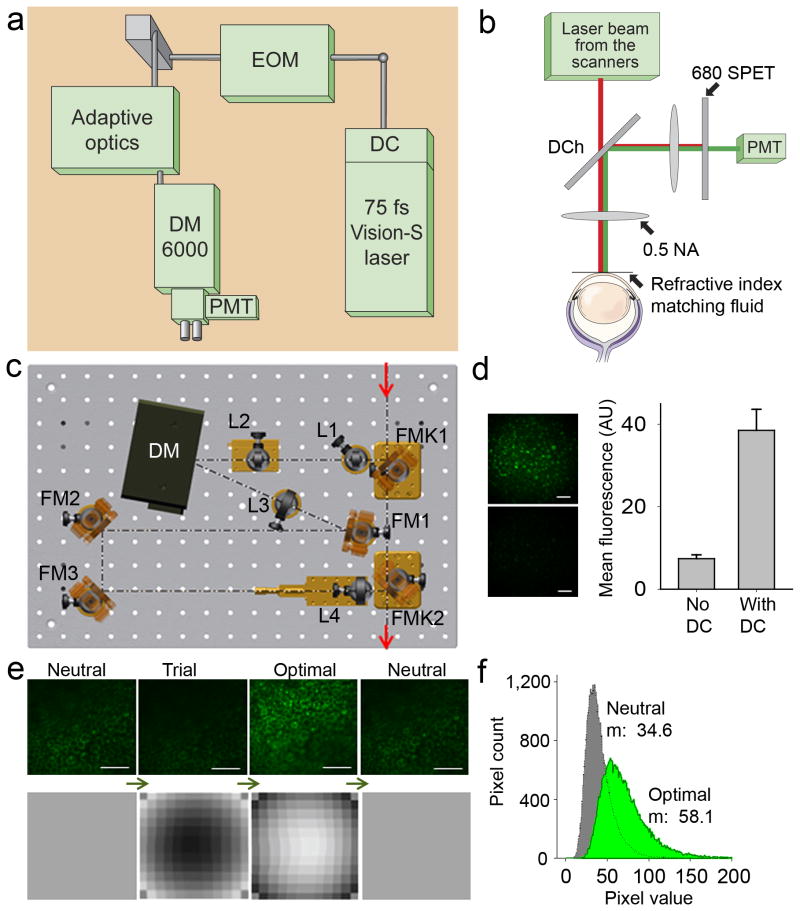
Figure 1
Two-photon microscopy (TPM) for imaging of mouse retina and RPE. ( a ) TPM system layout. DC stands for group velocity dispersion preu2013compensation; EOM - electrou2013optic modulator; DM6000 - upri...
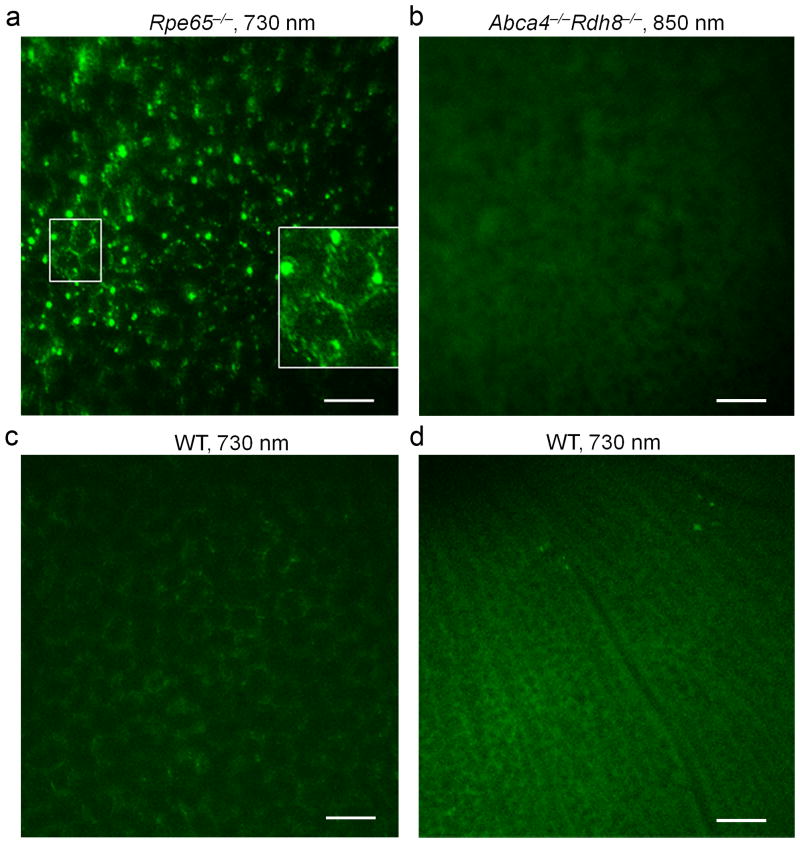
Figure 2
Twou2013photon images of ex vivo mouse RPE and retina obtained through the mouse eye pupil. Excitation wavelengths and genetic background are listed in each image. ( a ) The RPE in 3-month-old Rpe65 u...
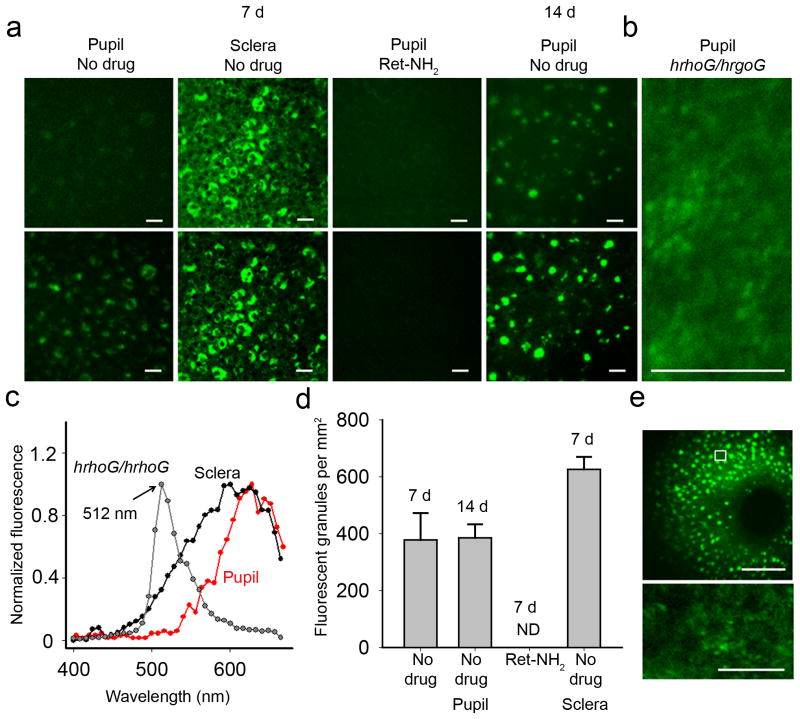
Figure 3
Use of two-photon imaging for ophthalmic drug screening. ( a ) Retu2013NH 2 protects RPE of 1-month-old Abca4 u2212/u2212 Rdh8 u2212/u2212 mouse from bright light induced accumulation of fluorescent g...
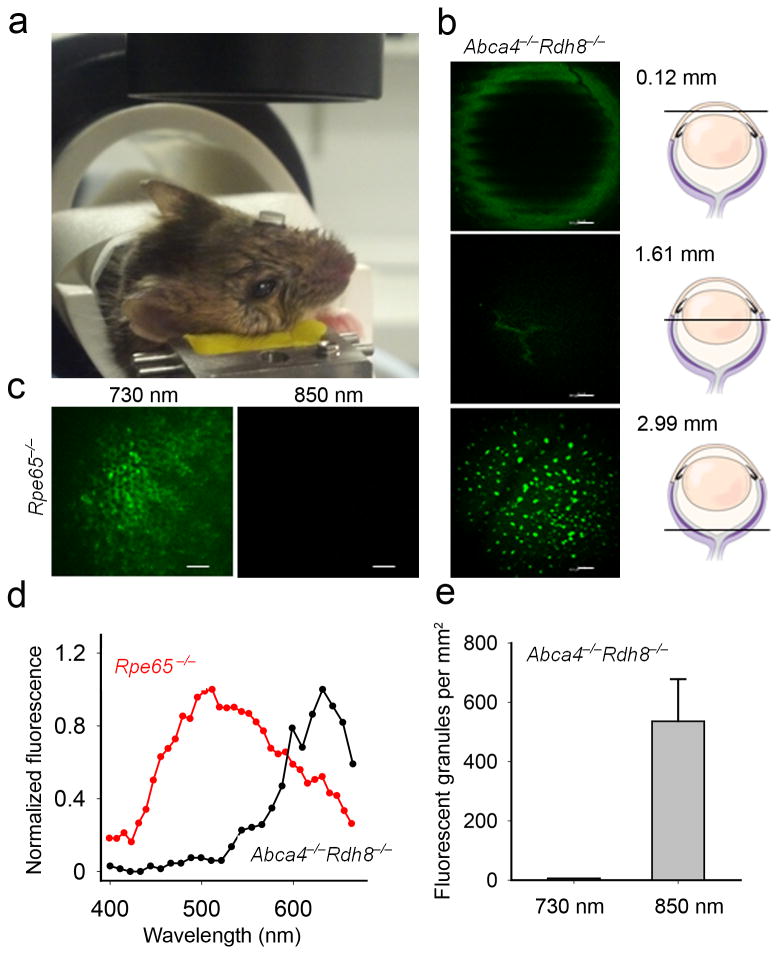
Figure 4
Set-up for two-photon RPE imaging in living mice. ( a ) During imaging a contact lens covers mouse eye facing the objective. ( b ) Representative images of a pigmented 7-week-old Abca4 u2212/u2212 Rdh...
Figure images are served from the NIH/NLM PubMed Central Open Access Subset or Europe PMC; copyright remains with the publishers and authors.
💬 Discussion
0 commentsNo comments yet. Be the first to start a discussion!
Leave a Comment