Abstract
At the onset of collective cell migration, a subset of cells within an initially homogenous population acquires a distinct 'leader' phenotype with characteristic morphology and motility. However, the factors driving the leader cell formation as well as the mechanisms regulating leader cell density during the migration process remain to be determined. Here we use single-cell gene expression analysis and computational modelling to show that the leader cell identity is dynamically regulated by Dll4 signalling through both Notch1 and cellular stress in a migrating epithelium. Time-lapse microscopy reveals that Dll4 is induced in leader cells after the creation of the cell-free region and leader cells are regulated via Notch1-Dll4 lateral inhibition. Furthermore, mechanical stress inhibits Dll4 expression and leader cell formation in the monolayer. Collectively, our findings suggest that a reduction of mechanical force near the boundary promotes Notch1-Dll4 signalling to dynamically regulate the density of leader cells during collective cell migration.
🔬 Techniques
💻 Software
✨ Fluorophores
🧪 Sample Preparation
🔬 Cell Lines
🏭 Microscope Brands
🧪 Reagent Suppliers
📷 Detectors
💻 Software Details
💾 Data Repositories
🏛️ Research Organizations (ROR)
Affiliated research institutions:
📋 Methods
Cell culture and reagents
Double-stranded locked nucleic acid (dsLNA) probes and synthetic targets for calibration were synthesized by Integrated DNA Technologies (San Diego, CA). The probe sequences are available in Supplementary Table 1 . All siRNA were purchased from Qiagen (Valencia, CA). The siRNA sequences are available in Supplementary Table 2 . Nocodazole, blebbistatin, and calyculin A were purchased from Sigma (St Louis, MO) and Y27632 was obtained from Calbiochem (San Diego, CA). DAPT and Jagged-1 peptide were purchased from Sigma (Saint Lious, MO) and AnaSpec (San Jose, CA) respectively. All pharmacological agents were dissolved in dimethyl sulfoxide (DMSO, Sigma). Other chemicals and reagents were purchased from Sigma (Saint Louis, MO), unless otherwise specified.
Human mammary epithelial cells
(MCF-7) were obtained from ATCC (Manassas, VA). Cells were maintained in Dulbecco's Modified Eagle's Medium (DMEM) (Invitrogen, Carlsbad, CA) supplemented with 10% fetal bovine serum, 2 mM HEPES buffer, and 0.1% gentamycin. Cells were plated either in 24-well tissue culture plates or on glass coverslips placed in 6-well plates, and they were incubated at 37°C with 95% humidity and 5% CO 2 . For wound healing experiments, cells were seeded at an initial concentration of 10 5 cell/ml for 2 days to form a confluent monolayer before wounding. To study the effects of Notch signaling, cell monolayers were treated with 20 μM DAPT or 20 μM Jagged-1 for 12 hours prior to scratching. To evaluate the effects of mechanical force on leader cell formation, cells were incubated with 5 nM calyculin A or 10 μM nocodazole to increase cell traction force; 40 μM blebbistatin or 20 μM Y27632 were alternatively utilized to reduce cell traction force. For siRNA experiments, cells were transfected with siRNA from Qiagen (Valencia, CA, USA) using HiPerFect transfection reagent (Qiagen) following the manufacturer's instructions. A concentration of 20 pM siRNA was applied 48 hours before performing the scratch assay.
Show full methods section
Cell culture and reagents
Double-stranded locked nucleic acid (dsLNA) probes and synthetic targets for calibration were synthesized by Integrated DNA Technologies (San Diego, CA). The probe sequences are available in Supplementary Table 1 . All siRNA were purchased from Qiagen (Valencia, CA). The siRNA sequences are available in Supplementary Table 2 . Nocodazole, blebbistatin, and calyculin A were purchased from Sigma (St Louis, MO) and Y27632 was obtained from Calbiochem (San Diego, CA). DAPT and Jagged-1 peptide were purchased from Sigma (Saint Lious, MO) and AnaSpec (San Jose, CA) respectively. All pharmacological agents were dissolved in dimethyl sulfoxide (DMSO, Sigma). Other chemicals and reagents were purchased from Sigma (Saint Louis, MO), unless otherwise specified.
Human mammary epithelial cells
(MCF-7) were obtained from ATCC (Manassas, VA). Cells were maintained in Dulbecco's Modified Eagle's Medium (DMEM) (Invitrogen, Carlsbad, CA) supplemented with 10% fetal bovine serum, 2 mM HEPES buffer, and 0.1% gentamycin. Cells were plated either in 24-well tissue culture plates or on glass coverslips placed in 6-well plates, and they were incubated at 37°C with 95% humidity and 5% CO 2 . For wound healing experiments, cells were seeded at an initial concentration of 10 5 cell/ml for 2 days to form a confluent monolayer before wounding. To study the effects of Notch signaling, cell monolayers were treated with 20 μM DAPT or 20 μM Jagged-1 for 12 hours prior to scratching. To evaluate the effects of mechanical force on leader cell formation, cells were incubated with 5 nM calyculin A or 10 μM nocodazole to increase cell traction force; 40 μM blebbistatin or 20 μM Y27632 were alternatively utilized to reduce cell traction force. For siRNA experiments, cells were transfected with siRNA from Qiagen (Valencia, CA, USA) using HiPerFect transfection reagent (Qiagen) following the manufacturer's instructions. A concentration of 20 pM siRNA was applied 48 hours before performing the scratch assay.
Animals and treatments Adult male
SKH-I mice were fed on laboratory food and tap water ad libitum in a regular 12-h dark/light cycle. The University of Arizona Institutional Animal Care and Use Committee approved all animal work and protocols. Before the wound surgery, the mice were anesthetized with 1-5% isoflurane. The mice back and neck were cleaned with alcohol swabs and betadine. The mice received subcutaneous pre-surgical analgesia (buprenophine 0.05 mg/kg) and two 6 mm diameter wounds were made on the back of the neck and the dorsal midline, respectively, by using a sterile 6 mm skin biopsy puncher (Health link, Jacksonville, FL). After the surgery, 3M Tegaderm pads were used to cover the biopsy site. 7 days later, the mice were anesthetized through intraperitoneal injection of 240 mg/kg avertin. The wound area skin tissues (8 mm diameter) were collected, and the skin tissues were cut into 2 halves in the middle for later use.
Mouse skin tissue immunohistochemical analysis
The mice skin tissues were embedded in paraffin and cut into 4 μm sections for HE and IHC staining. The deparaffinized sections were boiled in sodium citrate buffer (10mM, PH 6.0) for antigen retrieval of IHC, and the primary antibodies (Dll4 and Notch 1) were used in a dilution of 1:200 for 4°C overnight. Finally, the envision system HRP-DAB kit (DAKO North America. CA) was used according to the product instruction.
Single-cell gene expression analysis in living cells
The dsLNA probes were used to monitor the dynamic expression of target mRNAs near the boundary. The design, characterization and assay protocol of the dsLNA probes were described previously 17 , 27 , 28 . A donor probe, which consists of a nucleic acid sequence complementary to the target mRNA, is labeled with a fluorophore (6-FAM) at the 5’ end. A complementary sequence is also designed with a quencher (Iowa Black RQ™) placed on the 3’ end. Without a target mRNA, the fluorophore and quencher probes remain in close proximity, diminishing the fluorescence signal. With the presence of a target mRNA, the quencher probe is displaced by the target thermodynamically, allowing the donor probe to fluoresce. In the present study, dsLNA probes consist of alternating LNA/DNA monomers, which improve the intracellular stability and the specificity of the probes 41 . The dsLNA probes were designed based on target mRNA sequences, including β-actin, HO-1, Notch1 and Dll4 ( Supplementary Table 1 ). A random probe, lacking a complementary mRNA, was designed as the negative control. The mRNA sequences were obtained from NCBI GenBank and the dsLNA probe sequences were designed using Mfold and NCBI Basic Local Alignment Search Tool (BLAST). The dsLNA probes were prepared by mixing donor and quencher probe sequences at a 1-to-2 ratio immediately before transfection. Upon reaching 90% confluency in 24-well plates, cells were transfected with 0.8 μg dsLNA probe using Lipofectamine 2000 in opti-MEM from Invitrogen (Grand Island, NY) to determine the target gene expression. Gene expression was evaluated by measuring the fluorescence intensity of cells transfected with dsLNA probes.
Cell migration assays and time-lapse microscopy
To perform the cell migration assay, cell monolayers with or without drug treatment were incubated in 24-well tissue culture plates in serum-free media for 45 minutes. In the experiment, a 1-mm wide model wound was created by scratching the cell monolayer with a sterilized 1000 μL pipette tip. In the leader cell formation experiment, cells were refreshed with DMEM containing serum. Time-lapse microscopy with bright-field and fluorescence imaging was performed using a microscope stage-top incubator from Okolab (NA, Italy). For migration assays involving drug treatments, cells were maintained with the same concentration of drugs throughout the experiment, and the migration of the epithelia was monitored after performing the scratch assay. Single-cell photothermal ablation To disrupt the leader cells formed at the monolayer's leading edge, single-cell photothermal ablation was performed using a 1064 nm fiber laser coupled with gold nanorods (GNRs) taken up by the cells. The photothermal ablation experiment has been previously optimized for both single-cell ablation and minimizing injury to the neighboring cells 26 . This was confirmed by monitoring the cell viability, gene expression, and cell apoptosis of individual cells 26 . Before the experiment, cells were plated on glass bottom 24-well plates after incubation with 2×10 11 GNR/ml for 12 hours. The scratch assay was performed on the cell monolayer and leader cell formation was monitored with the dsLNA probe specific for Dll4 mRNA. Leader cells were identified and irradiated with a 150 mW laser using a 40X objective, which focused the laser spot to 15 μm (0.85 mW/μm 2 power density). The laser module was attached to the microscope (Nikon, TE2000-U) through an epi-fluorescence port. The plasmonic GNRs absorbed the power of the near-infrared laser and induced localized heating to ablate the cells. Leader cells were ablated in a few seconds. A short irradiation time localized the photothermal effect to the target cells 26 , 42 .
Immunofluorescence staining
For immunostaining, cells cultured on glass coverslips were fixed with 4% paraformaldehyde in 1X phosphate-buffered saline (PBS) for 10 minutes. The cells were then washed three times with PBS for 5 minutes, and permeabilized with 0.1% Triton X-100 for 8 minutes. The cells were blocked with either 5% goat serum or 1% bovine serum albumin (BSA) for 30 minutes. Rhodamine Phalloidin (Invitrogen Molecular Probes, Eugene, 1:400 dilution) was incubated with cells for 25 minutes for visualizing the actin cytoskeleton. Primary antibodies against vinculin (Sigma, St. Louis, MO, 1:400 dilution), Notch1 and Dll4 (Santa Cruz Biotechnology, Santa Cruz, CA, 1:50 dilution) were incubated at room temperature for 1 hour. The binding of primary antibodies was visualized via Alexa Fluor 488- or Alexa Fluor 555-conjugated secondary IgG antibodies with 1 hour incubation at room temperature. Nuclei were then stained with 4’,6-diamidino-2-phenylindole (DAPI) antifade reagent from Invitrogen (Carlsbad, CA).
Western blot analysis
For immunoblotting, cells were treated with 20 nM of control siRNA, Notch1 siRNA, and Dll4 siRNA for 48 hours. The protein samples were collected using the RIPA lysis buffer (50 mM Tris-Cl (pH 7.4), 150 mM NaCl, 1 mM EDTA, 1% NP-40, 0.25% Na-deoxycholate, 1 mM PMSF, 10 μg/ml aprotinin, 10 μg/ml leupeptin, 1 mM Na 3 VO 4 , and 1 mM NaF) 43 . The samples were quantified using the BCA protein assay kit (Santa Cruz Biotechnology, CA). Proteins (20 μg per well) were subjected to SDS–PAGE (10%, Bio-Rad) and transferred to a PVDF membrane (Santa Cruz Biotechnology, CA). Immunoprobing was performed using a rabbit monoclonal GAPDH antibody (1:1000), a rabbit monoclonal Notch1 antibody (1:800), and a rabbit polyclonal Dll4 antibody (1:400), followed by binding with horseradish peroxidase-conjugated anti-rabbit antibody (1:1000). Autoradiography films and western blotting luminol reagent (Santa Cruz Biotechnology, CA) were used for the detection. Traction force microscopy Glass-bottomed Petri dishes (MatTek) were activated with 0.1 M NaOH overnight and silanized with 3-aminopropyl-trimethoxysilane (Sigma) for 10 minutes. The dishes were then thoroughly washed with deionized water and allowed to dry. For image registration, 300 μl of yellow fluorescent carboxylate-modified particles (2 μm diameter, 1:2000 diluted, Invitrogen) was added to each activated glass surface and air-dried overnight. After treatment with 0.5% glutaraldehyde (Sigma) in PBS for 30 minutes and several washes with deionized water, the glass substrate was ready for gel attachment. Gel prepolymer was prepared by combining 1/4 volume of 40% acrylamide, 1/67 volume of 2% BIS (Bio-Rad) and 1/100 volume of 2% red fluorescent carboxylate-modified beads (0.5 μm diameter, Invitrogen). 1/200 volume of 10% ammonium persulfate and 1/2000 volume of TEMED (Bio-Rad) were added to the prepolymer to initiate the polymerization. The mixture (25 μl) was pipetted immediately onto the activated glass substrate followed by placing a round coverslip (No. 1, 12 mm diameter; Fisher) onto the gel droplet. The dish was then turned upside down to allow the 0.5 μm fluorescent tracer particles to stay near the top of the gel during gelation. After 30 minutes, the coverslip was removed and the gel was washed with 50 mM HEPES buffer (pH 8.5). The gel surface was treated with 1 mM sulphosuccinimidyl-6-(4-azido-2-nitrophenylamino) hexanoate (Sulfo-SANPAH; Pierce) in HEPES buffer, exposed under ultraviolet light for 10 minutes, washed twice with HEPES solution, washed once with PBS, and coated with collagen I (0.2 mg/mL, Invitrogen) in PBS at 4°C overnight. Before cell seeding, the polyacrylamide gel dish was washed with PBS, sterilized by ultraviolet light for 10 minutes, and immersed in DMEM solution without FBS for 1 hour. For wounding the monolayer, a thin PDMS blocker was placed on the gel surface and MCF-7 cells were seeded on the exposed area. After 24 hours of culture, the PDMS blocker was removed to create a cell-free region and initiate collective cell migration. Fluorescence imaging of registration particles and tracer particles near the leading edge was conducted before and after the application of 0.25% trypsin. The traction force distribution was estimated using a traction force microscopy algorithm in ImageJ 44 .
Imaging and data analysis
Cellular behavior was monitored using a TE2000-U inverted fluorescence microscope from Nikon (Tokyo, Japan). Time-lapse phase contrast and fluorescence images were captured using a Photometric CCD camera (Tucson, AZ). All fluorescence images were taken with the same exposure time in order to compare the relative fluorescence intensity. Time-lapse videos were obtained via images taken at 5 minute intervals. Imaging analysis was performed using ImageJ.
Statistical analysis
Data are presented as mean ± standard error of the mean (SEM). Experiments were performed in triplicate and repeated at least three times independently. Student's t-tests were performed to compare experimental groups. For comparing multiple groups, a one-way ANOVA and Tukey's post-hoc test were used. Statistically significant p-values were assigned as follows: * P < 0.05, ** P < 0.01 or *** P < 0.001. To determine the spatial distribution of leader cells, histograms of cell intensity were determined for each row of cells parallel to the leading edge. Each row was 25 μm in width and over 200 cells were measured.
Supplementary Material 1
📊 Figures
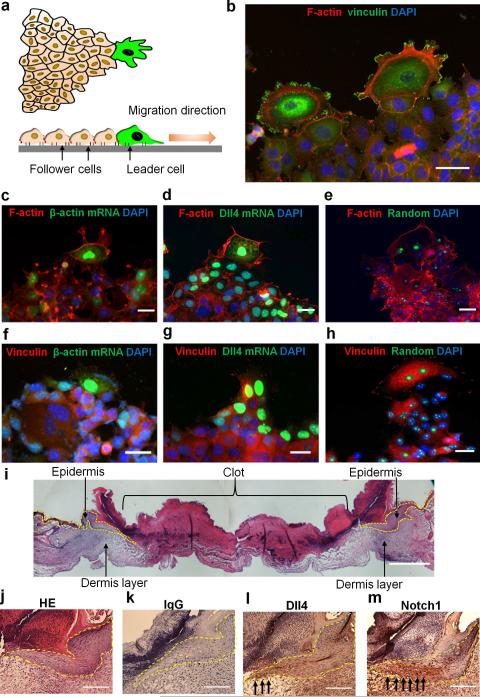
Figure 1
Characteristics of leader cells in collective cell migration
( a ) Schematic representation of a migration tip with leader-follower organization during collective cell migration. Leader cells (green) at the front of the leading edge typically display enlarged c...
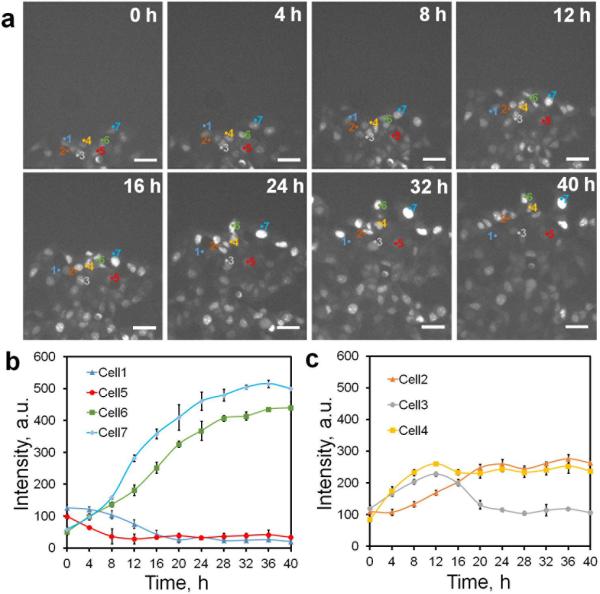
Figure 2
Dynamics of Dll4 expression and leader cell formation during collective migration
( a ) Time-lapse fluorescence images characterizing Dll4 mRNA expression. Cells were transfected with dsLNA probes targeting Dll4 mRNA. The model wound was created by scratching the monolayer with a s...
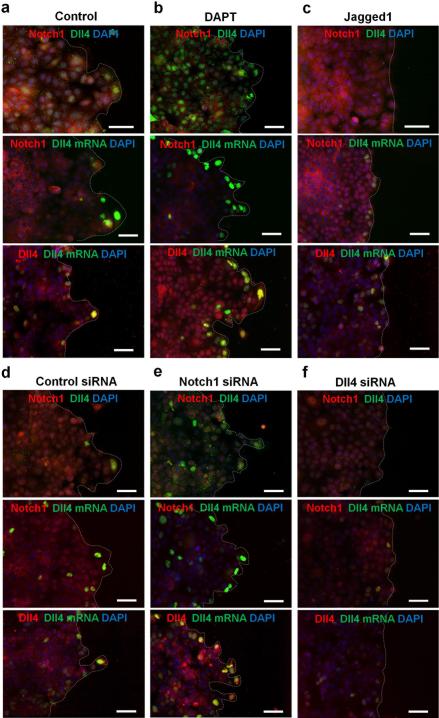
Figure 3
Notch1-Dll4 signaling regulates leader cell formation in collective cell migration
( a-c ) Double immunofluorescence staining of Notch1 and Dll4 in model wounds (top). For Dll4 mRNA detection, cells were first transfected with the dsLNA probes before fixation for Notch1 and Dll4 imm...
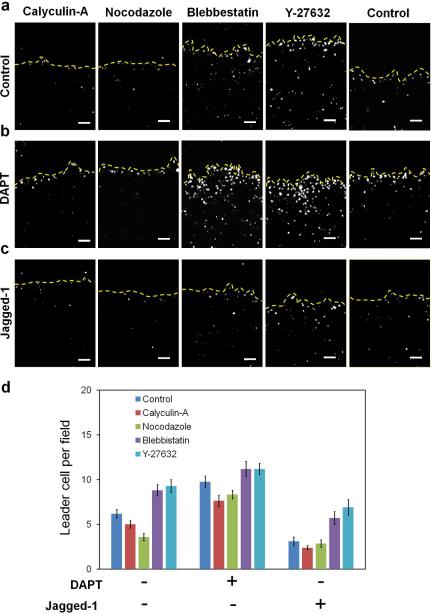
Figure 4
Mechanical force and Notch signaling regulates the formation of leader cells
( a ) Effects of traction force-modulating reagents on Dll4 mRNA expression near the leading edge. Cells were transfected with dsLNA to detect the distribution of Dll4. ( b-c ) Effects of co-treatment...
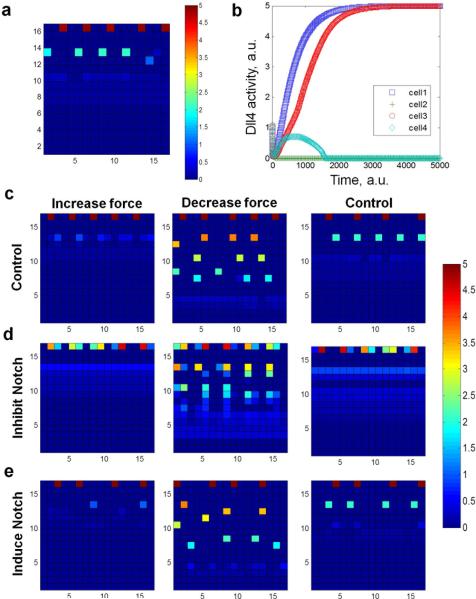
Figure 5
Computational modeling of leader cell formation regulated by mechanical force and Notch1-Dll4 lateral inhibition
( a ) Representative distribution of Dll4 expressing tip cells from the computational model. ( b ) Tracking of Dll4 levels in representative cells at the leading edge. Time is in arbitrary units in th...
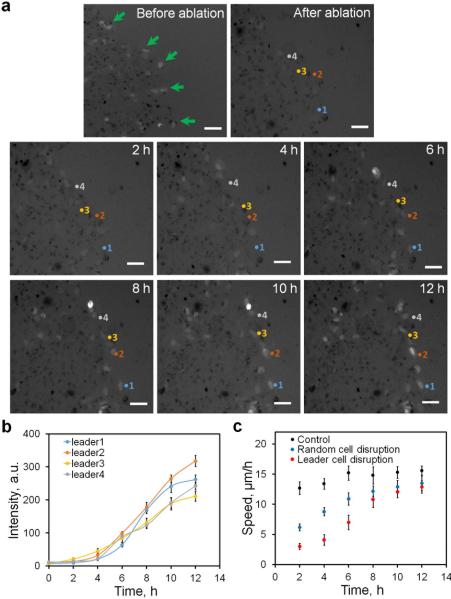
Figure 6
Photothermal ablation of leader cells
( a ) Photothermal ablation to disrupt leader cells at the leading edge. Leader cells (green arrows) were first identified using dsLNA targeting Dll4 mRNA and ablated using a using 1064 nm fibre laser...
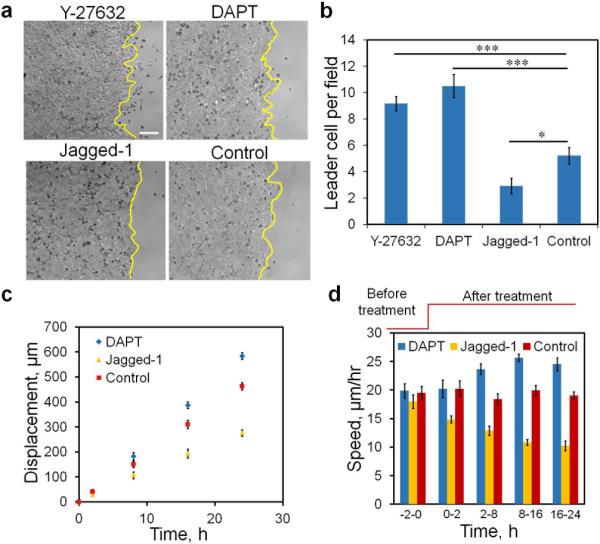
Figure 7
Migration speed correlates with leader cell density
( a-b ) Bright-field images illustrating the leading edges with Y-27632, DAPT, Jagged-1, and control. Yellow lines indicate the leading edges. Data are expressed as mean u00b1 s.e.m. (n=3, * P < 0....
Figure images are served from the NIH/NLM PubMed Central Open Access Subset or Europe PMC; copyright remains with the publishers and authors.
💬 Discussion
0 commentsNo comments yet. Be the first to start a discussion!
Leave a Comment