Abstract
The process of autophagy involves the formation of autophagosomes, double-membrane structures that encapsulate cytosol. Microtubule-associated protein light chain 3 (LC3) was the first protein shown to specifically label autophagosomal membranes in mammalian cells, and subsequently EGFP-LC3 has become one of the most widely utilized reporters of autophagy. Although LC3 is currently thought to function primarily in the cytosol, the site of autophagosome formation, EGFP-LC3 often appears to be enriched in the nucleoplasm relative to the cytoplasm in published fluorescence images. However, the nuclear pool of EGFP-LC3 has not been specifically studied in previous reports, and mechanisms by which LC3 shuttles between the cytoplasm and nucleoplasm are currently unknown. In this study, we therefore investigated the regulation of the nucleo-cytoplasmic distribution of EGFP-LC3 in living cells. By quantitative fluorescence microscopy analysis, we demonstrate that soluble EGFP-LC3 is indeed enriched in the nucleus relative to the cytoplasm in two commonly studied cell lines, COS-7 and HeLa. Although LC3 contains a putative nuclear export signal (NES), inhibition of active nuclear export or mutation of the NES had no effect on the nucleo-cytoplasmic distribution of EGFP-LC3. Furthermore, FRAP analysis indicates that EGFP-LC3 undergoes limited passive nucleo-cytoplasmic transport under steady state conditions, and that the diffusional mobility of EGFP-LC3 was substantially slower in the nucleus and cytoplasm than predicted for a freely diffusing monomer. Induction of autophagy led to a visible decrease in levels of soluble EGFP-LC3 relative to autophagosome-bound protein, but had only modest effects on the nucleo-cytoplasmic ratio or diffusional mobility of the remaining soluble pools of EGFP-LC3. We conclude that the enrichment of soluble EGFP-LC3 in the nucleus is maintained independently of active nuclear export or induction of autophagy. Instead, incorporation of soluble EGFP-LC3 into large macromolecular complexes within both the cytoplasm and nucleus may prevent its rapid equilibrium between the two compartments.
🔬 Techniques
🔭 Microscopes
✨ Fluorophores
🧪 Sample Preparation
🔬 Cell Lines
🏭 Microscope Brands
🧪 Reagent Suppliers
🔎 Objectives
🏛️ Research Organizations (ROR)
Affiliated research institutions:
📋 Methods
Constructs
The plasmids encoding EGFP-LC3, tfLC3, EGFP-LC3 G120A , and mStrawberry-Atg4B C74A were the kind gift of Dr. Tamotsu Yoshimori, Osaka University [3] , [14] , [25] . The plasmid for EGFP was from Clontech. p53-EGFP was as previously described [42] . The Rev(68–90)GFP 2 -cNLS construct was the kind gift of Dr. Ralph Kehlenbach, Universität Göttingen [29] . Rev(68-90)GFP 2 -cNLS consists of the classic importin α/β-dependent NLS from SV40, two copies of EGFP, and the CRM1-dependent NES (residues 68–90) of HIV-1-Rev protein. An NES mutant of LC3 (L63A L71A L73A), designated here as EGFP-LC3 mNES, was generated using a Quik Change site-directed mutagenesis kit (Stratagene, Inc.). Primers used to mutate amino acid 63 from a Leucine to an Alanine were 5′ C GTG AAT ATG AGC GAA GCC ATC AAG ATA ATT AGA AGG CGC 3′ (forward) and 5′GCG CCT TCT AAT TAT CTT GAT GGC TTC GCT CAT ATT CAC G 3′ (reverse). This mutant was subject to further mutagenesis of amino acids 71 and 73 from Leucine to Alanine using the following primers; 5′ G ATA ATT AGA AGG CGC GCG CAG GCC AAT GCT AAC CAA GCC TTC 3′ (forward) and 5′ GAA GGC TTG GTT AGC ATT GGC CTG CGC GCG CCT TCT AAT TAT C 3′ . All constructs were verified by sequencing using the CMV forward sequencing primer 5′CGC AAA TGG GCG GTA GGC GTG T 3′ by the Vanderbilt Sequencing Core. Cells and transfections COS-7 cells were obtained from ATCC and maintained in DMEM supplemented with 10% fetal calf serum at 37°C and 5% CO 2 . For all experiments, cells were plated on coverslips two days prior to the experiment. Where indicated, the day prior to an experiment, cells were transfected using FuGene6 (Roche Diagnostics, Indianapolis) as recommended by the manufacturer. A HeLa cell line stably expressing EGFP-LC3 [18] was generously provided by Dr. Aviva M Tolkovsky, Cambridge Centre for Brain Repair. HeLa cells were maintained in RPMI supplemented with 10% fetal calf serum at 37°C and 5% CO 2 and were plated on coverslips one to two days prior to experiments.
Show full methods section
Constructs
The plasmids encoding EGFP-LC3, tfLC3, EGFP-LC3 G120A , and mStrawberry-Atg4B C74A were the kind gift of Dr. Tamotsu Yoshimori, Osaka University [3] , [14] , [25] . The plasmid for EGFP was from Clontech. p53-EGFP was as previously described [42] . The Rev(68–90)GFP 2 -cNLS construct was the kind gift of Dr. Ralph Kehlenbach, Universität Göttingen [29] . Rev(68-90)GFP 2 -cNLS consists of the classic importin α/β-dependent NLS from SV40, two copies of EGFP, and the CRM1-dependent NES (residues 68–90) of HIV-1-Rev protein. An NES mutant of LC3 (L63A L71A L73A), designated here as EGFP-LC3 mNES, was generated using a Quik Change site-directed mutagenesis kit (Stratagene, Inc.). Primers used to mutate amino acid 63 from a Leucine to an Alanine were 5′ C GTG AAT ATG AGC GAA GCC ATC AAG ATA ATT AGA AGG CGC 3′ (forward) and 5′GCG CCT TCT AAT TAT CTT GAT GGC TTC GCT CAT ATT CAC G 3′ (reverse). This mutant was subject to further mutagenesis of amino acids 71 and 73 from Leucine to Alanine using the following primers; 5′ G ATA ATT AGA AGG CGC GCG CAG GCC AAT GCT AAC CAA GCC TTC 3′ (forward) and 5′ GAA GGC TTG GTT AGC ATT GGC CTG CGC GCG CCT TCT AAT TAT C 3′ . All constructs were verified by sequencing using the CMV forward sequencing primer 5′CGC AAA TGG GCG GTA GGC GTG T 3′ by the Vanderbilt Sequencing Core. Cells and transfections COS-7 cells were obtained from ATCC and maintained in DMEM supplemented with 10% fetal calf serum at 37°C and 5% CO 2 . For all experiments, cells were plated on coverslips two days prior to the experiment. Where indicated, the day prior to an experiment, cells were transfected using FuGene6 (Roche Diagnostics, Indianapolis) as recommended by the manufacturer. A HeLa cell line stably expressing EGFP-LC3 [18] was generously provided by Dr. Aviva M Tolkovsky, Cambridge Centre for Brain Repair. HeLa cells were maintained in RPMI supplemented with 10% fetal calf serum at 37°C and 5% CO 2 and were plated on coverslips one to two days prior to experiments.
Analysis of NES and NLS signals Predicted
NLS signals were screened using ( http://cubic.bioc.columbia.edu/db/NLSdb/ ). An algorithm that predicts leucine-rich nuclear export signals was used to screen for predicted NES [26] . Drug treatments and induction of autophagy To inhibit active nuclear transport, cells were incubated in culture media containing 20 ng/ml leptomycin B (Sigma-Aldrich). To disrupt microtubules, cells were preincubated for 5 minutes on ice in phenol red-free DMEM containing 10% fetal calf serum and 50 mM HEPES. 5 µg/ml of nocodazole (NZ) (Sigma-Aldrich) was added and the cells were incubated for an additional 15 minutes on ice. They were then shifted to 37°C for 1 h in the continued presence of NZ, and either fixed or imaged live in the continued presence of NZ at 37°C [32] . Control experiments were performed using vehicle alone (DMSO). For starvation experiments, cells were washed 3 times with Earle's Balanced salt solution (EBSS) (Sigma-Aldrich). They were then incubated for the indicated times in EBSS at 37°C prior to imaging in the continued presence of EBSS. Rapamycin (Ready Made Solution, Sigma-Aldrich) was added to phenol red-free DMEM containing 10% fetal calf serum and 50 mM HEPES to a final concentration of 0.2 µM and cells were incubated at 37°C for 2, 4, or 6 h. As a control, cells were incubated with media containing an equivalent volume of vehicle (DMSO) for 6 h. Fixed cells were mounted using Fluoromount G supplemented with 25 mg/ml DABCO (1,4 diazabicyclo[2.2.2]octane) (Sigma-Aldrich) and allowed to solidify overnight prior to imaging.
Immunofluorescence staining
A rabbit antibody against recombinant human LC3B (residues 1–120) was from Medical & Biological Laboratories Co, Ltd, (Nagoya, Japan). Mouse anti-GFP was from Invitrogen Molecular Probes (Carlsbad, CA). Fluorescently labeled secondary antibodies were purchased from Jackson ImmunoResearch Laboratories Inc. (West Grove, PA). Cells were fixed in 3.7% PFA for 15 min at RT followed by permeabilization with either PBS containing 10% FCS and 0.1% saponin for 30 min or 0.1% ice-cold TX-100 in PBS for 5 min on ice. After blocking they were then incubated with primary antibodies (1∶200 dilution) for 30 min at RT. Cells were then washed, incubated with 1 µg/ml Cy3 anti-mouse or anti-rabbit secondary antibodies (Jackson ImmunoResearch Laboratories) for 30 min at RT, and washed again. Coverslips were then mounted on slides using Fluoromount G supplemented with 25 mg/ml DABCO (1,4 diazabicyclo[2.2.2]octane) (Sigma-Aldrich) and allowed to solidify overnight prior to imaging.
Confocal microscopy and photobleaching experiments
Fluorescence images were obtained using a Zeiss LSM 510 confocal (Carl Zeiss, Thornwood, NY). Images were collected using a 40X 1.3 NA Zeiss Plan-Neofluar objective or 100X 1.4 NA Zeiss Plan-Apochromat objective. The confocal pinhole was set at 1 Airy unit. Cells were maintained in phenol-red free DME containing 10% fetal calf serum and 50 mM Hepes or EBSS where indicated for live-cell imaging experiments. Cells were imaged live at 22°C for quantification of N/C ratios or 37°C for FRAP analysis using a stage heater and objective heater. EGFP fluorescence was excited using the 488 nm line of a 40 mW Argon laser, and mRFP and mStrawberry were excited at 543 nm of a HeNe laser and detected using filter sets provided by the manufacturer. For presentation purposes, images were exported as TIFF files and contrast was adjusted using Adobe Photoshop. For FRAP measurements of nuclear import and export, cells were imaged using a 40X 1.3 NA Zeiss Plan-Neofluar objective at 3X digital zoom with the confocal pinhole set to 1 Airy unit. Images were collected at 1% transmission with line averaging of 4. For measurements of nuclear import, an oval completely filling the nucleus was selected as the bleach region. For measurements of nuclear export, the bleach region contained the cytoplasmic region but excluded the nucleus. Photobleaching was accomplished by transiently increasing the laser power to 100% and repetitively scanning the bleach region either 10 (EGFP-LC3 and tfLC3) or 40 (EGFP) times. Images were collected every 5 s during the recovery phase for measurements of nuclear import and every 5 s (for EGFP) or 8 s (for EGFP-LC3, tfLC3) for measurements of nuclear export. FRAP measurements were performed at 37°C. For FRAP measurements of lateral diffusion, cells were imaged using a 40X 1.3 NA Zeiss Plan-Neofluar objective at 4X digital zoom with the confocal pinhole set to 1 Airy unit. For cells expressing EGFP, the location of the nucleus was identified by focusing to the top of the cell. Only the EGFP channel was imaged for cells expressing tfLC3. Images were collected for a square region 70×70 pixels (7.84 µm×7.84 µm). Photobleaching of a circular bleach region 25 pixels in diameter (2.75 µm) was performed by repetitively scanning the bleach region 20 times using 100% laser power. Images were collected every 0.14 s during the recovery phase for a total of 16.75 s. Under the conditions of these experiments, no overall photobleaching due to imaging was observed. For presentation purposes, recovery curves from 5–7 cells from an individual experiment were averaged. Quantification of N/C ratios from confocal images LSM images were exported as Tiff files and fluorescence intensities in the nuclear and cytoplasmic regions were quantified using Image J ( http://rsbweb.nih.gov/ij/ ). Background-corrected N/C ratios were calculated from mean fluorescence intensities measured within a small square or circular region of interest placed within the nucleus, cytoplasm, and outside of each cell. Measurements of EGFP-LC3 in the cytoplasm were made in regions of the cell devoid of punctate structures. Note that the absolute N/C values varied somewhat between experiments depending on exact imaging conditions and thus comparisons were only made for paired experiments. Where indicated, N/C data were normalized to control values for a given experiment to enable comparison across different days.
FRAP analysis
To analyze the FRAP data, we used a modified form of the Gaussian laser FRAP equation of Axelrod [60] that corrects for diffusion of molecules during the photobleach [46] . The theoretical basis for this approach is described elsewhere [61] . In brief, in this approach, we used an experimentally determined radius, r e , obtained immediately after the photobleach, to calculate diffusion coefficients. To measure r e , the LSM 510 software was used to calculate a pixel-wide line profile across the box containing the bleaching spot. We averaged the intensities from 4 profile measurements from each dataset. The intensity profiles were then fit to a postbleach profile by the Gaussian laser to obtain the half width at e −2 height of postbleach intensity distribution from (eq.1) Assuming r n ≤ r e , the following the calculation was performed as described in [60] (eq.2) where and , the lower incomplete gamma function. The bleaching parameter ( K ) was computed from initial fluorescence intensity, F (0), by solving (eq.3) Note that when r n = r e , then Eq. (1)∼(3) reduce to the conventional FRAP formula as described in [60] . In some instances FRAP curves were analyzed individually then the resulting D and Mf averaged, whereas for others data analysis was performed on averaged FRAP curves collected from 10 different cells on a single day rather than individual recovery curves to improve the signal to noise ratio [38] . Mobile fractions were calculated as described previously [32] .
📊 Figures
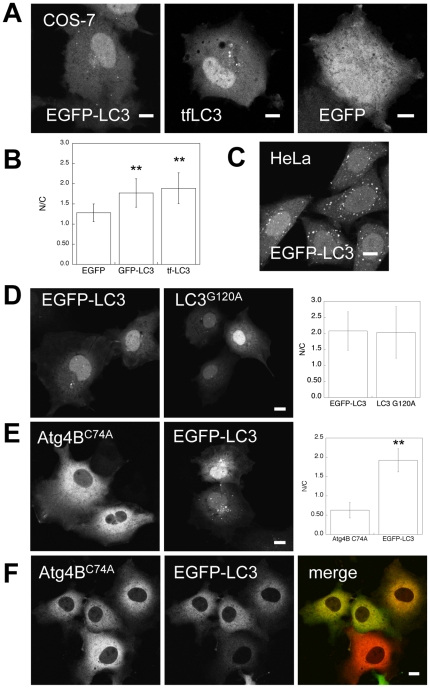
Figure 1
EGFP-LC3 and tfLC3 are selectively enriched in the nucleus under steady state conditions.
( A ) Localization of EGFP, EGFP-LC3, and tfLC3 under steady state conditions in transiently transfected COS-7 cells. ( B ) Quantification of N/C ratios for EGFP, EGFP-LC3, and tfLC3 under steady stat...
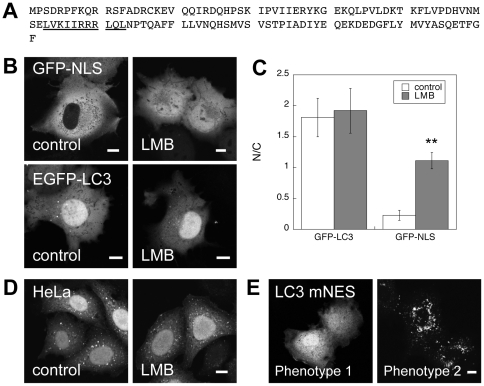
Figure 2
LC3 contains a putative NES, but remains enriched in the nucleus following blockade of nuclear export or mutation of the NES.
( A ) Sequence of human LC3. The predicted leucine-rich nuclear export signal is underlined. ( B ) Effect of LMB, a specific inhibitor of nuclear export, on the distribution of EGFP-LC3 or Rev(68u2013...
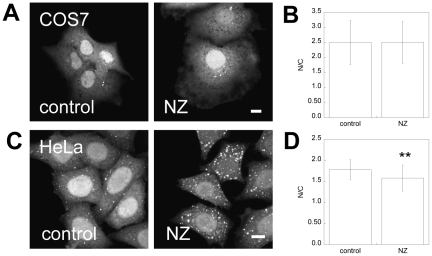
Figure 3
The nucleocytoplasmic distribution of EGFP-LC3 is modestly affected by microtubule disruption.
Cells were subjected to microtubule disruption with 5 u00b5g/ml NZ or mock-treated (u201ccontrolu201d) and fixed prior to imaging as described in the Materials and Methods . ( A ) Effect of NZ on the ...
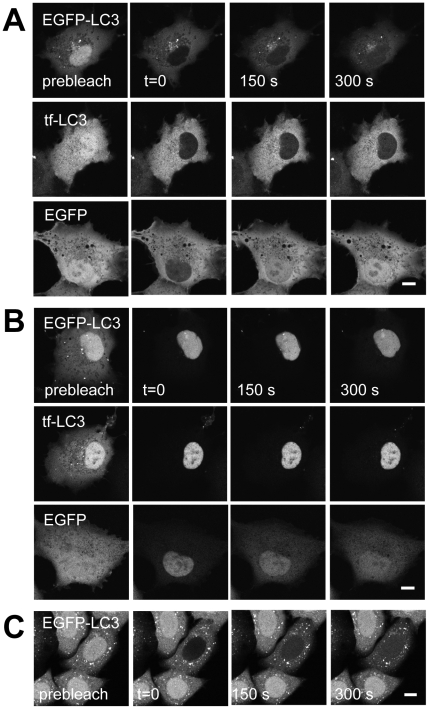
Figure 4
The kinetics of nuclear import and export of EGFP-LC3 and tfLC3 are significantly slower that that of EGFP as assessed by photobleaching.
Photobleaching experiments of the entire nucleus or entire cytoplasm were performed at 37u00b0C. ( A ) Images from a representative nuclear photobleaching experiment measuring the kinetics of nuclear ...
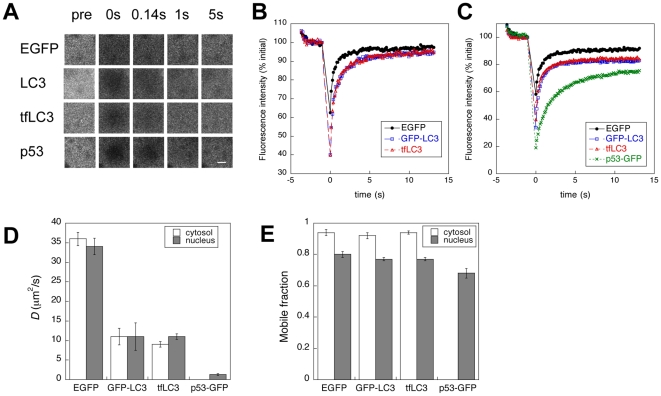
Figure 5
EGFP-LC3 and tfLC3 diffuse more slowly than predicted by their molecular weights.
COS-7 cells were transfected with the indicated constructs. The following day, confocal FRAP experiments were performed at 37u00b0C as described in the Materials and Methods . ( A ) Representative ima...
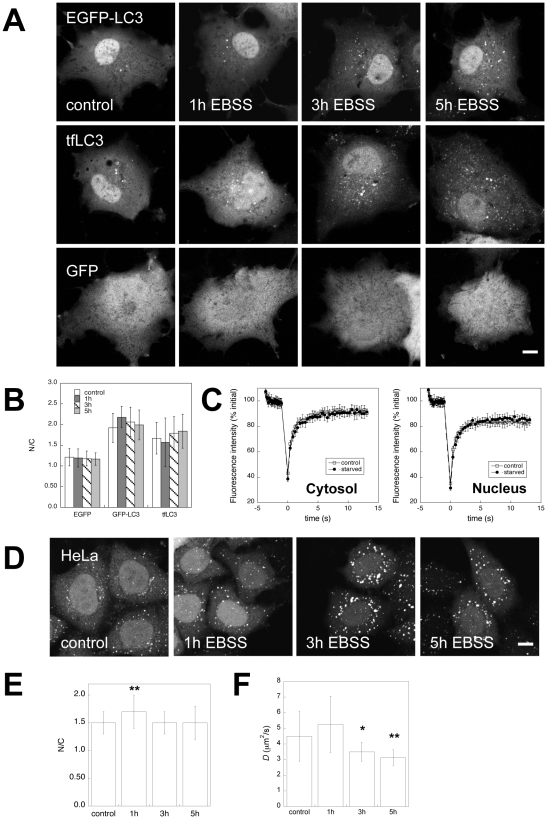
Figure 6
Effect of amino acid starvation on the nuclear/cytoplasmic ratio and diffusional mobility of EGFP-LC3.
( A ) Effect of amino acid starvation on the subcellular localization of EGFP-LC3, tfLC3, and EGFP in live COS-7 cells. Bar, 10 u00b5m. ( B ) Quantification of the mean intensity of EGFP, EGFP-LC3, an...
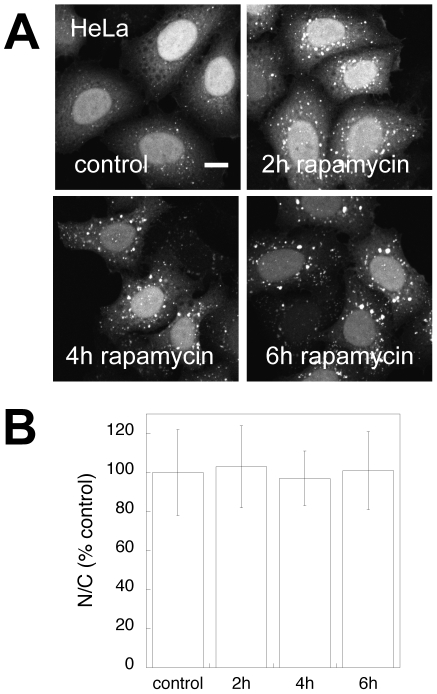
Figure 7
Effect of rapamycin on the nucleo-cytoplasmic distribution of EGFP-LC3.
( A ) Effect of rapamycin treatment or incubation with vehicle (control) on the distribution of EGFP-LC3 in fixed HeLa cells. Bar, 10 u00b5m. ( B ) Quantification of the N/C ratio of EGFP-LC3 followin...
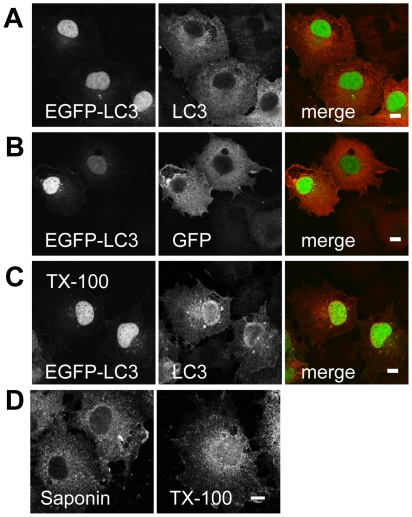
Figure 8
Detection of exogenous and endogenous LC3 in the nucleoplasm by immunostaining.
( A ) COS-7 cells expressing EGFP-LC3 were fixed in 3.7% PFA, permeabilized with 0.1% saponin, and processed for immunostaining for LC3 as described in the Materials and Methods . In the merged images...
Figure images are served from the NIH/NLM PubMed Central Open Access Subset or Europe PMC; copyright remains with the publishers and authors.
💬 Discussion
0 commentsNo comments yet. Be the first to start a discussion!
Leave a Comment