Abstract
The evolution of animal behaviour is poorly understood1,2. Despite numerous correlations between interspecific divergence in behaviour and nervous system structure and function, demonstrations of the genetic basis of these behavioural differences remain rare3-5. Here we develop a neurogenetic model, Drosophila sechellia, a species that displays marked differences in behaviour compared to its close cousin Drosophila melanogaster6,7, which are linked to its extreme specialization on noni fruit (Morinda citrifolia)8-16. Using calcium imaging, we identify olfactory pathways in D. sechellia that detect volatiles emitted by the noni host. Our mutational analysis indicates roles for different olfactory receptors in long- and short-range attraction to noni, and our cross-species allele-transfer experiments demonstrate that the tuning of one of these receptors is important for species-specific host-seeking. We identify the molecular determinants of this functional change, and characterize their evolutionary origin and behavioural importance. We perform circuit tracing in the D. sechellia brain, and find that receptor adaptations are accompanied by increased sensory pooling onto interneurons as well as species-specific central projection patterns. This work reveals an accumulation of molecular, physiological and anatomical traits that are linked to behavioural divergence between species, and defines a model for investigating speciation and the evolution of the nervous system.
🔬 Techniques
🔭 Microscopes
🧬 Organisms
💻 Software
✨ Fluorophores
🧪 Sample Preparation
🔬 Cell Lines
🏭 Microscope Brands
🧪 Reagent Suppliers
🔴 Lasers
📷 Detectors
🔎 Objectives
💻 Software Details
💻 Code & Software
💾 Data Repositories
🏷️ Research Resource Identifiers (RRIDs)
Verified research resources used in this paper:
🏛️ Research Organizations (ROR)
Affiliated research institutions:
📋 Methods
Data reporting Preliminary experiments were used to assess variance and determine adequate sample sizes in advance of acquisition of the reported data. Several experiments were carried out repeatedly because they served as controls for different genetic manipulations. In particular, we ran wild-type controls in parallel with mutant analyses in behavioural assays and therefore replicated them multiple times. In the wind tunnel assay the number of possible samples per day is rather low, leading to testing of flies of different genotypes on different days. In these cases experiments were started at the same time of the day under the stringently controlled conditions of temperature, humidity, light, and age of flies. For electrophysiological recordings, data were collected from multiple flies on multiple days in randomised order interleaving wild-type and mutant genotypes. Within datasets the same odour dilutions were used for acquisition of the dataset. In all cases the results were reliable and robust over the course of the many years it took to complete this study. For olfactory trap assays, the experiments were conducted with the experimenter blinded to the genotype. The experimenter was not blinded to the genotype of flies in the wind tunnel assay or physiological experiments. All replicates are biological replicates. Volatile collection, gas chromatography and mass spectrometry Volatiles were collected from 1 ml of fruit juice or 13 g of noni fruit at different ripening stages in capped 15 ml glass vials with poly-tetra-fluoroethylene-lined silicone septa (Sigma, 23242-U). After penetrating the septum of the cap with a Solid Phase Microextraction (SPME) fibre holder, the SPME fibre (grey hub plain, coated with 50/30 μm divinylbenzene/carboxen on polydimethylsiloxane on a StableFlex fibre (Sigma, 57328-U)) was exposed to the headspace of each vial for 30 min at room temperature. For collection of headspaces in the trap assay, a single noni juice trap was placed in the arena and odours were collected with SMPE for 5 min at 0 h, 5 h and 10 h after placement. For collection of headspaces in the wind tunnel assay, samples were captured with SPME for 10 min at the landing platform and the release platform directly after noni juice application. After each odour collection, the SPME fibre was retracted and immediately inserted into the inset of a Gas Chromatography-mass spectrometry (GC-MS) system (Agilent 7890B fitted with MS 5977A unit) for desorption at 260ºC in split mode (split ratio 100:1). The GC was operated with a HP-INNOWax column (Agilent 19091N-133UI). Samples were injected at an initial oven temperature of 50°C; this temperature was held for 1 min and gradually increased (3°C min -1 ) to 150°C before holding for 1 min. Subsequently, the temperature was increased (20°C min -1 ) to 260°C and held for 5 min. The MS-transfer-line was held at 260°C, the MS source at 230°C, and the MS quad at 150°C. MS spectra were taken in EI-mode (70 eV) in a 29-350 m/z range. Between different collections, the SPME fibre was conditioned at 270°C for 15 min. All chromatograms were processed using MSD ChemStation F.01.03.2357 software. Volatile compounds were identified using the NIST library and matched to standards of the Max-Planck-Institute for Chemical Ecology library. For quantification, peak areas were measured for 3 replicates for each sample. Note that SPME allows only for a qualitative analysis of odour compositions as well as for an estimate of changing ratios of odours across different samples. Vapour pressure values for hexanoic acid, methyl hexanoate and 2 -heptanone were described previously ( www.thegoodscentscompany.com ) 42 , 43 .
Show full methods section
Data reporting Preliminary experiments were used to assess variance and determine adequate sample sizes in advance of acquisition of the reported data. Several experiments were carried out repeatedly because they served as controls for different genetic manipulations. In particular, we ran wild-type controls in parallel with mutant analyses in behavioural assays and therefore replicated them multiple times. In the wind tunnel assay the number of possible samples per day is rather low, leading to testing of flies of different genotypes on different days. In these cases experiments were started at the same time of the day under the stringently controlled conditions of temperature, humidity, light, and age of flies. For electrophysiological recordings, data were collected from multiple flies on multiple days in randomised order interleaving wild-type and mutant genotypes. Within datasets the same odour dilutions were used for acquisition of the dataset. In all cases the results were reliable and robust over the course of the many years it took to complete this study. For olfactory trap assays, the experiments were conducted with the experimenter blinded to the genotype. The experimenter was not blinded to the genotype of flies in the wind tunnel assay or physiological experiments. All replicates are biological replicates. Volatile collection, gas chromatography and mass spectrometry Volatiles were collected from 1 ml of fruit juice or 13 g of noni fruit at different ripening stages in capped 15 ml glass vials with poly-tetra-fluoroethylene-lined silicone septa (Sigma, 23242-U). After penetrating the septum of the cap with a Solid Phase Microextraction (SPME) fibre holder, the SPME fibre (grey hub plain, coated with 50/30 μm divinylbenzene/carboxen on polydimethylsiloxane on a StableFlex fibre (Sigma, 57328-U)) was exposed to the headspace of each vial for 30 min at room temperature. For collection of headspaces in the trap assay, a single noni juice trap was placed in the arena and odours were collected with SMPE for 5 min at 0 h, 5 h and 10 h after placement. For collection of headspaces in the wind tunnel assay, samples were captured with SPME for 10 min at the landing platform and the release platform directly after noni juice application. After each odour collection, the SPME fibre was retracted and immediately inserted into the inset of a Gas Chromatography-mass spectrometry (GC-MS) system (Agilent 7890B fitted with MS 5977A unit) for desorption at 260ºC in split mode (split ratio 100:1). The GC was operated with a HP-INNOWax column (Agilent 19091N-133UI). Samples were injected at an initial oven temperature of 50°C; this temperature was held for 1 min and gradually increased (3°C min -1 ) to 150°C before holding for 1 min. Subsequently, the temperature was increased (20°C min -1 ) to 260°C and held for 5 min. The MS-transfer-line was held at 260°C, the MS source at 230°C, and the MS quad at 150°C. MS spectra were taken in EI-mode (70 eV) in a 29-350 m/z range. Between different collections, the SPME fibre was conditioned at 270°C for 15 min. All chromatograms were processed using MSD ChemStation F.01.03.2357 software. Volatile compounds were identified using the NIST library and matched to standards of the Max-Planck-Institute for Chemical Ecology library. For quantification, peak areas were measured for 3 replicates for each sample. Note that SPME allows only for a qualitative analysis of odour compositions as well as for an estimate of changing ratios of odours across different samples. Vapour pressure values for hexanoic acid, methyl hexanoate and 2 -heptanone were described previously ( www.thegoodscentscompany.com ) 42 , 43 .
Drosophila strains
Drosophila stocks were maintained on standard wheat flour/yeast/fruit juice medium under a 12 h light:12 h dark cycle at 25°C. For all D. sechellia strains, a few g of Formula 4-24® Instant Drosophila Medium, Blue (Carolina Biological Supply Company) soaked in noni juice (nu3 GmbH) were added on top of the standard food. Wild-type Drosophila strains are described in the corresponding figure legends or Supplementary Table 2 . These strains do not show intraspecific sequence variation in OR22a or IR75b for known odour specificity-determining residues ( Extended Data Fig. 12 ), suggesting that other polymorphisms (or non-genetic factors) underlie the observed minor intraspecific behavioural differences ( Fig. 1b,c ). The mutant and transgenic lines used and generated in this study are listed in Supplementary Table 2 . CRISPR/Cas9-mediated genome engineering sgRNA expression vectors : for expression of single sgRNAs, oligonucleotide pairs ( Supplementary Table 3 ) were annealed and cloned into BbsI -digested pCFD3-dU6-3gRNA (Addgene #49410), as described 44 . To express multiple sgRNAs from the same vector backbone, oligonucleotide pairs ( Supplementary Table 4 ) were used for PCR and inserted into pCFD5 (Addgene #73914) via Gibson Assembly, as described 45 . Donor vectors for homologous recombination : to generate an eGFP-expressing donor vector ( pHD-Stinger-attP ), the fluorophore was excised from pStinger 46 with NcoI / HpaI and used to replace the DsRed sequence in NcoI / HpaI -digested pHD-DsRed-attP (Addgene plasmid #51019) 47 . Homology arms (1-1.6 kb) for individual target genes were amplified from D. sechellia ( Drosophila Species Stock Center [DSSC] 14021-0248.07), D. simulans (DSSC 14021-0251.195) or D. melanogaster (Research Resource Identifier Database:Bloomington Drosophila Stock Center [RRID:BDSC]_58492) genomic DNA and inserted either into pHD-DsRed-attP or pHD-Stinger-attP via restriction cloning. Details and oligonucleotide sequences are available from the corresponding authors upon request. Transgenic source of Cas9 : pBac(nos-Cas9,3XP3-YFP) (gift of D. Stern) was integrated into D. sechellia (DSSC 14021-0248.07) via piggyBac transgenesis. The insertion was mapped to the fourth chromosome using TagMap 48 . Transgene construction Oligonucleotides for each cloning step are listed in Supplementary Table 5 . attB-nSyb-Gal4,miniW : 1.9 kb upstream sequence of the neuronal Synaptobrevin ( nSyb ) gene were amplified from D. sechellia genomic DNA (DSSC 14021-0248.07) and inserted into pGal4attB 49 via restriction cloning using NotI and KpnI . attB-Gal4,3XP3-Stinger : we first generated an eGFPnls-SV40 fragment via PCR (using pHD-Stinger-attP as template) and fused it to a minimal attB40 site 50 , 51 before insertion into pCR-Blunt II-TOPO (Thermo Fisher). We added a 3XP3-Stinger fragment amplified from pHD-Stinger via restriction cloning using EcoRV and SalI . Subsequently, we placed a loxP site downstream of the initial SV40 sequence via oligonucleotide annealing and SpeI / KpnI restriction cloning, to produce pCR-TOPO-loxP-attB40-eGFPnlsSV40rev-3XP3:Stinger . We replaced the eGFPnls-SV40 sequence with an hsp70-Gal4-SV40 fragment via PCR amplification of the vector backbone and Gal4 from pGal4attB 49 and subsequent Gibson Assembly resulting in attB-Gal4,3XP3-Stinger . attB-Or22a wt ,3XP3-Stinger : in the pCR-TOPO-loxP-attB40eGFPnlsSV40rev-3XP3-Stinger plasmid described above, the eGFPnlsSV40 fragment was flanked by EcoRV and SalI sites, which were used to integrate the D. sechellia or D. melanogaster Or22a ORF+3’UTR after PCR amplification from cDNA, or the D. simulans Or22a ORF+3’UTR (synthesised by Eurofins Genomics), to produce attB-DsecOr22a wt ,3XP3-Stinger , attB-DmelOr22a wt ,3XP3-Stinger , and attB-DsimOr22a wt ,3XP3-Stinger , respectively. Or22a chimeras : chimeric sequences of D. sechellia and D. melanogaster Or22a were generated by PCR amplification and fusion using the respective species’ Or22a gene templates. After subcloning into pCR-Blunt II-TOPO and sequence confirmation, the chimeras were integrated into pCR-TOPO loxP attB40eGFPnlsSV40rev-3XP3-Stinger via restriction cloning. Or22a site-directed mutant constructs : point mutations were introduced via site directed mutagenesis following standard procedures. attB-UAS-constructs : DsecOr22a wt , DmelOr22a wt , DmelOr22a triple and DmelOr22a M93I were amplified by PCR incorporating flanking EcoRI and SalI restriction sites using the constructs described above as template, and integrated into the EcoRI/XhoI -digested pUAST-attB 52 . pDONR221-MCS : a pDONR221 entry vector carrying a multiple cloning site (MCS) was generated by amplification of the MCS of pCR-Blunt II-TOPO incorporating flanking attB1/2 sites and integration of the PCR fragment into pDONR221 via a BP reaction (Gateway, Thermo Fisher Scientific). pDONR221-DsimOr22a : a 5.7 kb promoter region upstream of the Or22a start codon was amplified from D. simulans (DSSC 14021-0251.195) genomic DNA, subcloned into pCR-Blunt II-TOPO and transferred to pDONR221-MCS via BamHI/EcoRV restriction cloning. pDEST-Hemmar-eGFPnls : the eGFPnls fragment of pStinger 46 was amplified by PCR incorporating XhoI and SpeI restriction sites and integrated into the XhoI/XbaI -digested vector pDEST-HemmarG 53 to replace eGFP . pDsimOr22a-eGFPnls : pDONR221-DsimOr22a and pDEST-Hemmar-eGFPnls were combined using LR recombination (Gateway, Thermo Fisher Scientific). Drosophila microinjections Transgenesis of D. sechellia , D. simulans and D. melanogaster was performed in-house following standard protocols ( http://gompel.org/methods ), except for DsimOr22a-GFPnls (generated by Rainbow Transgenic Flies Inc.). For the D. sechellia egg-laying agar plates, we replaced grape juice with noni juice and added on the surface a few g of Formula 4-24® Instant Drosophila Medium, Blue ( Carolina Biological Supply Company ) soaked in noni juice (nu3 GmbH). Embryos were manually selected for the appropriate developmental stage prior to alignment and injection. For piggyBac transgenesis, we co-injected piggyBac vector (300 ng μl -1 ) and piggyBac helper plasmid 54 (300 ng μl -1 ). For CRISPR/Cas9-mediated homologous recombination, we injected a mix of an sgRNA-encoding construct (150 ng μl -1 ), donor vector (400 ng μl -1 ) and pHsp70-Cas9 (400 ng μl -1 ) (Addgene #45945) 55 . The DsRed fluorescent marker was destroyed in DsecnSyb-Gal4 and DsecUAS-C3PA-GFP via injection of an sgRNA construct targeting DsRed (150 ng μl -1 ) and pHsp70-Cas9 (400 ng μl -1 ). Injections into Dsecnos-Cas9 were of a mix of an sgRNA construct (150 ng μl -1 ) and donor vector (500 ng μl -1 ). Site-directed integration into attP sites was achieved by co-injection of an attB -containing vector (400 ng μl -1 ) and either p3xP3-EGFP.vas-int.NLS (400 ng μl -1 ) (Addgene #60948) 56 or pBS130 (encoding phiC31 integrase under control of a heat shock promoter (Addgene #26290) 57 ). All concentrations are given as final values in the injection mix.
Wind tunnel assay
Long-range attraction experiments were performed in a wind tunnel as described previously 23 with a flight arena of 30 cm width, 30 cm height and 100 cm length. The airstream in the tunnel (0.3 m s -1 ) was produced by a fan (Fischbach GmbH, Neunkirchen, Germany), and filtered through an array of four activated charcoal cylinders (14.5 cm diameter × 32.5 cm length; Camfil, Trosa, Sweden). The wind tunnel was maintained within a climate chamber at 25°C and 50-55% relative humidity under white light. Flies were starved for approximately 20 h; to ensure the flight ability of assayed animals, flies were first released into a mesh cage (50 × 50 × 50 cm, maintained at the same conditions as the wind tunnel) and females escaping from the food vial were collected with an aspirator. For each assay, ten 4-6 day-old females were released from a plastic tube (with a mesh covering one end and the open end facing the landing platform) fixed horizontally in the centre of the first 5-10 cm of the downwind end of the tunnel. The landing platform was built by a filter paper (3 × 3 cm) charged with either 100 μl of juice (noni (Nu3 GmbH), grape (Beutelsbacher Fruchtsaftkelterei), pineapple (Andros), mango (Migros)), apple cider vinegar (Migros) or ~100 μl of homogenised ripe fruit (noni, fig) and fixed on a metal holder. Fruit homogenisation was performed by blending 10 mg of ripe fruit in 20 ml of distilled water, fruit particles were pelleted by centrifugation and the supernatant harvested for experiments. In two-choice assays two identical landing platforms were positioned with equal distance (7.5 cm) from the centre of the air stream alternating the position of noni fruit and apple cider vinegar between assays. The fly tube was placed within the centre of the airstream and 85 cm downwind of the odour source. An experimenter observed the landing platform(s) for the entire duration of the assay; flies arriving and staying on the landing platform(s) within the first 10 min after release were counted.
Olfactory trap assay
The two-choice olfactory trap assay was performed essentially as described 15 . For each experiment, traps contained either 300 μl of juice (noni (Nu3 GmbH), grape (Beutelsbacher Fruchtsaftkelterei), pineapple (Andros), mango (Migros)) or apple cider vinegar (Migros). When using fruits as stimuli (noni, grape, papaya, banana, fig), ripe fruits were peeled (banana, papaya) or used whole, homogenised with pestles, and each trap was filled with a spatula of the mix (to ~300 μl). Single odours (see below for CAS numbers) were used at a 10 -2 dilution in grape juice. Triton X-100 (final concentration 0.2%) was added to all traps containing single odours and respective control traps to drown trapped flies. 25 fed, mated, ice-anesthetised female flies (3-5 day-old) were used for each experiment. D. sechellia flies were transferred to standard food without noni supplement 24 h prior to the start of the assay, unless stated otherwise. The distribution of flies was scored after 24 h at 25°C under red light at 60% relative humidity; experiments with >25% dead flies in the arena after 24 h were discarded. The attraction index was calculated as follows: (number of flies in treatment (e.g., noni juice) trap - number of flies in control (e.g., grape juice) trap)/number of trapped and untrapped flies alive. For the trap assay quantifications in Fig. 2e , all untrapped flies (including those that died during the assay) were counted due to the high mortality rate in these experiments ( Extended Data Fig. 7c ). The multiple-choice olfactory trap assay was performed using eight traps containing mango, pineapple, noni and grape juices, apple cider vinegar and fig, banana and papaya fruits. Traps were placed equidistantly in a circle in random order for each experiment and conditions were as described for the two-choice assay. The percentage of flies per trap was calculated as follows: (number of flies in trap/number of trapped and untrapped flies alive)×100. Experiments with >25% dead flies in the arena after 24 h were discarded.
Two-photon calcium imaging
Flies were mounted and dissected as previously described 58 , and images were acquired using a commercial upright two-photon microscope (Zeiss LSM 710 NLO). In detail, an upright Zeiss AxioExaminer Z1 was fitted with a Ti:Sapphire Chameleon Ultra II infrared laser (Coherent) as excitation source. Images were acquired with a 20× water-immersion objective (W Plan-Apochromat 20×; NA 1.0, VIS-IR DIC), with a resolution of 128×128 pixels (1.1902 pixels μm -1 ) and a scan speed of 12.6 μs pixel -1 . The excitation wavelength was set to 920 nm at a laser output of 64.1-70.2 mW measured at the exit of the objective. Emitted light was filtered with a 500-550 nm band-pass filter, and photons were collected by an external non-descanned detector. Each measurement consisted of 50 images acquired at 4.13 Hz, with stimulation starting ~5 s after the beginning of the acquisition and lasting for 1 s. Fly antennae were stimulated using a custom-made olfactometer as previously described 59 , with minor modifications. In brief, the fly’s antennae were permanently exposed to air flowing at a rate of 1.5 l min -1 and with 55% relative humidity obtained by combining a main stream of humidified room air (0.5 l min -1 ) and a secondary stream (1 l min -1 ) of normal room air. Both air streams were generated by vacuum pumps (KNF Neuberger AG) and the flow rate was controlled by two independent rotameters (Analyt). The secondary air stream was guided through either an empty 2 ml syringe or, to generate an odour pulse, a 2 ml syringe containing 20 μl of odour or solvent on a small cellulose pad (Kettenbach GmbH). Solvents were either double-distilled water (for noni juice and apple cider vinegar) or paraffin oil (for methyl hexanoate (CAS 106-70-7), 2 -heptanone (CAS 110-43-0), 2 , 3 -butanedione (CAS 431-03-8), ethyl propionate (CAS 105-37-3) and 1 -hexanol (CAS 111-27-3)). To switch between control air and odour stimulus delivery, a three-way magnetic valve (The Lee Company, Westbrook, CT) was controlled using Matlab via a VC6 valve controller unit (Harvard Apparatus). Data were processed using Fiji 60 and custom written scripts in Matlab and R as previously described 59 . Since bleaching was very strong at the beginning of each acquisition, the first 1.5 s were not considered for the analysis, and bleach correction was not applied. Colour-coded images and boxplots show the peak response calculated as the mean relative change in fluorescence (% ΔF/F) of three frames around the maximum during frames 19-30.
Widefield calcium imaging
Flies were mounted and dissected as previously described 58 . Images were acquired with a CCD camera (CoolSNAP-HQ2 Digital Camera System) mounted on a fluorescence microscope (upright fixed stage Carl Zeiss Axio Examiner D1) equipped with a 20× water-immersion objective (W Plan-Apochromat 20×; NA 1.0, VIS-IR DIC, Extended Data Fig. 4a ) or 40× water-immersion objective (W Plan-Apochromat 40×; NA 1.0 VIS-IR DIC, Extended Data Fig. 4f ). Excitation light of 470 nm was produced with an LED light (Cool LED pE-100, VisiChrome, intensity 1.8-3.9%). Light was guided through a filter block consisting of a 450-490 nm excitation filter, a dichroic mirror (T495LP), and a 500-550 nm emission filter (Chroma ET). Binned image size was 400×300 pixels ( Extended Data Fig. 4a ) or 266×200 pixels ( Extended Data Fig. 4f ) on the chip, corresponding to 465×349 μm ( Extended Data Fig. 4a ) or 149×112 μm ( Extended Data Fig. 4f ) in the preparation. Exposure time varied between 30-100 ms to adjust for different basal fluorescence values across preparations. Films (12.5 s duration) were recorded with an acquisition rate of 4 Hz.
Metafluor software
(Visitron) was used to control the camera, light, data acquisition and onset of odour stimulation. Odour stimulation and data analysis were otherwise performed as described for two-photon calcium imaging.
Electrophysiology
Single sensillum electrophysiological recordings were performed as described previously 61 . Noni and grape juice were purchased from Nu3 (nu3 GmbH) and Beutelsbacher (Beutelsbacher Fruchtsaftkelterei GmbH) and chemicals of the highest purity available from Sigma-Aldrich. Odorants were used at 10 -2 (v/v) in all experiments unless noted otherwise in the figures or figure legends. Solvents were either double-distilled water (for noni juice, butyric acid (CAS 107-92-6), hexanoic acid (CAS 1821-02-9)) or paraffin oil (for octanoic acid (CAS 124-07-2), methyl butanoate (CAS 623-42-7), methyl hexanoate (CAS 106-70-7), methyl octanoate (CAS 111-11-5), ethyl butanoate (CAS 105-54-4), ethyl hexanoate (CAS 123-66-0), ethyl octanoate (CAS 106-32-1), 2 -heptanone (CAS 110-43-0), 1 -hexanol (CAS 111-27-3) and 3 -buten- 1 -ol (CAS 627-27-0)). Odours for sensilla stimulation were used for a maximum of five consecutive trials. If noni juice or noni fruit extract (see Wind tunnel assay section for details) were used, odours were renewed after two stimulations or, for 10 -4 , 10 -3 and 10 -2 dilutions, after each stimulation. Corrected responses were calculated as the number of spikes in a 0.5 s window at stimulus delivery (200 ms after stimulus onset to take account of the delay due to the air path) subtracting the number of spontaneous spikes in a 0.5 s window 2 s before stimulation, multiplied by two to obtain spikes s -1 . The solvent-corrected responses shown in the figures were calculated by subtracting from the response to each diluted odour the response obtained when stimulating with the corresponding solvent. Recordings were performed on a maximum of three sensilla per fly. Exact n and mean spike counts for all experiments are provided in Supplementary Data Table 7 .
Immunohistochemistry Fluorescent RNA in situ hybridisation using digoxigenin- or fluorescein-labelled
RNA probes and immunofluorescence on whole-mount antennae were performed essentially as described 59 , 62 . D. sechellia probe templates were generated by amplification of regions of genomic DNA (DSSC 14021-0248.07) using primer pairs listed in Supplementary Data Table 6 ; these were cloned into pCR-Blunt II-TOPO and sequenced. D. sechellia OR22a antibodies were raised in rabbits against the peptide epitope PHISKKPLSERVKSRD (amino acids 7-22), affinity-purified (Proteintech Group Inc) and diluted 1:250. Other antibodies used were: guinea pig α-IR75b (RRID:AB_2631093) 63 1:200, rabbit α-IR64a (RRID:AB_2566854) 34 1:100, rabbit α-ORCO 28 1:200, guinea pig α-IR8a (RRID:AB_2566833) 27 1:500, rabbit α-IR25a (RRID:AB_2567027) 1:500 64 , rabbit α-GFP 1:500 (Invitrogen). Immunofluorescence on adult brains was performed as described 65 (except for the D. sechellia reference brain samples; see below) using mouse monoclonal antibody nc82 1:10 (Developmental Studies Hybridoma Bank), rat monoclonal α-Elav 1:10 (Developmental Studies Hybridoma Bank) and rabbit α-GFP 1:500 (Invitrogen). Alexa488-, Cy3- and Cy5-conjugated goat α-guinea pig, goat α-mouse, goat α-rat and goat α-rabbit IgG secondary antibodies (Molecular Probes; Jackson Immunoresearch) were used at 1:500. D. sechellia reference brain D. sechellia (DSSC 14021-0248.07) brains (2-7 day-old animals) were stained with nc82 and imaged as described 66 . From 88 female brains imaged, 26 high-quality confocal stacks of the midbrain were selected for averaging on a selected “seed” brain, essentially as described 67 , 68 . Similarly, a male reference brain (not shown here) was constructed, using 20 high-quality confocal stacks (from 87 initially imaged). Reciprocal bridging registrations between D. melanogaster and D. sechellia references brains were also generated to permit comparison of homologous neurons within a common template, essentially as described 68 . The reference brains ( DsecF and DsecM ), bridging registrations and associated code are available for download via http://jefferislab.org/si/auer2019 .
Image acquisition and processing
Confocal images of antennae and brains were acquired on an inverted confocal microscope (Zeiss LSM 710) equipped with an oil immersion 40× objective (Plan Neofluar 40× Oil immersion DIC objective; 1.3 NA), unless stated otherwise. Images were processed in Fiji 60 . D. sechellia brains were imaged and registered to a D. sechellia reference brain using the Fiji CMTK plugin ( https://github.com/jefferis/fiji-cmtk-gui ), as described 69 . For segmentation of individual glomeruli of the antennal lobe, glomerular identity was confirmed by location and labelling with Gal4 reporters ( Extended Data Fig. 3 ) and segmentation performed using Amira 6.5 (Thermo Fisher Scientific). Glomerular volumes were calculated following segmentation with the Segmentation Editor plugin of Fiji using the 3D Manager Plugin. OSN numbers were counted using the Cell Counter Plugin in Fiji or Imaris (Bitplane). Projection neuron morphologies were reconstructed and measured in neuTube 1.0z 70 .
Projection neuron labelling
Photoactivation was performed as described 35 on 3-5 day-old female flies. Brains were dissected in saline 71 (low carbonate; 2 mM Mg 2+ pH 7.2) and treated with collagenase (2 mg ml -1 , 45 s). Dissected brains were initially imaged at 925 nm to identify the DM2 glomerulus based on anatomical position. Photoactivation was achieved through multiple cycles of exposure to 710 nm laser light with a 15 min rest period between each cycle to allow diffusion of the photoactivated fluorophore within the neuron. Photoactivation and imaging was performed on an Ultima two-photon laser scanning microscope (Bruker) equipped with galvanometers driving a Chameleon XR laser (Coherent). Emitted photons were collected with a GaAsP photodiode detector (Bruker) or a PMT detector through a 60× objective (Olympus 60× water immersion; 0.9 NA). PN dye-fillings were performed as described 35 with some modifications. Brains were dissected in saline, briefly treated with collagenase (2 mg ml -1 , 45 s), washed and pinned with fine tungsten wires to a Sylgard sheet (World Precision Instruments) in a 35 mm Petri dish (Falcon) filled with saline. Pulled glass electrodes were backfilled with Texas Red Dextran (3000, lysine fixable, Thermo Scientific). The electrode was targeted to the DM2 glomerulus using as a guide either basal expression of the pan-neuronal, photoactivatable GFP ( D. sechellia and D. melanogaster ) or DM2-specific labelling ( D. simulans , i.e., the Or22a-GFPnls strain, in which trace GFP levels were detected in OSN axon termini). The dye was electroporated by applying voltage pulses (30 V) until it became visible in distal neural processes of the PN, and left to diffuse for 60 min. Brains were subsequently imaged by two-photon microscopy, as described above. To label single PNs, the DM2 glomerulus was first subjected to one cycle of exposure to 710 nm laser light to identify the cell bodies of DM2 PNs. Subsequently, the filled glass electrode was placed in the centre of the soma of one DM2 PN and the dye was electroporated by applying voltage pulses (30 V) until it became visible in distal neural processes of the neuron. The dye was left to diffuse for 60 min, before the brains were fixed with 2% paraformaldehyde for 45 min and subjected to immunofluorescence using nc82 (1:20) and α-mouse Alexa488 (1:500), as described above. Images were acquired on a Zeiss LSM 880 Airy scan confocal microscope using a 40× objective (Plan Neofluar 40× oil immersion DIC objective; 1.3 NA). Molecular evolution and polymorphism analyses The Or22a/b gene tree was inferred using annotations after manual verification by BLASTing OR22a/b protein sequences (using tblastn with default settings, BLAST+ v2.7.1 72 ) to the genomes of D. simulans (r2.01), D. mauritiana (r1), D. yakuba (r1.04), D. sechellia (r1.3) and D. erecta (r1.3). Genomic regions were annotated using Wise2 (v2.4.1) 73 , with D. melanogaster ’s protein sequences as guides. All genes appeared intact and consistent with existing models, with one exception: D. mauritiana Or22b is truncated by ~240 bp due to a gap in the reference genome. The cDNAs were frame-aligned using TranslatorX 74 . The gene tree based on these alignments was inferred using MrBayes (v3.2.6) 75 with the following settings: rate variation = invariable+gamma, number of substitutions = 6, substitution model = default, number of generations = 10, sample frequency = 10, burn-in = 250. The Or22a/b topology outputted from MrBayes was used for PAML (v4.8) 76 CodeML branch tests of protein evolution rate change. Seven models were tested, one with a freely varying ω value and six other models with 1, 4, 5, 7, 8 and 9 ω values (CodeML parameters were all set to zero except for the following: seqtype = 1, CodonFreq = 2, ndata = 1, model = 2, kappa = 2, omega = 0.4, fix_alpha = 1, ncatG = 5, getSE = 1, Small_Diff = 5e-7, cleandata = 1). Nested comparisons between these models using likelihood ratio tests identified a model with 5 ω values to provide the best fit ( Supplementary Data Table 8 , Extended Data Fig. 11d ). Polymorphism data for Or22a/b was extracted from previously published data. The D. simulans and D. sechellia datasets were from 7 , 77 and the D. melanogaster datasets from 78 , 79 . VCFtools (v0.1.17) 80 was used to extract variable sites from the respective VCF files, as well as to output allele frequencies. Variant calling in 7 was based on a subversion of the D. simulans r2 genome, which is slightly different than r2 on FlyBase. This subversion is available at https://github.com/kern-lab/FILET/blob/master/simSechResults/dsimV2-Mar2012_chrsonly.fa.bz2 .
Statistics and reproducibility
Data were analysed and plotted using Excel and R (v3.2.3; R Foundation for Statistical Computing, Vienna, Austria, 2005; R-project-org).
Supplementary Material Supplementary tables Supplementary legends and references
📊 Figures

Extended Data Fig. 1
Species-specific short- and long-range behavioural responses to diverse fruit stimuli.
a , Data reproduced from Fig. 1c . Behavioural responses in a trap assay testing preferences between noni and grape, or between noni juice and grape juice (n = 15-27 experiments; 22-25 females/experim...
Extended Data Fig. 2
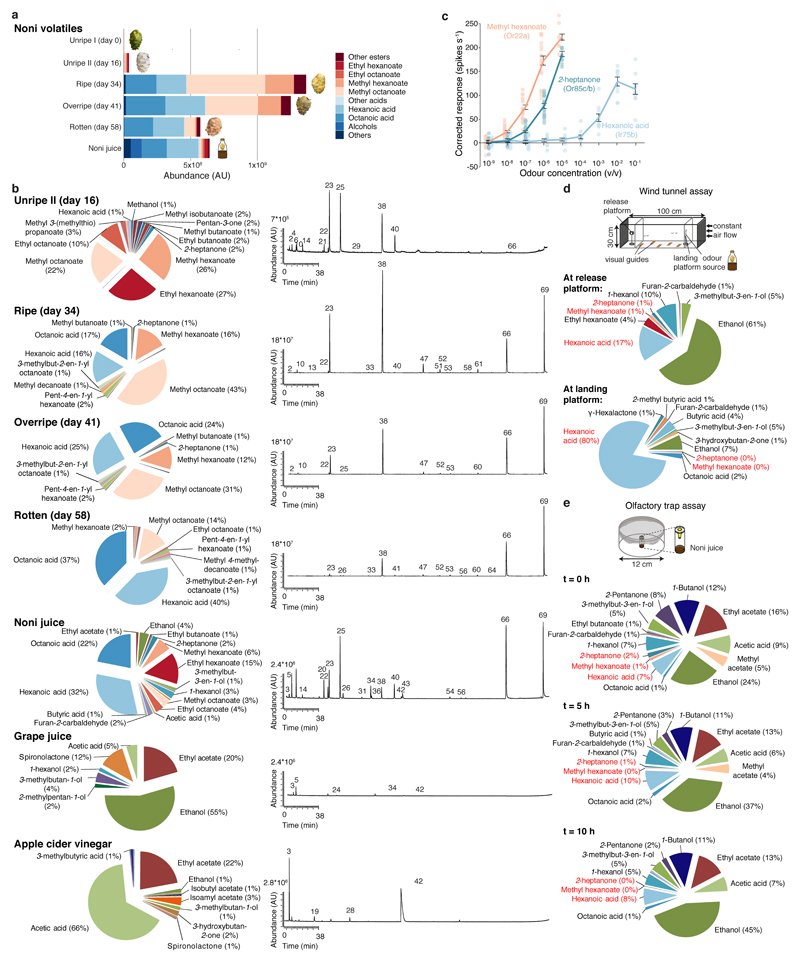
Chemicals emitted by natural odour sources and odour bouquet changes in behavioural assays.
a , Principal constituents of the odour bouquet of noni fruit at different ripening stages and commercial noni juice, as determined by gas chromatography/mass spectrometry. AU = arbitrary units. b , C...

Extended Data Fig. 3
Olfactory sensory neuron Gal4 driver lines in D. sechellia .
a , Schematic of the Gal4 reporter allele generation strategy, through CRISPR/Cas9-mediated integration of an attP site (marked by 3xP3:DsRed ) into the desired Or or Ir gene (see Extended Data Fig. 5...
Extended Data Fig. 4
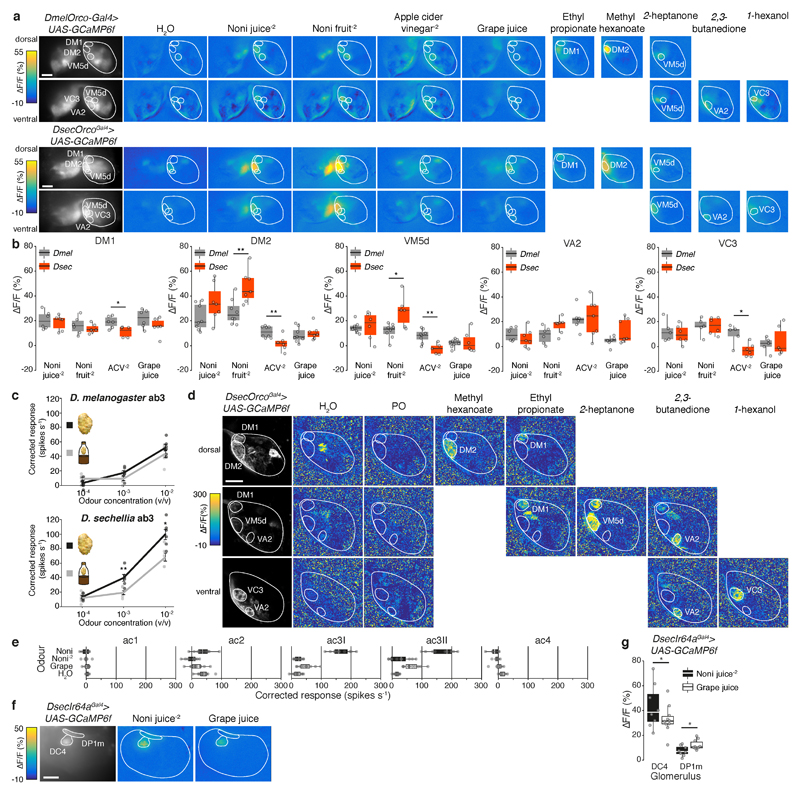
Comparative olfactory representations of noni in D. melanogaster and D. sechellia .
a , Representative odour-evoked calcium responses in the axon termini of Orco OSNs in the antennal lobes of D. melanogaster ( Orco-Gal4/Orco-Gal4;UAS-GCaMP6f/UAS-GCaMP6f ) and D. sechellia ( UAS-GCaMP...
Extended Data Fig. 5
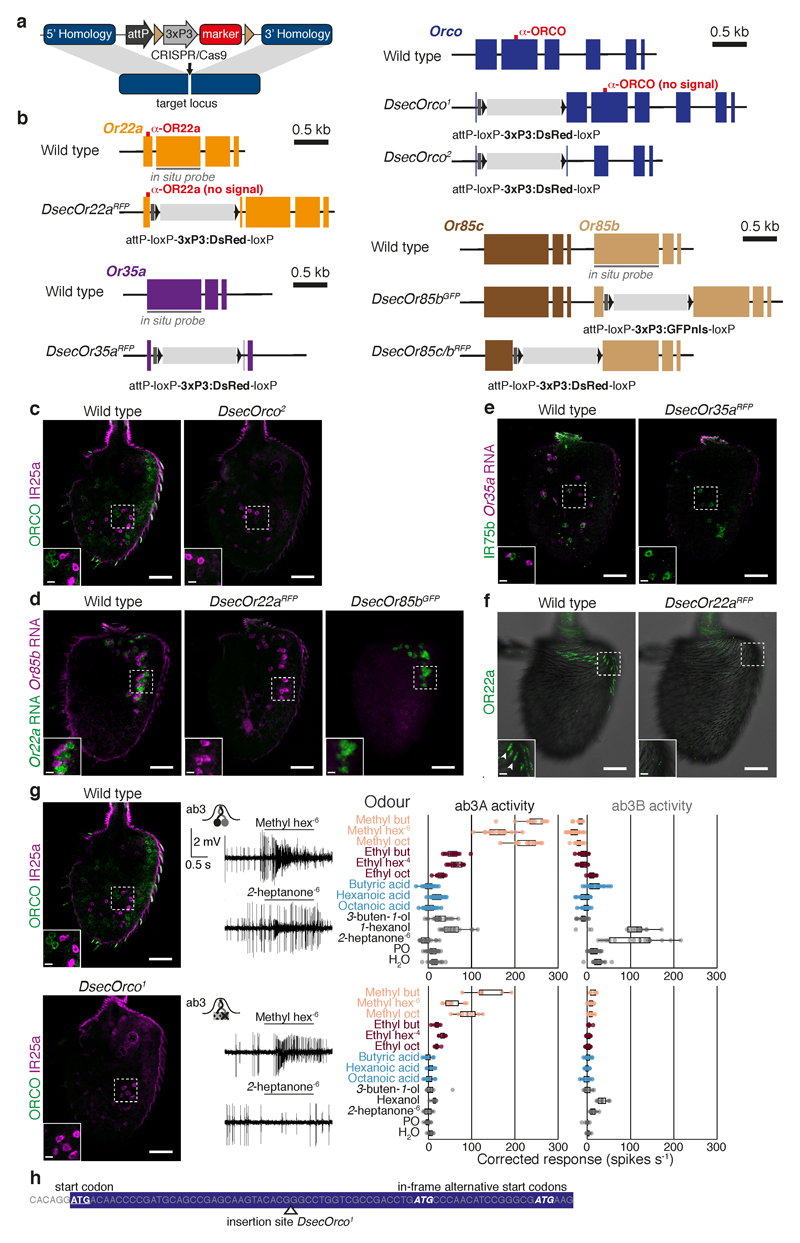
Generation and validation of loss-of-function alleles of D. sechellia Or genes.
a , Schematic of the strategy for generating olfactory receptor mutant alleles, through integration of an eye-expressed fluorescent marker ( 3xP3:DsRed or 3xP3:GFPnls ) into the desired locus via CRIS...

Extended Data Fig. 6
Generation and validation of loss-of-function alleles of D. sechellia Ir genes.
a , Schematics depicting Ir gene organisation, the structure of mutant alleles, and the sequences encoding antibody epitopes. For DsecIr8a RFP/GFP the fluorescent marker was integrated into the first ...

Extended Data Fig. 7
Genetic and chemical contributions promoting attraction of D. sechellia to noni.
a , Data reproduced from Fig. 2d . Behavioural responses in a trap assay testing preference of the indicated genotypes for noni juice or grape juice (n = 13-25 experiments; 22-25 females/experiment). ...
Extended Data Fig. 8
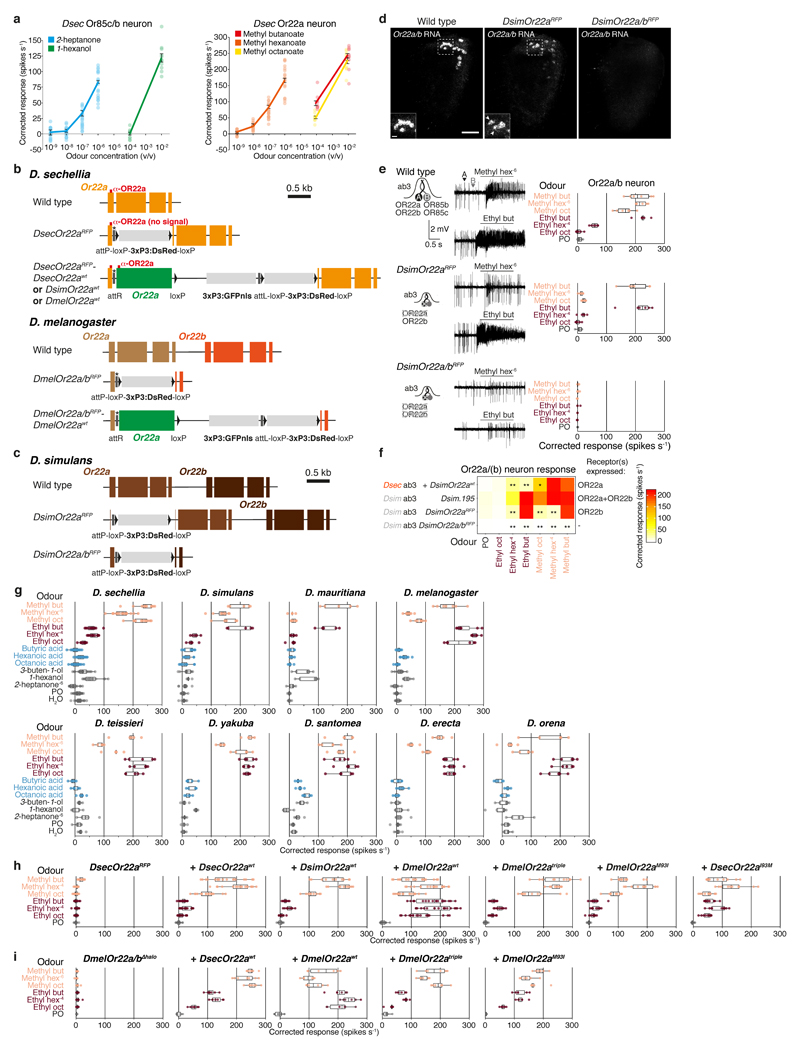
Odour-tuning properties of drosophilid Or85c/b and Or22a/(b) neurons and genomic modifications of the Or22a/(b) loci.
a , Left: dose-dependent electrophysiological responses of Or85c/b neurons (ab3B) in wild-type D. sechellia (DSSC 14021-0248.07) to 2 -heptanone and 1 -hexanol (mean u00b1 SEM and individual data poin...
Extended Data Fig. 9
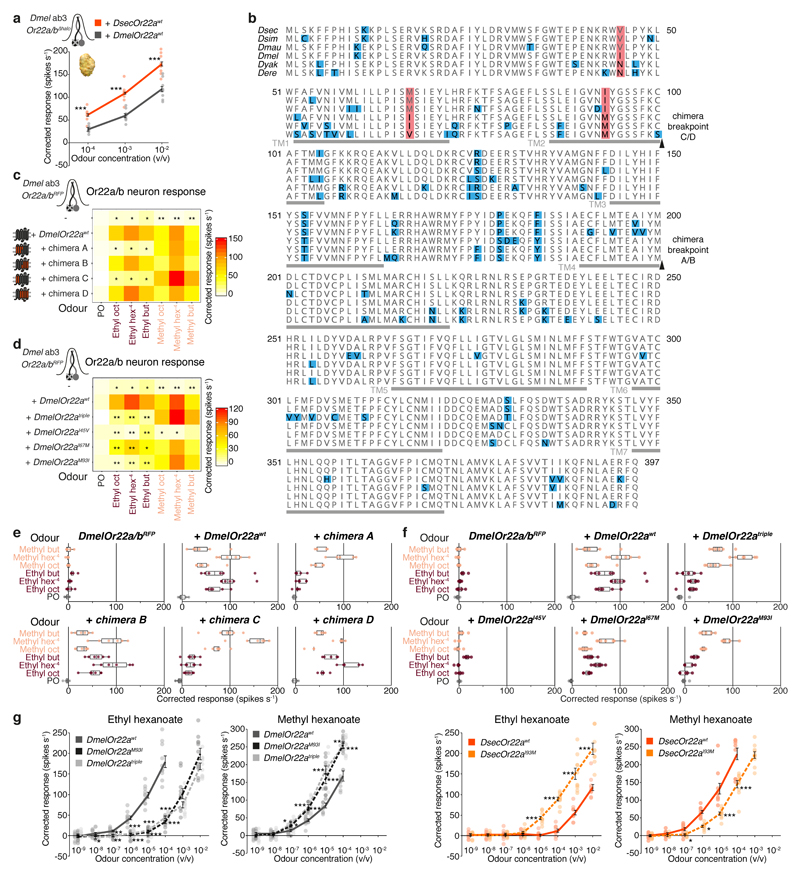
Mapping of odour-specificity determinants of OR22a.
a , Electrophysiological responses of D. melanogaster Or22a/b mutant neurons expressing DsecOr22a wt or DmelOr22a wt upon stimulation with increasing concentrations of noni fruit extract (mean u00b1 S...
Extended Data Fig. 10
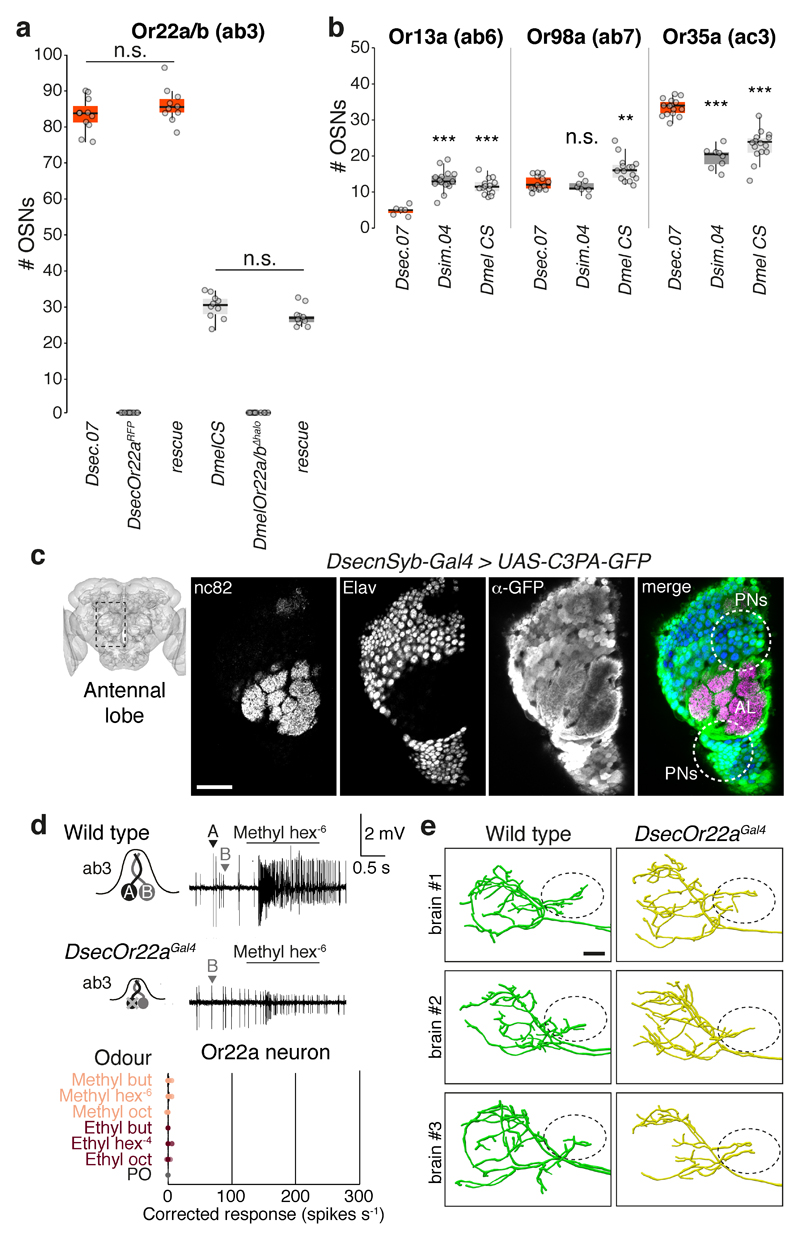
Peripheral and central olfactory circuit changes in D. sechellia .
a , Quantification of the number of OSNs expressing Or22a/(b) in antennae of wild-type D. sechellia (DSSC 14021-0248.07) and D. melanogaster (Canton-S) (data as shown in Fig. 4b ), Or22a/(b) mutants i...
Extended Data Fig. 11
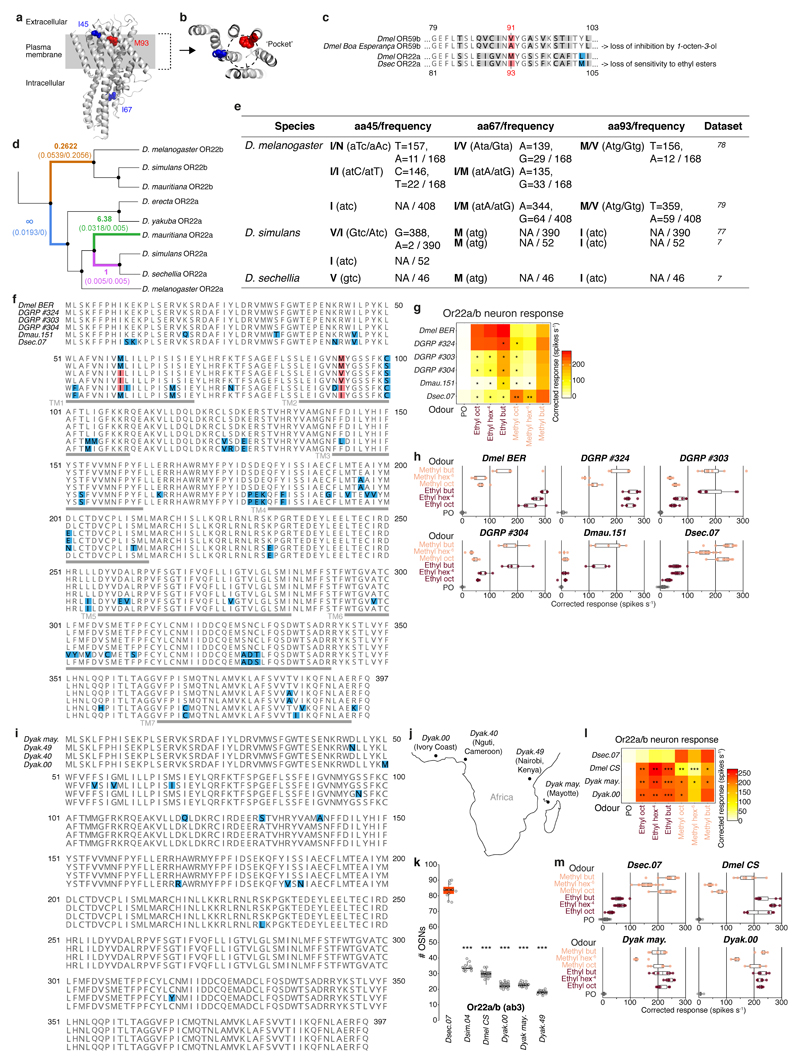
Phylogenetic and functional analysis of odour-specificity determinants in OR22a.
a , Side view of the ORCO monomer structure (determined by cryo-electronic microscopy 37 ); the approximate location of the plasma membrane is indicated. The location of the residues corresponding to ...

Extended Data Fig. 12
Protein sequence alignments of OR22a and IR75b.
a , OR22a orthologues of strains used for behavioural assays as well as genome-sequenced strains (u201c gen .u201d) of each species (version: D. sechellia (r1.3), D. simulans (r2.01), D. melanogaster ...

Fig. 1
Behavioural and physiological responses of D. sechellia to noni.
a , D. sechellia specialises on noni fruit ( Morinda citrifolia ) while D. simulans and D. melanogaster are food generalists (MYA = million years ago). b , Behavioural responses to noni fruit or juice...

Fig. 2
Olfactory receptors contribution to noni-sensing.
a , Electrophysiological responses of ab3 sensillum neurons to noni odours (n = 5-20, females, see Supplementary Table 7 for exact n and mean spike counts) in wild-type and receptor mutant D. sechelli...
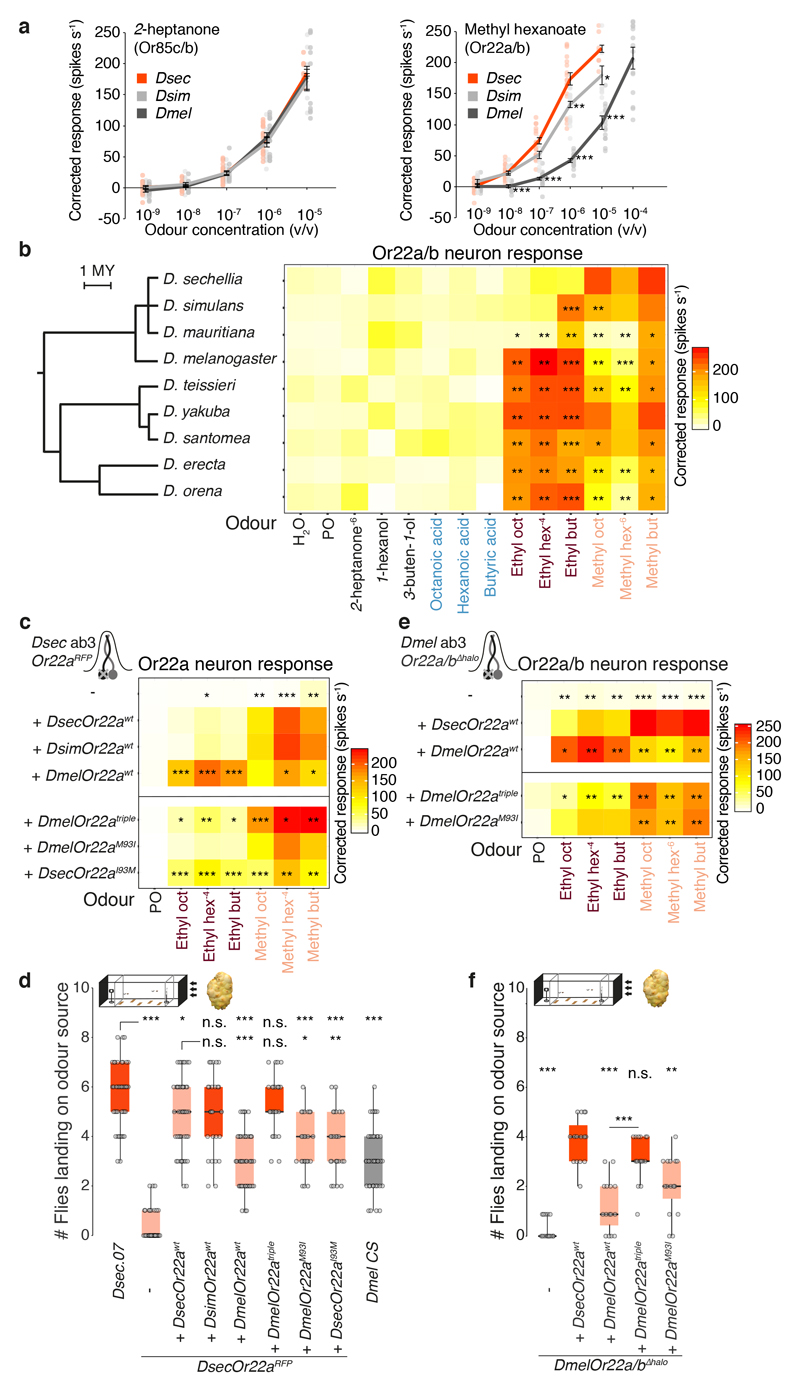
Fig. 3
Tuning of OR22a is important for noni attraction.
a , Dose-dependent responses of Or85c/b (left) and Or22a/(b) neurons (right) in the indicated species to 2 -heptanone and methyl hexanoate, respectively (mean u00b1 SEM and individual data points, n =...
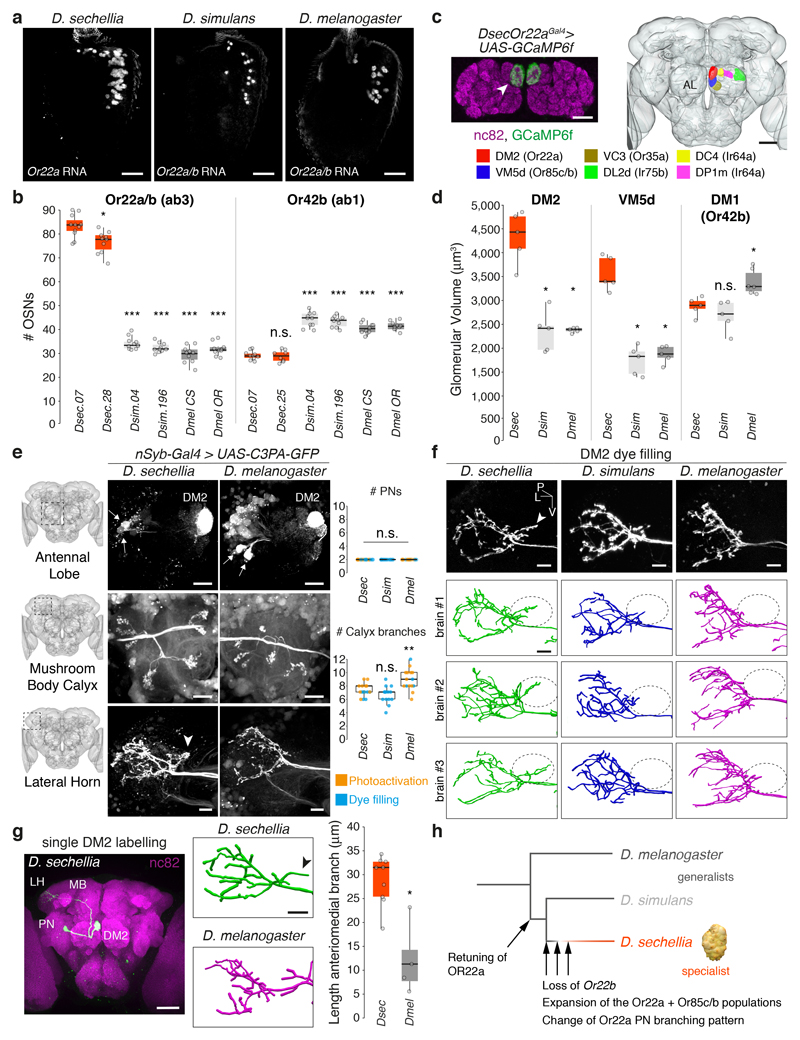
Fig. 4
Neuroanatomy of noni-sensing olfactory pathways.
a , Antennal Or22a/b RNA expression in different species. Scale bars, 25 u03bcm. b , Quantification of Or22a/(b) or Or42b OSNs (n = 8-11, females). Comparisons to Dsec.07 are shown (pairwise Wilcoxon ...
Figure images are served from the NIH/NLM PubMed Central Open Access Subset or Europe PMC; copyright remains with the publishers and authors.
💬 Discussion
0 commentsNo comments yet. Be the first to start a discussion!
Leave a Comment