Abstract
SummaryDespite being essential for successful infection, the molecular cues involved in host recognition and genome transfer of viruses are not completely understood. Bacterial outer membrane proteins A and C co‐purify in lipid vesicles with bacteriophage Sf6, implicating both outer membrane proteins as potential host receptors. We determined that outer membrane proteins A and C mediate Sf6 infection by dramatically increasing its rate and efficiency. We performed a combination of in vivo studies with three omp null mutants of Shigella flexneri, including classic phage plaque assays and time‐lapse fluorescence microscopy to monitor genome ejection at the single virion level. Cryo‐electron tomography of phage ‘infecting’ outer membrane vesicles shows the tail needle contacting and indenting the outer membrane. Lastly, in vitro ejection studies reveal that lipopolysaccharide and outer membrane proteins are both required for Sf6 genome release. We conclude that Sf6 phage entry utilizes either outer membrane proteins A or C, with outer membrane protein A being the preferred receptor.
🔬 Techniques
🧬 Organisms
💻 Software
✨ Fluorophores
🏭 Microscope Brands
🧪 Reagent Suppliers
📷 Detectors
💻 Software Details
🏛️ Research Organizations (ROR)
Affiliated research institutions:
📋 Methods
Single step growth curves S. flexneri (WT, ompA - , ompC - , and ompA - C - ) were grown in LB at 30 °C to a concentration of 2×10 8 cells per mL. Phage infection was initiated at an MOI of 15 for the WT, ompA -, and ompC - strains, and an MOI of 30 was used for the ompA - C - strain. At times ranging from zero to three hours after infection was initiated, aliquots of infected cells were diluted with phage buffer containing saturating amounts of chloroform to lyse the cells. Lysates were plated and the number of phage per cell at each time point was calculated as described previously ( Parent et al., 2004 ). Aliquots of the cells were assayed before infection and ten minutes post infection to ensure that >95% of the cells were infected, and therefore burst size determination was not affected by a second round of infected cells. These experiments were repeated in triplicate and representative plots are shown in Figure 2A . Adsorption rates of Sf6 to Shigella Initial Sf6 adsorption to Shigella was monitored by adding phage to cells at high MOI, taking aliquots at various times (ranging from zero to 20 minutes at 30 °C), spinning out the cells and attached phage for 30 seconds in a microfuge, and titering the supernatant. The concentration of phage was held constant in each experiment (∼1 × 10 9 phage per mL). We also accurately determined the cell concentration for each sample by plating and counting CFUs before the addition of phage. The fit of these data was done using Kaleidagraph software and only data sets that demonstrated linear kinetics were included in further analysis.
Show full methods section
Single step growth curves S. flexneri (WT, ompA - , ompC - , and ompA - C - ) were grown in LB at 30 °C to a concentration of 2×10 8 cells per mL. Phage infection was initiated at an MOI of 15 for the WT, ompA -, and ompC - strains, and an MOI of 30 was used for the ompA - C - strain. At times ranging from zero to three hours after infection was initiated, aliquots of infected cells were diluted with phage buffer containing saturating amounts of chloroform to lyse the cells. Lysates were plated and the number of phage per cell at each time point was calculated as described previously ( Parent et al., 2004 ). Aliquots of the cells were assayed before infection and ten minutes post infection to ensure that >95% of the cells were infected, and therefore burst size determination was not affected by a second round of infected cells. These experiments were repeated in triplicate and representative plots are shown in Figure 2A . Adsorption rates of Sf6 to Shigella Initial Sf6 adsorption to Shigella was monitored by adding phage to cells at high MOI, taking aliquots at various times (ranging from zero to 20 minutes at 30 °C), spinning out the cells and attached phage for 30 seconds in a microfuge, and titering the supernatant. The concentration of phage was held constant in each experiment (∼1 × 10 9 phage per mL). We also accurately determined the cell concentration for each sample by plating and counting CFUs before the addition of phage. The fit of these data was done using Kaleidagraph software and only data sets that demonstrated linear kinetics were included in further analysis.
Fluorescence microscopy Fluorescent
Sf6 were made by incubating a high-titer lysate (>10 9 PFU/ml) with 1 μM of Sytox green nucleic acid stain at 4°C for 24 hours. Overnight cultures of Shigella flexneri (WT, ompA - , ompC - , and ompA - C - ) were diluted in LB and grown to mid-log at 30°C with aeration. Cells (1 mL) were pelleted with 1 minute of centrifugation and resuspended in approximately 50μL of fresh LB. Five μL of a DNase I mixture (two units DNase I (New England Biolabs), in 1× supplied DNase I buffer, in ddH 2 O) were added to the cell re-suspension. A five μL aliquot of the cell suspension was mixed with one μL of Sytox-stained phage (at an MOI
📊 Figures
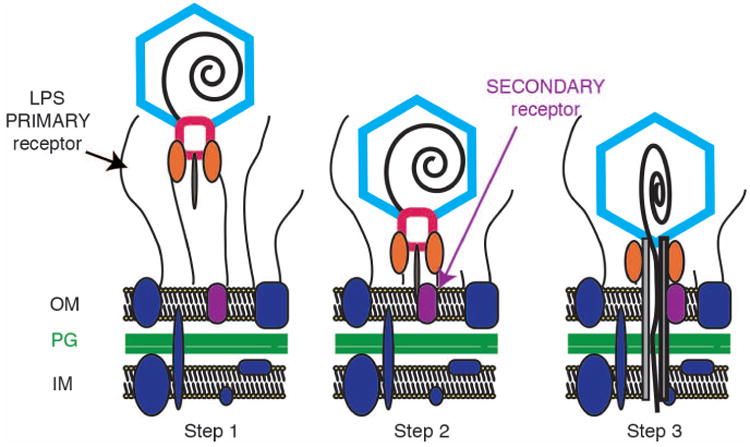
Figure 1
Schematic diagram of steps in dsDNA genome ejection for members of the family Podoviridae
Step 1: A virion binds to its cell surface primary receptor. In the P22-like phages, the phage tailspike proteins (orange ovals) bind the lipopolysaccharide (LPS) through the O-antigen. Step 2: Tailsp...
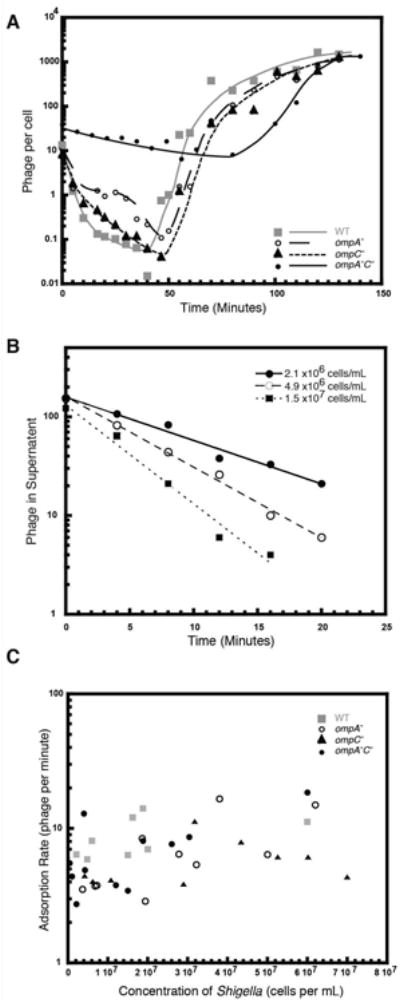
Figure 2
Sf6 infection is slowest in ompA - C - Shigella
A) Exponentially growing Shigella were infected with Sf6 phage and at the designated times after infection, aliquots of each reaction were treated with chloroform and plated at 30 u00b0C on WT Shigell...
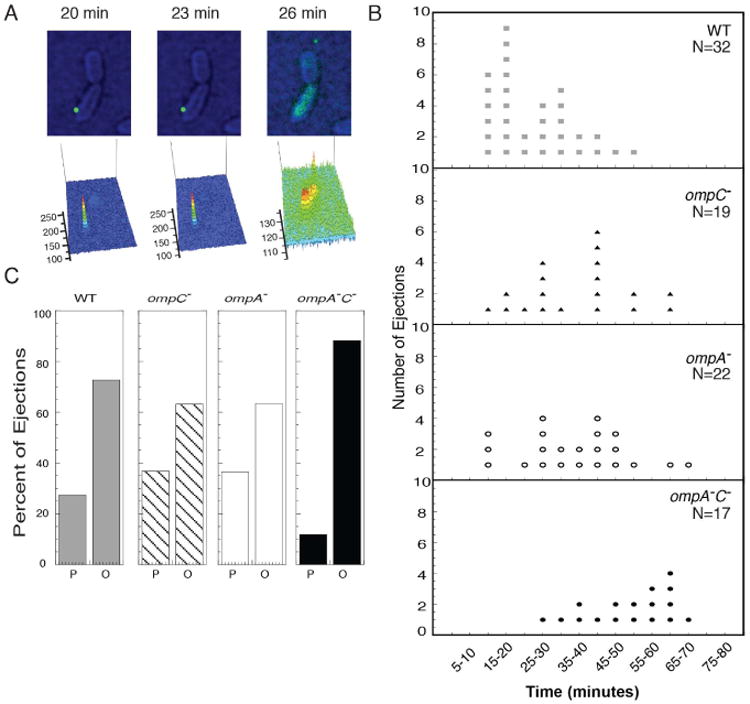
Figure 3
Time-lapse fluorescence microscopy shows that Sf6 infection is slower on omp null strains
A) Still frames of a time-lapse experiment showing Sf6 (labeled with Sytox green dye) attached to unstained, live WT Shigella (artificially colored to enhance visibility). Below each still image is a ...
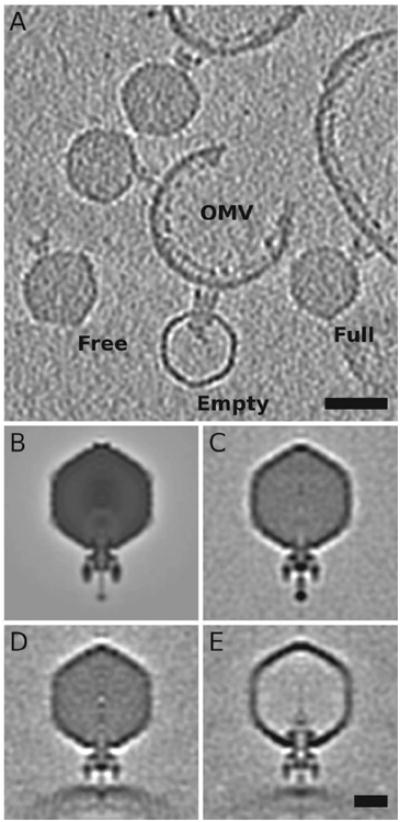
Figure 4
Cryo-electron tomography and sub-tomogram averages of Sf6 u201cinfectingu201d OMVs from S. flexneri
A) A 40u00c5 thick slice from a representative 3D tomogram, showing isolated, unattached phage (u201cFreeu201d), genome-containing phage that are attached to OMVs (u201cFullu201d), and genome-lacking ...
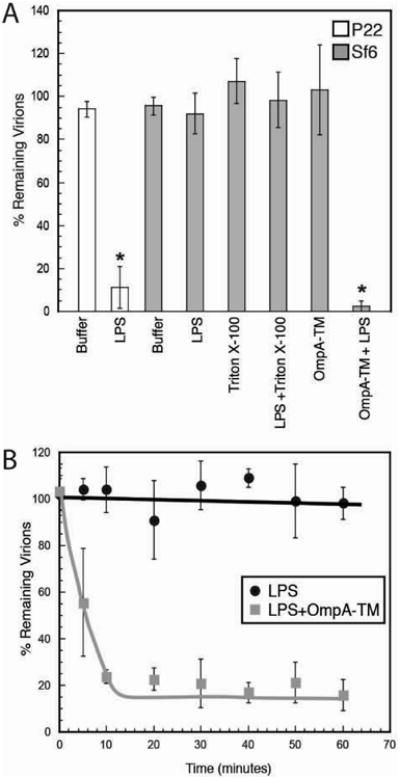
Figure 5
In vitro genome ejection of Sf6 and P22
A) u201c% Remaining Virionsu201d was calculated as the number of PFU remaining after incubation with detergent, LPS, OmpA-TM, or LPS and OmpA-TM, divided by the number of PFU when incubated with buffe...
Figure images are served from the NIH/NLM PubMed Central Open Access Subset or Europe PMC; copyright remains with the publishers and authors.
💬 Discussion
0 commentsNo comments yet. Be the first to start a discussion!
Leave a Comment