Abstract
AbstractCrosstalk between oocytes and surrounding somatic cells is crucial for mammalian oogenesis, but the structural mechanisms on oocytes to control female reproduction remain unknown. Here we combine endogenous-fluorescent tracing mouse models with a high-resolution live-cell imaging system to characterize oocyte-derived mushroom-like microvilli (Oo-Mvi), which mediate germ-somatic communication in mice. We perform 3D live-cell imaging to show that Oo-Mvi exhibit cellular characteristics that fit an exocrine function for signaling communication. We find that deletion of the microvilli-forming gene Radixin in oocytes leads to the loss of Oo-Mvi in ovaries, and causes a series of abnormalities in ovarian development, resulting in shortened reproductive lifespan in females. Mechanistically, we find that Oo-Mvi enrich oocyte-secreted factors and control their release, resulting in optimal selection of ovarian follicles. Taken together, our data show that the Oo-Mvi system controls the female reproductive lifespan by governing the fate of follicles.
🔬 Techniques
🔭 Microscopes
💻 Software
✨ Fluorophores
🧪 Sample Preparation
🏭 Microscope Brands
🧪 Reagent Suppliers
📷 Detectors
💻 Software Details
📋 Protocols
🏛️ Research Organizations (ROR)
Affiliated research institutions:
📋 Methods
Mice
C57BL/6 mice were from the Laboratory Animal Center of the Institute of Genetics (Beijing, China). Gdf9-Cre , Foxl2-CreER T2 , and mTmG mice were generated as previously reported 23 – 25 . Foxl2-CreER T2 mice were a gift from Dr. Liu Kui. The Rdx loxP/loxP and Gdf9 −/− mice were generated using CRISPR/Cas9-mediated genome engineering by the Model Animal Research Center of Nanjing University (MARC), Nanjing BioMedical Research Institute of Nanjing University, Nanjing, China. Generally, exons 4 and 5 of the Rdx gene were selected as the targeted region to delete in the Rdx loxP/loxP mice, and the exon 2 of Gdf9 gene was deleted in the Gdf9 −/− mice. All mutant mouse strains were on the C57BL/6 background. In the Foxl2-CreER T2 ;mTmG females, upon a single injection of tamoxifen (75648, Sigma-Aldrich) at a dosage of 5 μg/kg body weight (BW) at PD8, CreER T2 recombinase-mediated recombination to label a single GC after 1 week 50 . With tamoxifen at a high dosage of 20 μg/kg BW for three injections at PD8/10/12, almost all GCs were labeled after 1 week of treatment 25 , 50 . All mice were housed in mouse facilities under 16/8-h light/dark cycles at 26 °C and humidity 40–70% with access to chow and water at libitum. The animal experiments conformed to the guidelines and regulatory standards of the Institutional Animal Care and Use Committee of China Agricultural University, No. AW8012020-2-3.
Histological section staining and follicle counting
For morphological analysis and fluorescent detection at the tissue level, ovarian samples were fixed in 4% paraformaldehyde (PFA, Santa Cruz, 30525-89-4) for 8 h, embedded in paraffin, and sectioned serially at 5 μm. To count the follicle number, tissue sections were stained with hematoxylin (Santa Cruz, sc-24973A). Primordial follicles were counted in every fifth section and multiplied by five to calculate the number of all primordial follicles in each ovary. The growing follicles were counted by scanning all sections and only the follicles with clear oocyte nuclei were counted to exclude the effect of residual structures after oocyte ablation in the ovaries. The number of primordial follicles and growing follicles was summed to the total number of follicles. For fluorescent detection, after deparaffinization, sections were stained with different antibodies and the Hoechst 33342 (Sigma-Aldrich, 14533) was used as a counter-stain to check the cell nucleus. The sections were sealed with an anti-fade fluorescence mounting medium (Applygen, C1210) by coverslips. High-resolution imaging of the isolated oocytes to detect the subcellular structure or protein/factor localization All high-resolution images of isolated oocytes were acquired by an Andor Dragonfly spinning-disc confocal microscope equipped with a ×63 or ×100, 1.44 N.A. oil objective, a scientific complementary metal-oxide semiconductor (sCMOS) camera (Andor Zyla 4.2), and the 405-nm (Hoe), 488-nm (mG, Alexa Fluor 488-phalloidin, and LCA-FITC) and 568-nm (mT, ER-tracker, and rhodamine) lines of the Andor Integrated Laser Engine (ILE) system with a spinning-disc confocal scan head (Andor Dragonfly 500). Images were acquired by Fusion 2.1 software ( https://andor.oxinst.com/products/dragonfly#fusion ). To detect the Oo-Mvi in oocytes, denuded oocytes at GV stages (average diameter around 65 μm) of late secondary or pre-antral follicles were collected by tearing the ovaries with syringe needle from wild type females or Oo- Rdx −/− ;mTmG females and control. The oocytes were moved with mouth pipette to ~20 μL minimum MEMα-FBS-ITS medium: essential medium α (MEMα; Gibco, 32-571-036) with 10% FBS (Gibco, 10-099-141) and 1% insulin-transferrin-selenium (ITS; Sigma-Aldrich, 13146), covered with mineral oil (Sigma-Aldrich, M8410) and photographed in a living cell workstation (Okolab) at 37 °C, 5% CO 2 . Images were typically acquired at a proper temporal interval (10 min) with an optical slice thickness of 0.5 μm and covered ~40 μm of oocytes. To observe the cortex actin of oocytes or the GC-TZPs, denuded oocytes at the GV stage (average diameter around 65 μm) were collected from fresh ovaries or GDF9-cultured ovarian pieces of Oo- Rdx +/+ and Oo- Rdx −/− females. Then the oocytes were fixed with 4% PFA in PBS for 15 min. After washing with PBS, the fixed oocytes were incubated with Alexa Fluor 488-phalloidin (1:100 dissolved in MEMα-FBS-ITS medium, ThermoFisher Scientific, A12379) with (to detect oocyte cortex) or without (to detect the GC-TZPs) 0.1% Triton X-100 for 30 min to visualize the GC-TZPs by F-actin staining as previously reported 10 , 51 . To observe the cortical granules of oocytes, Oo- Rdx +/+ and Oo- Rdx −/− oocytes at the GV stage (average diameter around 65 μm) were fixed in 4% PFA in PBS for 15 min and permeabilized in 0.5% Triton X-100 for 20 min at room temperature. Then, oocytes were blocked with 1% BSA (Sigma-Aldrich, V900933) in PBS for 1 h and incubated with LCA-FITC 2 h (1:100 dissolved in PBS, ThermoFisher Scientific, L32475 , a gift from Dr. Bo Xiong in Nanjing Agricultural University, China) at room temperature 30 . After washing with PBS, the stained oocytes were imaged by an Andor Dragonfly spinning-disc confocal microscope as previously described indexes. After the acquisition, Movies or single time-point images were processed by ImageJ ( http://rsbweb.nih.gov/ij/ ) for projection of all z-stacks and merged color channels. To clearly highlight the structures of the Oo-Mvi, the mG (488 nm) channel was inverted to black and white by ImageJ software in Fig. 1 . To show Oo-Mvi, R-GDF9, or ER of the oocyte, the rotary 3D Supplementary Movies were processed by Imaris ( https://imaris.oxinst.com/ ) software (Supplementary Movies 1 , 4 , 5 , and 6 ). To show the cellular behaviors of Oo-Mvi on oocytes, the time-lapse Supplementary Movies were processed by ImageJ software (Supplementary Movies 2 and 3 ). The detailed protocol is also available in Protocol Exchange 52 . High-resolution imaging of the ER in oocytes To observe the ER distribution of oocytes, denuded living oocytes at GV stage (average diameter around 65 μm) from fresh wild-type ovaries were incubated with ER-tracker Red (1:1000, Beyotime, C1041) for 30 min at 37 °C, 5% CO 2 32 , 33 . After washing with PBS, the stained oocytes were imaged by an Andor Dragonfly spinning-disc confocal microscope as previously described indexes. To the detection of ER fluorescent intensity of oocyte cytoplasm and bubbles, the single Z of mean ER fluorescent intensity of oocyte cytoplasm and bubbles were measured by ImageJ software.
Show full methods section
Mice
C57BL/6 mice were from the Laboratory Animal Center of the Institute of Genetics (Beijing, China). Gdf9-Cre , Foxl2-CreER T2 , and mTmG mice were generated as previously reported 23 – 25 . Foxl2-CreER T2 mice were a gift from Dr. Liu Kui. The Rdx loxP/loxP and Gdf9 −/− mice were generated using CRISPR/Cas9-mediated genome engineering by the Model Animal Research Center of Nanjing University (MARC), Nanjing BioMedical Research Institute of Nanjing University, Nanjing, China. Generally, exons 4 and 5 of the Rdx gene were selected as the targeted region to delete in the Rdx loxP/loxP mice, and the exon 2 of Gdf9 gene was deleted in the Gdf9 −/− mice. All mutant mouse strains were on the C57BL/6 background. In the Foxl2-CreER T2 ;mTmG females, upon a single injection of tamoxifen (75648, Sigma-Aldrich) at a dosage of 5 μg/kg body weight (BW) at PD8, CreER T2 recombinase-mediated recombination to label a single GC after 1 week 50 . With tamoxifen at a high dosage of 20 μg/kg BW for three injections at PD8/10/12, almost all GCs were labeled after 1 week of treatment 25 , 50 . All mice were housed in mouse facilities under 16/8-h light/dark cycles at 26 °C and humidity 40–70% with access to chow and water at libitum. The animal experiments conformed to the guidelines and regulatory standards of the Institutional Animal Care and Use Committee of China Agricultural University, No. AW8012020-2-3.
Histological section staining and follicle counting
For morphological analysis and fluorescent detection at the tissue level, ovarian samples were fixed in 4% paraformaldehyde (PFA, Santa Cruz, 30525-89-4) for 8 h, embedded in paraffin, and sectioned serially at 5 μm. To count the follicle number, tissue sections were stained with hematoxylin (Santa Cruz, sc-24973A). Primordial follicles were counted in every fifth section and multiplied by five to calculate the number of all primordial follicles in each ovary. The growing follicles were counted by scanning all sections and only the follicles with clear oocyte nuclei were counted to exclude the effect of residual structures after oocyte ablation in the ovaries. The number of primordial follicles and growing follicles was summed to the total number of follicles. For fluorescent detection, after deparaffinization, sections were stained with different antibodies and the Hoechst 33342 (Sigma-Aldrich, 14533) was used as a counter-stain to check the cell nucleus. The sections were sealed with an anti-fade fluorescence mounting medium (Applygen, C1210) by coverslips. High-resolution imaging of the isolated oocytes to detect the subcellular structure or protein/factor localization All high-resolution images of isolated oocytes were acquired by an Andor Dragonfly spinning-disc confocal microscope equipped with a ×63 or ×100, 1.44 N.A. oil objective, a scientific complementary metal-oxide semiconductor (sCMOS) camera (Andor Zyla 4.2), and the 405-nm (Hoe), 488-nm (mG, Alexa Fluor 488-phalloidin, and LCA-FITC) and 568-nm (mT, ER-tracker, and rhodamine) lines of the Andor Integrated Laser Engine (ILE) system with a spinning-disc confocal scan head (Andor Dragonfly 500). Images were acquired by Fusion 2.1 software ( https://andor.oxinst.com/products/dragonfly#fusion ). To detect the Oo-Mvi in oocytes, denuded oocytes at GV stages (average diameter around 65 μm) of late secondary or pre-antral follicles were collected by tearing the ovaries with syringe needle from wild type females or Oo- Rdx −/− ;mTmG females and control. The oocytes were moved with mouth pipette to ~20 μL minimum MEMα-FBS-ITS medium: essential medium α (MEMα; Gibco, 32-571-036) with 10% FBS (Gibco, 10-099-141) and 1% insulin-transferrin-selenium (ITS; Sigma-Aldrich, 13146), covered with mineral oil (Sigma-Aldrich, M8410) and photographed in a living cell workstation (Okolab) at 37 °C, 5% CO 2 . Images were typically acquired at a proper temporal interval (10 min) with an optical slice thickness of 0.5 μm and covered ~40 μm of oocytes. To observe the cortex actin of oocytes or the GC-TZPs, denuded oocytes at the GV stage (average diameter around 65 μm) were collected from fresh ovaries or GDF9-cultured ovarian pieces of Oo- Rdx +/+ and Oo- Rdx −/− females. Then the oocytes were fixed with 4% PFA in PBS for 15 min. After washing with PBS, the fixed oocytes were incubated with Alexa Fluor 488-phalloidin (1:100 dissolved in MEMα-FBS-ITS medium, ThermoFisher Scientific, A12379) with (to detect oocyte cortex) or without (to detect the GC-TZPs) 0.1% Triton X-100 for 30 min to visualize the GC-TZPs by F-actin staining as previously reported 10 , 51 . To observe the cortical granules of oocytes, Oo- Rdx +/+ and Oo- Rdx −/− oocytes at the GV stage (average diameter around 65 μm) were fixed in 4% PFA in PBS for 15 min and permeabilized in 0.5% Triton X-100 for 20 min at room temperature. Then, oocytes were blocked with 1% BSA (Sigma-Aldrich, V900933) in PBS for 1 h and incubated with LCA-FITC 2 h (1:100 dissolved in PBS, ThermoFisher Scientific, L32475 , a gift from Dr. Bo Xiong in Nanjing Agricultural University, China) at room temperature 30 . After washing with PBS, the stained oocytes were imaged by an Andor Dragonfly spinning-disc confocal microscope as previously described indexes. After the acquisition, Movies or single time-point images were processed by ImageJ ( http://rsbweb.nih.gov/ij/ ) for projection of all z-stacks and merged color channels. To clearly highlight the structures of the Oo-Mvi, the mG (488 nm) channel was inverted to black and white by ImageJ software in Fig. 1 . To show Oo-Mvi, R-GDF9, or ER of the oocyte, the rotary 3D Supplementary Movies were processed by Imaris ( https://imaris.oxinst.com/ ) software (Supplementary Movies 1 , 4 , 5 , and 6 ). To show the cellular behaviors of Oo-Mvi on oocytes, the time-lapse Supplementary Movies were processed by ImageJ software (Supplementary Movies 2 and 3 ). The detailed protocol is also available in Protocol Exchange 52 . High-resolution imaging of the ER in oocytes To observe the ER distribution of oocytes, denuded living oocytes at GV stage (average diameter around 65 μm) from fresh wild-type ovaries were incubated with ER-tracker Red (1:1000, Beyotime, C1041) for 30 min at 37 °C, 5% CO 2 32 , 33 . After washing with PBS, the stained oocytes were imaged by an Andor Dragonfly spinning-disc confocal microscope as previously described indexes. To the detection of ER fluorescent intensity of oocyte cytoplasm and bubbles, the single Z of mean ER fluorescent intensity of oocyte cytoplasm and bubbles were measured by ImageJ software.
Immunofluorescence staining and observation
The ovarian sections were deparaffinized, rehydrated, and subjected to high-temperature (95–98 °C) antigen retrieval for 16 min with 0.01% sodium citrate buffer (pH 6.0). The sections were then blocked with 10% normal donkey serum (Jackson ImmunoResearch, 017-000-121) for 60 min at room temperature and incubated with primary antibodies overnight at 4 °C. Subsequently, the sections were incubated with fluorophore-conjugated donkey secondary antibodies (1:200, Life Technologies) for 2 h at 37 °C. The homologous IgG (Goat, normal control, A7007, Beyotime) with the primary antibodies were used to be the negative control to guarantee the specificity of staining. To detect ERM family or GDF9 protein expression in the ovary, we incubated sections with the following primary antibodies: the anti-RDX antibody (rabbit, 1:100, ab52495, Abcam), anti-p-ERM antibody (rabbit, 1:100, mAb#3726, Cell Signaling Technologies), anti-EZRIN antibody (rabbit, 1:100, ab4069, Abcam), anti-MOESIN antibody (rabbit, 1:100, ab52490, Abcam), and anti-GDF9 antibody (goat, 1:50, AF739, R&D). Cell proliferation of GCs was assessed by staining with the anti-proliferating cell nuclear antigen (PCNA) antibody (mouse, 1:100, Santa Cruz, sc-25280). The percentage of PCNA-positive GCs was quantified as the number of GCs with PCNA-positive signals divided by the total number of GCs in primary follicles and secondary follicles. Cell apoptosis was detected by TUNEL staining (In Situ Cell Death Detection Kit, Fluorescein, Roche, 11684795910). The percentage of TUNEL-positive follicles was quantified as the number of follicles with TUNEL-positive signal divided by the total number of follicles in the primary and secondary stages. All general morphologies were examined and photographed by a Nikon Eclipse Ti digital fluorescence microscope. For the high-resolution detections of GDF9, the co-localization of GDF9 with vesicles of Oo-Mvi was acquired as a z -stack model with an optical slice thickness of 0.3 μm after co-staining of GDF9 and RDX (to label Oo-Mvi), and confocal sections covered ~8 μm tissue thickness. Both the IgG and the ovarian sections from G df9 −/− females were used as the negative control to guarantee the specificity of staining. The images were acquired by an Andor Dragonfly spinning-disc confocal microscope equipped with a ×100, 1.44 N.A. oil objective (Leica HC PL APO), a scientific complementary metal-oxide semiconductor (sCMOS) camera (Andor Zyla 4.2), and the 488-nm (anti-RDX, Oo-Mvi) and 568-nm (anti-GDF9 and IgG) lines of the Andor Integrated Laser Engine (ILE) system with a spinning-disc confocal scan head (Andor Dragonfly 500). In detail, images were acquired with laser 488-nm and laser 568-nm around 10–15%, exposure time 100–200 ms. Images were acquired by Fusion 2.1 software ( https://andor.oxinst.com/products/dragonfly#fusion ). After the acquisition, images were processed by ImageJ ( http://rsbweb.nih.gov/ij/ ) for projection of all z -stacks and merged color channels.
ZP collection and MS analysis
To collect empty ZP from oocytes, C57BL/6 mice at PD23 with 5 IU of pregnant mare serum gonadotropin (PMSG; Sansheng Biological Technology) for 46 h and the ovaries were punctured to obtain cumulus-oocyte complexes. The cumulus cells were digested with 0.3% hyaluronidase medium (Merck, MR-051-F) to obtain denuded oocytes, which were then incubated with 10% high osmotic glucose solution to separate the ZP and the oocyte. Under the microinjection system, the ZP was torn to release the oocyte, and then the empty ZP was collected. The protein (~5 μg) from ~3000 pieces of ZP was extracted by RIPA extraction buffer for a single protein MS assay, which was repeated three times. Protein digestion was performed using the filter-aided sample preparation (FASP) method with modifications as previously described 53 , 54 . Nanospray electrospray (ESI)-MS was performed on a Thermo Q-Exactive high-resolution mass spectrometer (Thermo Scientific) with a 70,000 MS scan resolution, 17,500 MS/MS scan resolution, and top-10 MS/MS selection. Raw data from the mass spectrometer were preprocessed with Mascot Distiller 2.4 for peak picking. The resulting peak lists were searched against the Uniport Mouse database using the Mascot 2.5 search engine. Scaffold PTM was used to evaluate phosphorylation sites of the Mascot search results using the Ascore algorithm.
Mouse fertility and ovulation analysis
To detect mouse fertility, 5-week-old female Oo- Rdx −/− mice and control mice were continuously mated with 8-week-old C57BL/6 fertile males for 40 weeks. The numbers of pups and litters were recorded, from which fertility rates were determined. For superovulation, Oo- Rdx −/− and control mice (PD23) were intraperitoneally injected with 5 IU of PMSG, (Sansheng Biological Technology, Ningbo, China) followed by 5 IU human chronic gonadotropin (hCG, Sansheng Biological Technology, Ningbo, China) 46 h later. After an additional 16 h, oocytes were collected from oviducts, and the numbers of oocytes for each animal were counted after digestion with 0.3% hyaluronidase (Merck, MR-051-F). In vitro culture of ovarian cortical pieces The in vitro attached culture of ovarian pieces was modified from the method in the previous study 55 . In details, ovarian cortical pieces from Oo- Rdx +/+ ;mTmG and Oo- Rdx −/− ;mTmG ovaries at PD4 (oocyte diameter tracing experiment) were cut into approximately 2 × 1 × 0.5 mm 3 pieces and cultured in MEMα (Gibco, 32-571-036) supplemented with 10% FBS (Gibco, 10-099-141). After 4 days of adherent culture without changing the medium, the cortical pieces were attached firmly to the bottom of dishes for the experiments, and then the culture media was half-changed every day to maintain the development of tissues. In the experiment of oocyte diameter tracing, the developmental dynamics of oocytes were measured by the increase of the diameter, which was labeled by mG in Oo- Rdx +/+ ;mTmG and Oo- Rdx −/− ;mTmG ovaries. The diameter changes were recorded with a Nikon Eclipse Ti digital fluorescence microscope every other day for 7 continuous days. To ensure the detected oocytes were in a fast growth period, the oocytes with an initial diameter of around 16–35 μm were traced in this experiment. To compare the developmental dynamics of oocytes with different initial diameter, we normalized the actual diameters to the growth ratio to show the dynamics change of oocyte growth in different groups. Totally 151 oocytes from 27 cortical pieces in Oo- Rdx +/+ ;mTmG and 250 oocytes from 21 cortical pieces in Oo- Rdx −/− ;mTmG ovaries were traced. In the GDF9-supplying experiment, Oo- Rdx +/+ and Oo- Rdx −/− ovaries at PD21 (GDF9-supplying experiment) were cut to approximately 2 × 1 × 0.5 mm 3 pieces and cultured in MEMα supplemented with 10% FBS, with or without GDF9 (500 ng/mL, R&D, 739-G9-010/CF) for 24 h, and the oocytes (average diameter around 65 μm at GV stages) were collected by tearing the ovaries with a syringe needle and digested with 0.3% hyaluronidase medium to be used for the detection of GC-TZP density. In vitro culture of ovarian follicles Follicles were separated by tearing PD21 ovaries and mechanical isolation with a syringe needle. The follicles with the diameter of around 130 μm (average diameter: 134.72 ± 13.73 μm in Oo- Rdx +/+ , n = 64 and 129.73 ± 20.21 μm in Oo- Rdx −/− , n = 77) were used in the experiments. To monitor the growth of follicles, the isolated follicles were cultured in a Matrigel (BD, 354234) culture system to support a 3D development of follicles, which was modified from previously described 56 – 58 . Generally, the Matrigel was 3:1 diluted with pre-cooling MEMα-FBS-ITS medium-plus follicle-stimulating hormone (ovine FSH, 10 ng/mL, NHPP) on ice. Add 20 μL Matrigel/microdroplet in the 6 well culture plate and 6 microdroplets every well on ice keeping the gel in liquid. Put the 6 well culture plate at 37 °C for 20 min to trans Matrigel from the liquid phase to solid. Then, the isolated follicles were gently seeded into the gel with a mouse pipette, respectively. Adding the 2 μL liquid Matrigel to seal the hole and put the plate into the incubator at 37 °C for 10 min to make the gel sealed. After this step, the cultured follicles were completely surrounded by the gel. The density of seeding was around 1.6 per cm 2 to guarantee sufficient space for growth. Supplemented 1 mL MEMα-FBS-ITS medium-plus follicle-stimulating hormone (ovine FSH, 10 ng/mL, NHPP) into the culture plate. During culture, the media was half-changed every day, and the diameter of follicles was recorded every 24 h for 8 continuous days by a Nikon Eclipse Ti digital fluorescence microscope in a bright field channel. The detailed protocol is also available in Protocol Exchange 59 . Rhodamine-conjugated GDF9 and living oocyte injection Recombinant GDF9 protein (50 μg/mL, R&D, 739-G9-010/CF) or BSA (50 μg/mL, Sigma-Aldrich, V900933) as a control were labeled with rhodamine using the Pierce NHS-rhodamine antibody labeling kit (53031, ThermoFisher) according to the manufacturer’s protocol 60 . To collect the oocytes, the COCs were isolated by puncturing the antral follicles from C57BL/6 mice at PD23 after 46 h of PMSG treatment (5 IU, i.p. injection). After treated with 0.3% hyaluronidase (Merck, MR-051-F) in medium, denuded oocytes were performed microinjection, and approximately 10 pL of labeled protein or rhodamine solution were injected into one oocyte with a FemtoJet 4× electric microinjector (Eppendorf). After 15 or 30 min of injections, the oocyte was imaged under an Andor Dragonfly spinning-disc confocal microscope with the previously described indexes.
Gene expression analysis
To detect gene expression in mouse materials, the mRNA from different tissues or ovary compartments was extracted by TRIZOL Reagent (Thermo-Ambion, 15596018) according to the manufacturer’s protocol. The quantity and quality of the total RNA were determined using a Nanodrop (Thermo Scientific). Reverse transcription (TAKARA, RR047Q) was performed using 1 μg total RNA per sample. QRT-PCR reactions were performed in 96-well plates (Applied Biosystems, 4316813) in 15 μL reaction volumes and analyzed by an Applied Biosystems 7500 Real-Time PCR System (Applied Biosystems, 4472908) using the following parameters: 10 min at 95 °C, followed by 40 cycles of 15 s at 95 °C and 1 min at 60 °C. Data were normalized to β-actin. The primer list is provided in Supplementary Table 1 .
Western blot
To detect protein expression in mouse materials, total proteins were extracted using WIP Tissue and Cell lysis solution (BioChip, 110000) according to the manufacturer’s protocol. Electrophoresis was performed with 50 μg total proteins separated by 10% SDS-PAGE and transferred to polyvinylidene fluoride membranes (Millipore, ISEQ00005). The membranes were incubated overnight at 4 °C with the appropriate primary antibodies listed below: anti-RDX (78 kDa, 1:500, ab52495, Abcam), anti-p-ERM (78 kDa, 1:500, mAb#3726, Cell Signaling Technologies). The appropriate secondary antibody (ZB-2301, ZB-2305 from ZSGB-BIO) was diluted 1:5000 in TBST (TBS plus 0.5% Tween 20). Tubulin (1:5000, Beyotime, AF5012) was used as an internal control. The membranes were visualized using the SuperSignal chemiluminescent detection system (Thermo Scientific, 32109). Original blots can be found in the Source data file.
Statistical analysis
All experiments were repeated at least three times using different mice. Data are presented as the mean ± standard deviation (SD) of each experiment. Data were analyzed by Student’s t -test and were considered statistically significant at P < 0.05. P is indicated as follows: *( P < 0.05), **( P < 0.01), ***( P < 0.001), and n.s. (not significant, P ≥ 0.05). Statistics and graphs were obtained using Prism 5 (GraphPad Software, La Jolla).
Supplementary information Supplementary Information Supplementary Movie 1 Supplementary Movie 2 Supplementary Movie 3 Supplementary Movie 4 Supplementary Movie 5 Supplementary Movie 6 Description of Additional Supplementary Files Peer Review File
📊 Figures
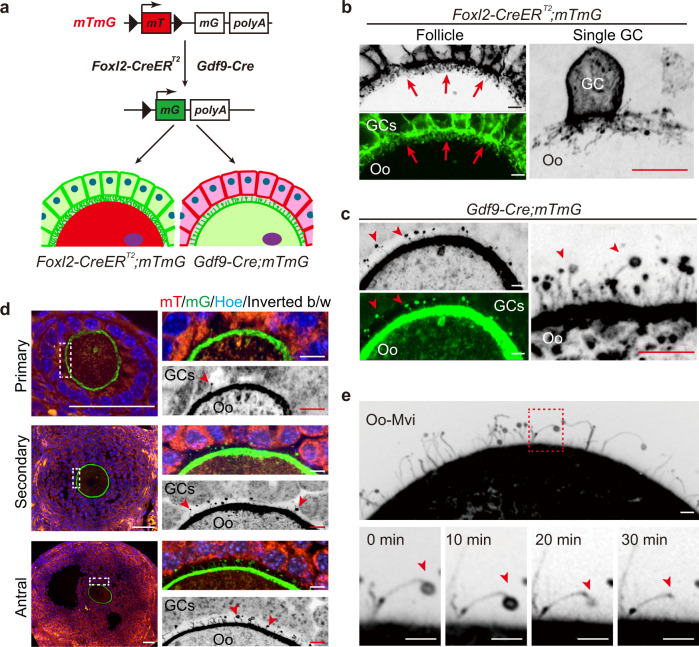
Fig. 1
Imaging cell-specific communicating structures in the ZP by endogenous-fluorescent labeling in follicles.
a Illustration of the strategy to label the derivation of the cellular communicating structures in the ZP by cellular specifically expressed CreER T2 or Cre recombinase. Membrane-localized red-fluores...
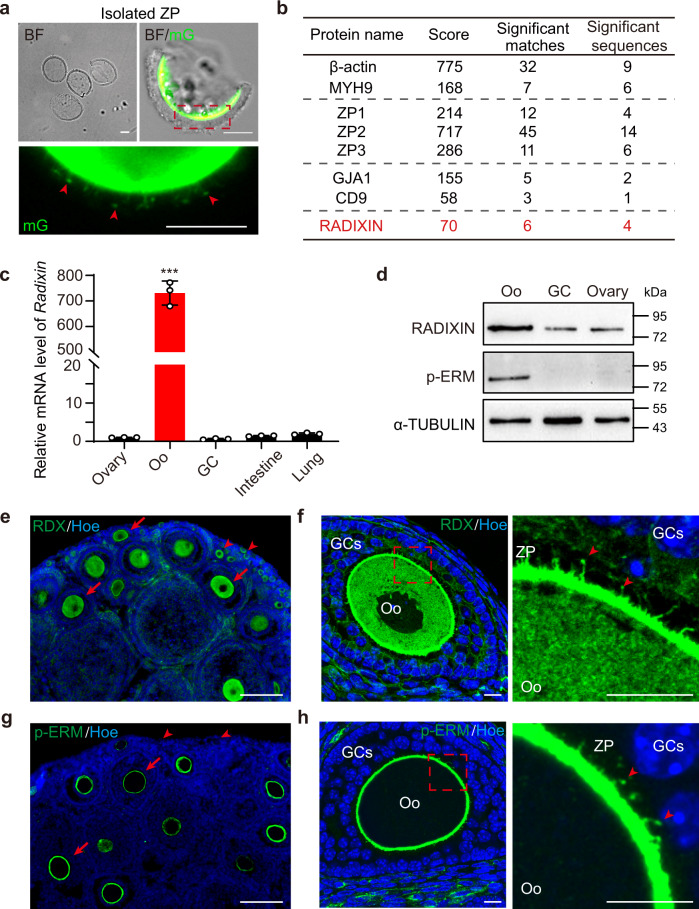
Fig. 2
The microvilli-related protein RDX was specifically expressed in oocytes.
a Isolated ZP from Gdf9-Cre;mTmG oocytes with Oo-Mvi (arrowheads) kept in the samples for MS analysis. b MS analysis revealing the expression of RDX in the isolated ZP. c Relative mRNA levels of Rdx i...
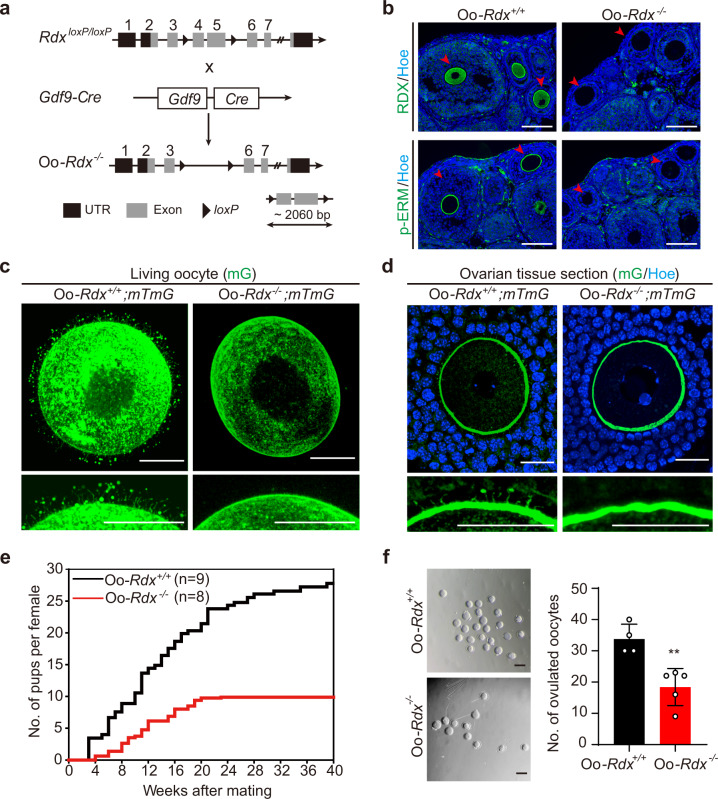
Fig. 3
Deletion of Rdx in oocytes led to a failure of Oo-Mvi formation and shortened reproductive lifespan in females.
a Schematic representation of the deletion of Rdx exons 4 and 5 by Gdf9-Cre -mediated recombination in oocytes of Oo -Rdx u2212/u2212 . b Immunofluorescence detection of RDX and p-ERM showing successf...
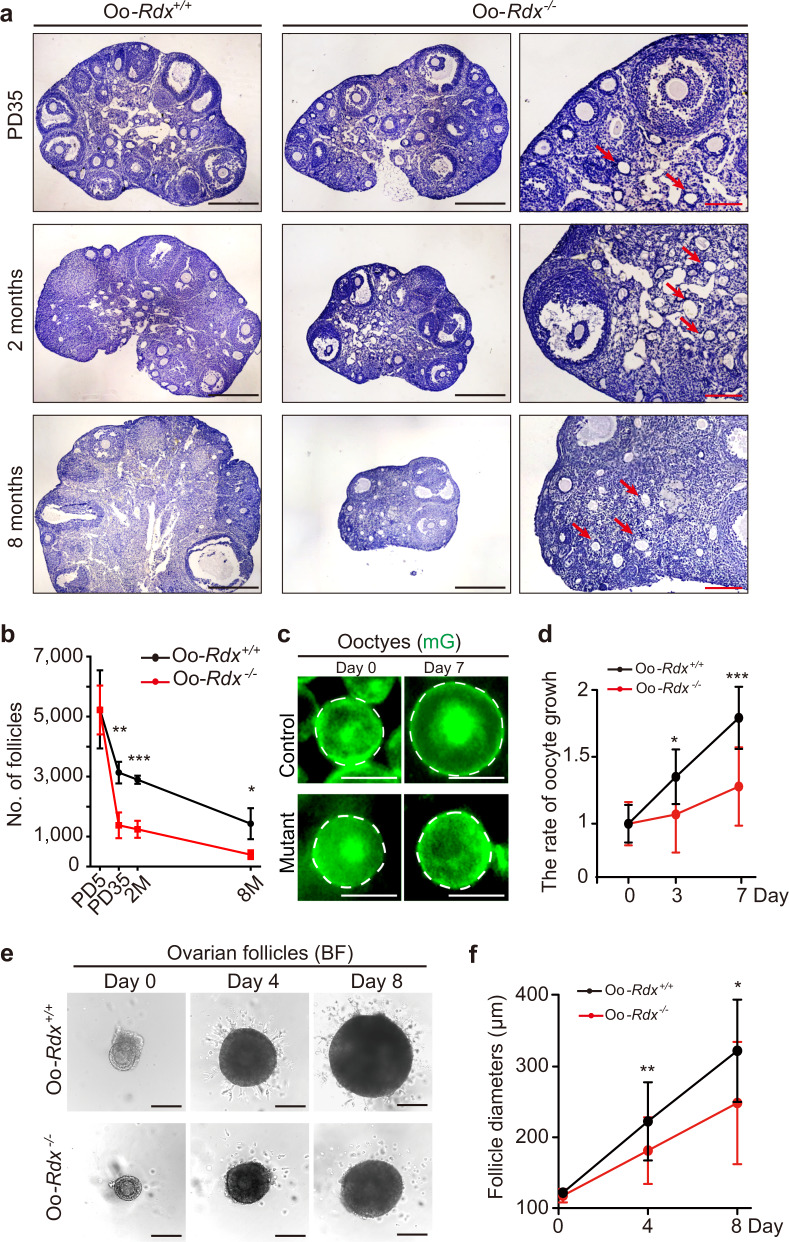
Fig. 4
The failure of Oo-Mvi formation in Oo- Rdx u2212/u2212 females led to abnormal folliculogenesis.
a Histological analysis of the ovarian morphological changes in Oo -Rdx u2212/u2212 females, showing a decrease in ovarian size and an increase in follicle death (arrows) in the mutant ovaries. b Foll...
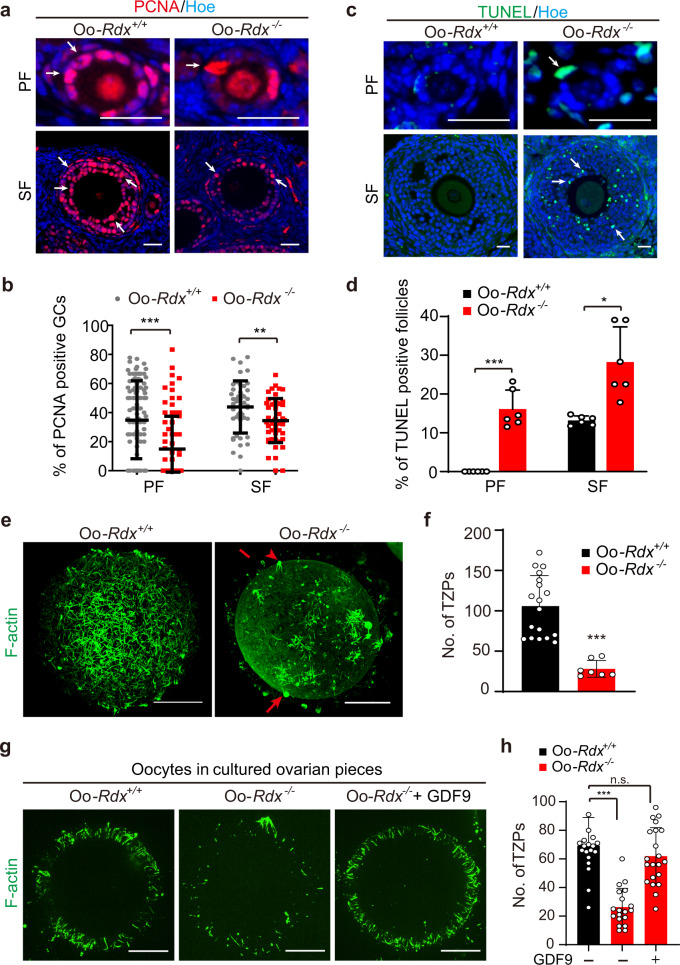
Fig. 5
Loss of Oo-Mvi disrupted OSF-regulated GC development.
a , b PCNA staining (arrows) of GC proliferation ( a ), showing a significant decrease in GC proliferation in the early growing follicles of Oo- Rdx u2212/u2212 ovaries ( b ). Each point represents th...
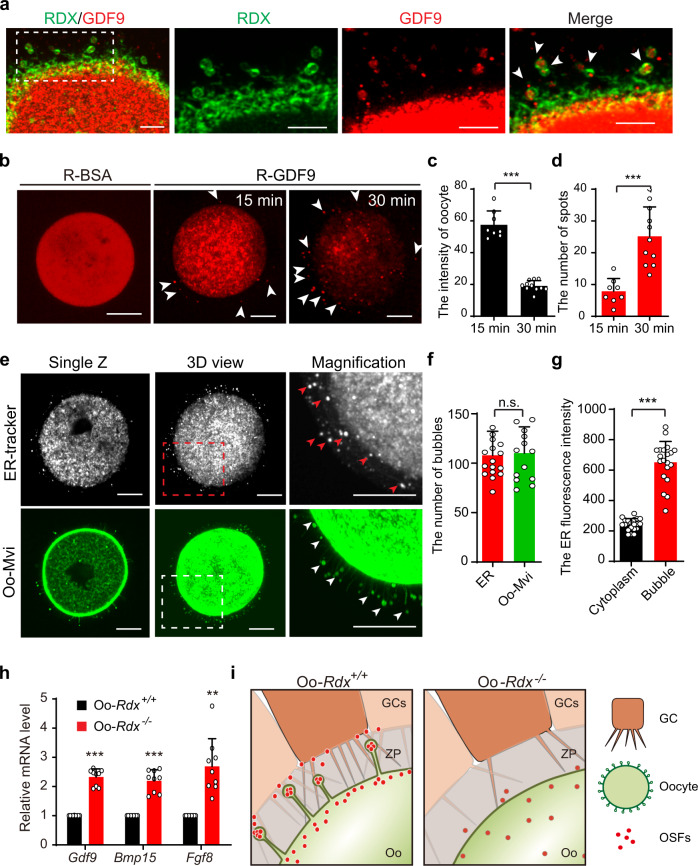
Fig. 6
OSFs were enriched in Oo-Mvi to manipulate the development of follicles.
a GDF9 was localized in the vesicles of Oo-Mvi. Immunostaining showing GDF9 protein (Red, arrowheads) localized in the oocytes and the vesicles of Oo-Mvi (Green, RDX). n =u200929 ovarian follicles. b ...
Figure images are served from the NIH/NLM PubMed Central Open Access Subset or Europe PMC; copyright remains with the publishers and authors.
💬 Discussion
0 commentsNo comments yet. Be the first to start a discussion!
Leave a Comment