Abstract
Projections from the nucleus accumbens to the ventral pallidum (VP) regulate relapse in animal models of addiction. The VP contains GABAergic (VPGABA) and glutamatergic (VPGlu) neurons, and a subpopulation of GABAergic neurons co-express enkephalin (VPPenk). Rabies tracing reveals that VPGlu and VPPenk neurons receive preferential innervation from upstream D1- relative to D2-expressing accumbens neurons. Chemogenetic stimulation of VPGlu neurons inhibits, whereas stimulation of VPGABA and VPPenk neurons potentiates cocaine seeking in mice withdrawn from intravenous cocaine self-administration. Calcium imaging reveals cell type-specific activity patterns when animals learn to suppress drug seeking during extinction training versus engaging in cue-induced cocaine seeking. During cued seeking, VPGABA neurons increase their overall activity, and VPPenk neurons are selectively activated around nose pokes for cocaine. In contrast, VPGlu neurons increase their spike rate following extinction training. These data show that VP subpopulations differentially encode and regulate cocaine seeking, with VPPenk and VPGABA neurons facilitating and VPGlu neurons inhibiting cocaine seeking.
🔬 Techniques
🔭 Microscopes
✨ Fluorophores
🧪 Sample Preparation
🏭 Microscope Brands
🧪 Reagent Suppliers
💻 Software Details
🏷️ Research Resource Identifiers (RRIDs)
Verified research resources used in this paper:
🏛️ Research Organizations (ROR)
Affiliated research institutions:
📋 Methods
LEAD CONTACT AND MATERIALS AVAILABILITY
This study did not generate new unique reagents. Further information and requests for resources and reagents should be directed to and will be fulfilled by the Lead Contact, Peter Kalivas ( kalivasp@musc.edu ) EXPERIMENTAL MODEL AND SUBJECT DETAILS Animals Male and female transgenic mice were bred at Medical University of South Carolina (MUSC) and every other generation new mice were introduced into the colonies to prevent inbreeding (Vglut2-IRES-Cre, Vgat-IRES-Cre, Penk-IRES-Cre, JAX laboratories; Drd2-eGFP mice gifted by the GENSET program at Rockefeller University) ( Gerfen et al., 2013 ; Gong et al., 2003 ; Harris et al., 2014 ; Madisen et al., 2010 ; Vong et al., 2011 ) For anatomical tracing and electrophysiological studies Vglut2-IRES-Cre, Vgat-IRES-Cre and Penk-IRES-Cre were crossed with Drd2-eGFP lines. All mice were housed on a reverse day light cycle, and provided with access to food and water ad libitum until the start of experiments. All experiments were conducted in accordance with the National Institute of Health’s Guidelines for the care and use of laboratory animals and approved by the Institutional Animal Care and Use Committee at MUSC. METHOD DETAILS Catheter surgery and Chemogenetics Mice were implanted with a chronic jugular vein catheter as described previously ( Heinsbroek et al., 2017 ; Smith et al., 2017 ) and infused (~200 nL over 10 min) into the VP (AP: 0.4, ML: 1.4, DV: −5) with the following AAV vectors: AAV2-hSyn-hM3D-HA-mCitrine (University of North Carolina vector core); AAV2-hSyn-DIO-hM3D-mCherry (Addgene). Cre dependent vectors were validated in wild-type mice to test for non-specific expression, and virus was given at least 3 weeks of expression before behavioral tests were conducted.
Show full methods section
LEAD CONTACT AND MATERIALS AVAILABILITY
This study did not generate new unique reagents. Further information and requests for resources and reagents should be directed to and will be fulfilled by the Lead Contact, Peter Kalivas ( kalivasp@musc.edu ) EXPERIMENTAL MODEL AND SUBJECT DETAILS Animals Male and female transgenic mice were bred at Medical University of South Carolina (MUSC) and every other generation new mice were introduced into the colonies to prevent inbreeding (Vglut2-IRES-Cre, Vgat-IRES-Cre, Penk-IRES-Cre, JAX laboratories; Drd2-eGFP mice gifted by the GENSET program at Rockefeller University) ( Gerfen et al., 2013 ; Gong et al., 2003 ; Harris et al., 2014 ; Madisen et al., 2010 ; Vong et al., 2011 ) For anatomical tracing and electrophysiological studies Vglut2-IRES-Cre, Vgat-IRES-Cre and Penk-IRES-Cre were crossed with Drd2-eGFP lines. All mice were housed on a reverse day light cycle, and provided with access to food and water ad libitum until the start of experiments. All experiments were conducted in accordance with the National Institute of Health’s Guidelines for the care and use of laboratory animals and approved by the Institutional Animal Care and Use Committee at MUSC. METHOD DETAILS Catheter surgery and Chemogenetics Mice were implanted with a chronic jugular vein catheter as described previously ( Heinsbroek et al., 2017 ; Smith et al., 2017 ) and infused (~200 nL over 10 min) into the VP (AP: 0.4, ML: 1.4, DV: −5) with the following AAV vectors: AAV2-hSyn-hM3D-HA-mCitrine (University of North Carolina vector core); AAV2-hSyn-DIO-hM3D-mCherry (Addgene). Cre dependent vectors were validated in wild-type mice to test for non-specific expression, and virus was given at least 3 weeks of expression before behavioral tests were conducted.
Self-administration training and testing
Three to four days after surgery, mice were food deprived overnight and trained to self-administer cocaine (0.75 mg/kg/infusion; FR1 schedule of reinforcement) for 12 days, during which operant responses for cocaine were paired with the presentation of a compound cue (tone + light). Throughout self-administration catheter patency was assessed periodically using the intravenous infusion of the short acting barbiturate Brevital. Afterward, mice underwent 7 days of home cage abstinence, followed by at least 10 days of extinction training with neither cocaine nor cocaine-associated cues present, followed by cue seeking tests (see: Figure 2A for experimental timeline). During cue-induced cue seeking tests, conditioned cues were returned to every active operant response to stimulate cocaine seeking. During extinction tests, cue seeking was induced by chemogenetic stimulation of the different populations of VP neurons during a regular extinction session. Across all studies approximately 70% of the mice successfully completed self-administration and extinction training. In vivo Ca 2+ imaging Mice were injected with the Cre dependent genetically encoded Ca 2+ indicator gCaMP6f (AAV1-hSyn-DIO-gCaMP6f; titer: ~1*10 13 GC/ml; University of Pennsylvania vector core and Addgene) into the VP, followed by the implantation of a GRIN lens (7.3 mm by 0.6 mm; Inscopix) above the VP. Mice were allowed to recover for 3 weeks, and underwent a second surgery during which a base-plate was installed for miniature microscope attachment. Videos of Ca 2+ mediated fluorescence changes in individual neurons were acquired using a miniature microscope system and acquisition software (nVista, Inscopix). Videos were recorded at a 15 Hz framerate under constant low light illumination < 1 mW. Data files were decompressed, downsampled by a special factor of four, motion corrected using a rigid body translation algorithm (TurboReg), and ΔF/F normalized (Mosaic, Inscopix). Afterward, temporal and spatial components were extracted using principal/independent component analysis (PCA/ICA). The quality of individual temporal and spatial components was examined manually for each cell using Mosaic software (Inscopix). Changes in Ca 2+ fluorescence around behaviorally meaningful events (nose-pokes for cocaine) and the frequency and amplitude of Ca 2+ transients (Ca 2+ events) were analyzed separately. Ca 2+ events were identified using a peak-finder algorithm (Mosaic, Inscopix) and frequency (spikes/min) and amplitude (a.u.) data were processed using custom-written code in MATLAB (Mathworks). Monosynaptic retrograde rabies tracing For cell-type specific monosynaptic retrograde rabies tracing, D2-eGFP x Cre recombinase expressing double transgenic mice were injected with a cocktail of Cre dependent helper viruses mixed in 1:1 ratio (AAV2-Ef1a-DIO-GT, titer: 4.4*10 12 GC/ml, Salk vector core; AAV8-CA-DIO-RG, titer: 2.5*10 12 GC/ml, UNC Vector core). Three weeks later mice were injected with G-Deleted EnvA pseudotyped replication deficient Rabies SADΔG-B19-mCherry (Salk vector core, titer: 2.7*10 8 TU/ml). Ten days after rabies injection, animals were perfused for histology.
Histology
Mice were deeply anesthetized with isoflurane, and transcardially perfused with ice-cold saline followed by 10% formalin. Immunostaining was performed using primary antibodies against GFP (1:500; Abcam ab13970; RRID:AB_300798), mCherry (1:20k; LS-C204825; RRID:AB_2716246), dsRed (1:1000; Clontech #632496; RRID:AB_10013483), substance P (1:1000, Immunostar #20064, RRID:AB_572266), and Ser32-phospho-cFos (1:2000, Cell signaling #5348; RRID:AB_10557109), as well as Alexa-conjugated secondary antibodies (Invitrogen, 1:500). Cell counting and co-localization studies were performed using the cell counting plugin in ImageJ (NIH). For immunohistochemical validation of DREADD function, mice were injected with CNO or vehicle 2 h prior to perfusion. In situ hybridization Wild-type C57BL/6J mice were euthanized, and brains were rapidly extracted and flash frozen in isopentane solution on dry ice. Brains slices (15 μm) were stained for mRNA expression using the RNAscope in situ hybridization protocol (ACDbio) based on manufacturer recommendations, without epitope retrieval or protease pretreatment steps. Images were taken using a Zeiss LSM880 confocal microscope at 40x and cell counts and co-localization analyses were performed in ImageJ using the Cellcounter plugin (NIH). QUANTIFICATION AND STATISTICAL ANALYSIS Ca 2+ imaging data analysis Changes in Ca 2+ fluorescence around active nose-pokes were analyzed as described previously ( Jennings et al., 2015 ). Fluorescent signals from each cell were binned (window: −10 s before to 20 s after response) during Ext1 or Reinst sessions in MATLAB, smoothened (using a running 10-point moving average filter) and normalized (zscore) to the average activity for each trace within that window. Ca 2+ activity was then averaged across all trials (nose-pokes) within a session for each cell. During extinction, only nose-pokes separated by at least 20 s from each other were used in analyses to prevent cross-contamination of signals between responses. During cued seeking, only nose-pokes occurring outside of the 20 s time-out between cue presentations (e.g., only cued nose-pokes) were evaluated. For the analysis of changes in population activity around nose-pokes, Ca 2+ fluorescence signals were transformed to absolute values to incorporate both increased and decreased responses ( Moorman and Aston-Jones, 2015 ). To quantify the population response magnitude, average Ca 2+ activity was compared before (−2 to 0 s) and after (0 to 2 s) a nose-poke for each cell. To calculate the proportion of cells with increased or decreased responses to nose-pokes, non-absolute transformed Ca 2+ signals within these same time-windows were compared and significantly modulated cells were defined as having average activity > 2 s.d. higher (increased) or > 2 s.d. lower than baseline prior to a nose-poke.
Histology clustering analysis
To investigate whether the different neuronal populations were organized as clusters or randomly distributed throughout the VP, we used a k-nearest neighbor algorithm (k = 10) on the centroids (ImageJ Cellcounter) of neurons identified by either virus expression (in Cre mouse lines) or in situ hybridization for the different VP cell markers. The k-nearest neighbor value (Euclidian distance) for all cells was compared to the k-nearest neighbor values of a shuffled dataset (containing the same number of randomly distributed datapoints, and repeated 1000 times).
Statistics
All data are presented as mean ± sem. Statistical analyses were performed using Prism (Graphpad; version 6.2). Paired Student’s t tests were used for extinction tests. One sample t tests were used for clustering analyses. One-way and two-way repeated-measures analysis of variance (RM-ANOVA) with Greenhouse-Geisser correction and Neumann-Keuls post hoc tests were used for cue seeking tests and Ca 2+ event rate and amplitude comparisons as specified in the results. Chi-square tests with Bonferroni correction for repeated-measures was used for rabies tracing data and Ca 2+ population fraction comparisons. Statistical significance was set at 0.05.
DATA AND CODE AVAILABILITY
The published article includes all data generated or analyzed during this study. MATLAB code written by J.A.H. was used to process and analyze all calcium imaging datasets. Code, and data are openly available upon request.
LEAD CONTACT AND MATERIALS AVAILABILITY
This study did not generate new unique reagents. Further information and requests for resources and reagents should be directed to and will be fulfilled by the Lead Contact, Peter Kalivas ( kalivasp@musc.edu )
EXPERIMENTAL MODEL AND SUBJECT DETAILS Animals
Male and female transgenic mice were bred at Medical University of South Carolina (MUSC) and every other generation new mice were introduced into the colonies to prevent inbreeding (Vglut2-IRES-Cre, Vgat-IRES-Cre, Penk-IRES-Cre, JAX laboratories; Drd2-eGFP mice gifted by the GENSET program at Rockefeller University) ( Gerfen et al., 2013 ; Gong et al., 2003 ; Harris et al., 2014 ; Madisen et al., 2010 ; Vong et al., 2011 ) For anatomical tracing and electrophysiological studies Vglut2-IRES-Cre, Vgat-IRES-Cre and Penk-IRES-Cre were crossed with Drd2-eGFP lines. All mice were housed on a reverse day light cycle, and provided with access to food and water ad libitum until the start of experiments. All experiments were conducted in accordance with the National Institute of Health’s Guidelines for the care and use of laboratory animals and approved by the Institutional Animal Care and Use Committee at MUSC.
METHOD DETAILS Catheter surgery and Chemogenetics Mice were implanted with a chronic jugular vein catheter as described previously ( Heinsbroek et al., 2017 ; Smith et al., 2017 ) and infused (~200 nL over 10 min) into the VP (AP: 0.4, ML: 1.4, DV: −5) with the following AAV vectors: AAV2-hSyn-hM3D-HA-mCitrine (University of North Carolina vector core); AAV2-hSyn-DIO-hM3D-mCherry (Addgene). Cre dependent vectors were validated in wild-type mice to test for non-specific expression, and virus was given at least 3 weeks of expression before behavioral tests were conducted.
Self-administration training and testing
Three to four days after surgery, mice were food deprived overnight and trained to self-administer cocaine (0.75 mg/kg/infusion; FR1 schedule of reinforcement) for 12 days, during which operant responses for cocaine were paired with the presentation of a compound cue (tone + light). Throughout self-administration catheter patency was assessed periodically using the intravenous infusion of the short acting barbiturate Brevital. Afterward, mice underwent 7 days of home cage abstinence, followed by at least 10 days of extinction training with neither cocaine nor cocaine-associated cues present, followed by cue seeking tests (see: Figure 2A for experimental timeline). During cue-induced cue seeking tests, conditioned cues were returned to every active operant response to stimulate cocaine seeking. During extinction tests, cue seeking was induced by chemogenetic stimulation of the different populations of VP neurons during a regular extinction session. Across all studies approximately 70% of the mice successfully completed self-administration and extinction training. In vivo Ca 2+ imaging Mice were injected with the Cre dependent genetically encoded Ca 2+ indicator gCaMP6f (AAV1-hSyn-DIO-gCaMP6f; titer: ~1*10 13 GC/ml; University of Pennsylvania vector core and Addgene) into the VP, followed by the implantation of a GRIN lens (7.3 mm by 0.6 mm; Inscopix) above the VP. Mice were allowed to recover for 3 weeks, and underwent a second surgery during which a base-plate was installed for miniature microscope attachment. Videos of Ca 2+ mediated fluorescence changes in individual neurons were acquired using a miniature microscope system and acquisition software (nVista, Inscopix). Videos were recorded at a 15 Hz framerate under constant low light illumination < 1 mW. Data files were decompressed, downsampled by a special factor of four, motion corrected using a rigid body translation algorithm (TurboReg), and ΔF/F normalized (Mosaic, Inscopix). Afterward, temporal and spatial components were extracted using principal/independent component analysis (PCA/ICA). The quality of individual temporal and spatial components was examined manually for each cell using Mosaic software (Inscopix). Changes in Ca 2+ fluorescence around behaviorally meaningful events (nose-pokes for cocaine) and the frequency and amplitude of Ca 2+ transients (Ca 2+ events) were analyzed separately. Ca 2+ events were identified using a peak-finder algorithm (Mosaic, Inscopix) and frequency (spikes/min) and amplitude (a.u.) data were processed using custom-written code in MATLAB (Mathworks). Monosynaptic retrograde rabies tracing For cell-type specific monosynaptic retrograde rabies tracing, D2-eGFP x Cre recombinase expressing double transgenic mice were injected with a cocktail of Cre dependent helper viruses mixed in 1:1 ratio (AAV2-Ef1a-DIO-GT, titer: 4.4*10 12 GC/ml, Salk vector core; AAV8-CA-DIO-RG, titer: 2.5*10 12 GC/ml, UNC Vector core). Three weeks later mice were injected with G-Deleted EnvA pseudotyped replication deficient Rabies SADΔG-B19-mCherry (Salk vector core, titer: 2.7*10 8 TU/ml). Ten days after rabies injection, animals were perfused for histology.
Histology
Mice were deeply anesthetized with isoflurane, and transcardially perfused with ice-cold saline followed by 10% formalin. Immunostaining was performed using primary antibodies against GFP (1:500; Abcam ab13970; RRID:AB_300798), mCherry (1:20k; LS-C204825; RRID:AB_2716246), dsRed (1:1000; Clontech #632496; RRID:AB_10013483), substance P (1:1000, Immunostar #20064, RRID:AB_572266), and Ser32-phospho-cFos (1:2000, Cell signaling #5348; RRID:AB_10557109), as well as Alexa-conjugated secondary antibodies (Invitrogen, 1:500). Cell counting and co-localization studies were performed using the cell counting plugin in ImageJ (NIH). For immunohistochemical validation of DREADD function, mice were injected with CNO or vehicle 2 h prior to perfusion. In situ hybridization Wild-type C57BL/6J mice were euthanized, and brains were rapidly extracted and flash frozen in isopentane solution on dry ice. Brains slices (15 μm) were stained for mRNA expression using the RNAscope in situ hybridization protocol (ACDbio) based on manufacturer recommendations, without epitope retrieval or protease pretreatment steps. Images were taken using a Zeiss LSM880 confocal microscope at 40x and cell counts and co-localization analyses were performed in ImageJ using the Cellcounter plugin (NIH).
Supplementary Material 1 2
📊 Figures
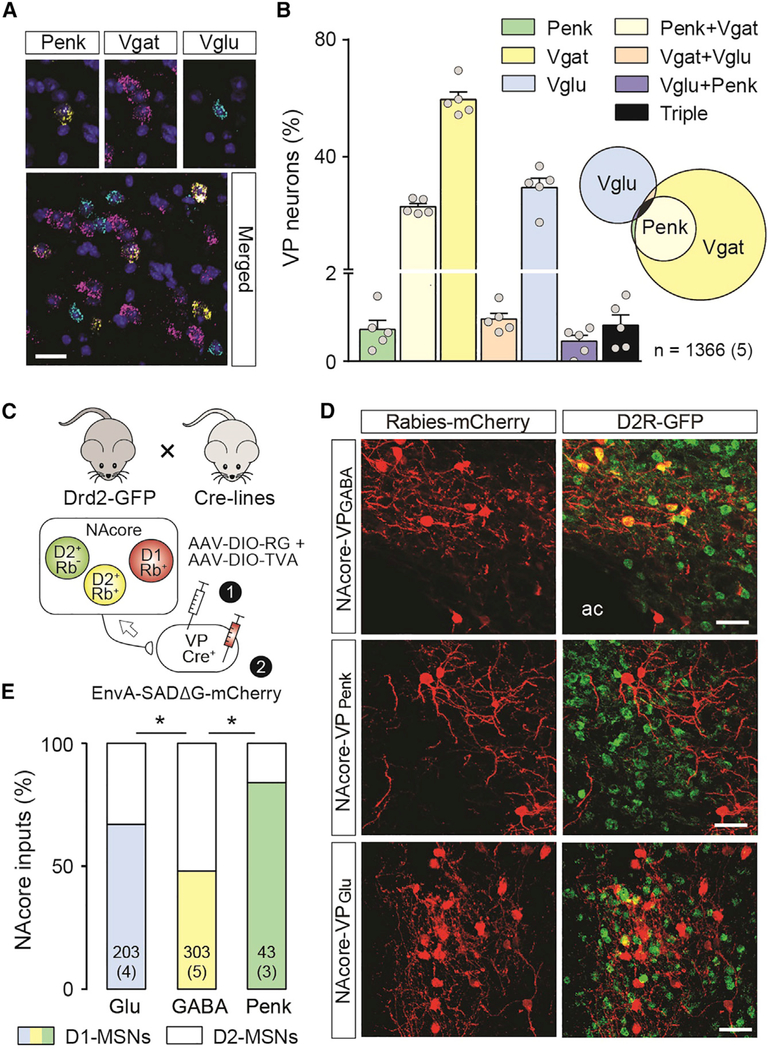
Figure 1.
Relative Density of VP Neuronal Subtypes and Proportion of Inputs Derived from NAcore D1- and D2-MSNs
(A) Representative micrograph from the VP showing triple in situ hybridization of mRNA encoding Vglut2 (Slc17a6; turquoise), Penk (yellow), Vgat (slc32a1; pink), and a DAPI nuclear counterstain. Scale...
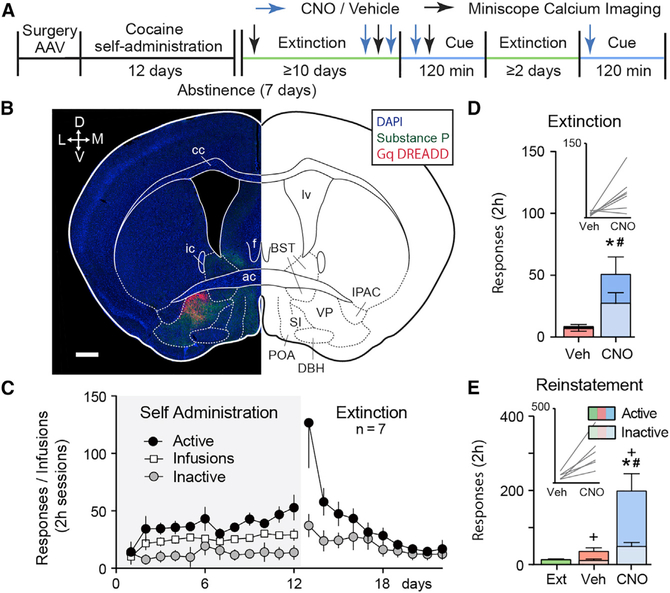
Figure 2.
Chemogenetic Stimulation of VP Neurons Augments Extinction- and Cue-Induced Cocaine Seeking
(A) Outline of the protocol used in the chemogenetic and miniscope Ca 2+ imaging experiments. (B) Representative example of non-selective Gq-DREADD expression in the VP. ac, anterior commissure; BST, ...
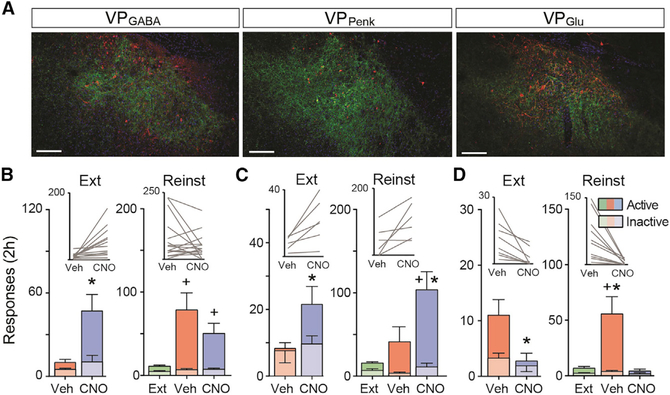
Figure 3.
Selective Stimulation of VP Neuronal Subpopulations Differentially Affects Drug Seeking under Extinction Conditions and During Cue Seeking
(A) Representative micrographs showing Gq DREADD expression in the different subtypes of VP neurons. Substance P was used as a counterstain to delineate the VP. Scale bar, 150 u03bcm. (Bu2013D) Outcom...
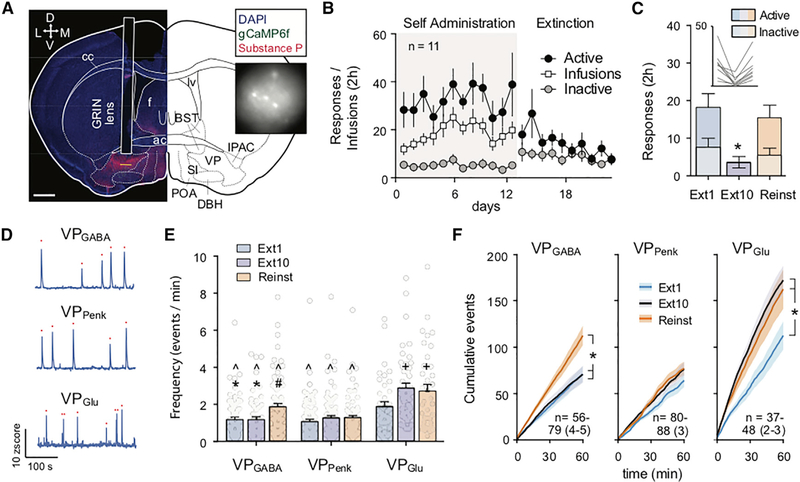
Figure 4.
Miniscope Measurements of Single-Cell Ca 2+ Spikes in VP during Extinction and Cue-Induced of Cocaine Seeking
(A) Representative micrograph of GRIN lens implantation site in a Vglut2-IRES-Cre mouse above VP to record from VP Glu neurons expressing gCaMP6f. Inset shows example frame from miniature microscope v...
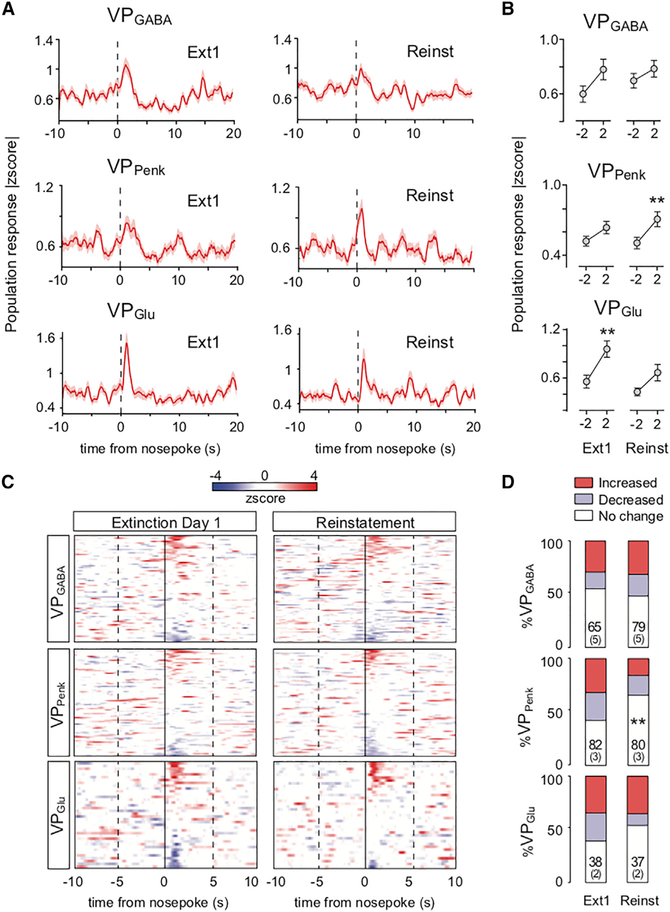
Figure 5.
VP Subpopulations Show Distinct Patterns of Calcium Fluorescence Organized around Nose Pokes
(A) Peri-event histograms showing the normalized absolute change in population response magnitude for all VP neurons during Ext1 and Reinst before and after active nose pokes. (B) Comparisons of the c...
Figure images are served from the NIH/NLM PubMed Central Open Access Subset or Europe PMC; copyright remains with the publishers and authors.
💬 Discussion
0 commentsNo comments yet. Be the first to start a discussion!
Leave a Comment