Abstract
AbstractOptogenetic therapies for vision restoration aim to confer intrinsic light sensitivity to retinal ganglion cells when photoreceptors have degenerated and light sensitivity has been irreversibly lost. We combine adaptive optics ophthalmoscopy with calcium imaging to optically record optogenetically restored retinal ganglion cell activity in the fovea of the living primate. Recording from the intact eye of a living animal, we compare the patterns of activity evoked by the optogenetic actuator ChrimsonR with natural photoreceptor mediated stimulation in the same retinal ganglion cells. Optogenetic responses are recorded more than one year following administration of the therapy and two weeks after acute loss of photoreceptor input in the living animal. This in vivo imaging approach could be paired with any therapy to minimize the number of primates required to evaluate restored activity on the retinal level, while maximizing translational benefit by using an appropriate pre-clinical model of the human visual system.
🔬 Techniques
🧬 Organisms
✨ Fluorophores
🧪 Sample Preparation
🏭 Microscope Brands
🎨 Filters
🏛️ Research Organizations (ROR)
Affiliated research institutions:
📋 Methods
Animal care The primates were socially housed in an AAALAC accredited institution. The monkeys had free access to water and food, providing a complete nutritious diet. In addition to daily food and water, monkeys were given various treats such as nuts, raisins and a large variety of fresh fruit and vegetables. An animal behaviorist provided a novel enrichment item to each monkey once a week which included items such as grapevines, fresh wheat grass and treat filled bags. Daily primate enrichment included 2–4 pieces of manipulata, a mirror, puzzle feeders rotated among all animals, daily movies or music and rotating access to a large, free ranging space with swings and elevated perches. They were cared for by the Department of Comparative Medicine which included four full-time veterinarians, five veterinary technicians, and animal care staff who monitored the health of the primates and checked for signs of discomfort at least twice daily. This study was carried out in strict accordance with the Association for Research in Vision and Ophthalmoscopy (ARVO) Statement for the Use of Animals and the recommendations in the Guide for the Care and Use of Laboratory Animals of the National Institutes of Health. The protocol was approved by the University Committee on Animal Resources of the University of Rochester (PHS assurance number: D16-00188(A3292-01)). Immune suppression Immune suppression with Cyclosporine A was begun one week prior to intravitreal injection at a starting dose of 6 mg kg −1 delivered sub-cutaneously. Blood trough levels were collected weekly to titrate the dose into a therapeutic range of 150–200 ng ml −1 and then maintained at that level. Animal 2’s body condition score began to drop after 9 months so immune suppression was stopped in that case. Co-expression of ChrimsonR and GCaMP6s AAV2-CAG-tdTomato-ChrimsonR and AAV2-CAG-GCaMP6s , synthesized by the University of Pennsylvania vector core were intravitreally injected into four eyes of three normal Macaca fascicularis as described previously 8 . Briefly, the eye was sterilized with 50% diluted betadine before the vector was injected into the middle of the vitreous at a location approximately 3 mm behind the limbus using a tuberculin syringe and 30 gauge needle. Two additional control eyes received an intravitreal injection of AAV2-CAG-GCaMP6s only and no ChrimsonR. The neutralizing antibodies, injected titres, volumes and animal number corresponding to each eye are detailed in Supplementary Table 1 . Neutralizing antibodies to AAV2 were 1:25 or lower in all four injected animals. Following injection each eye was imaged weekly with a conventional scanning light ophthalmoscope (Heidelberg Spectralis) using the 488 nm autofluorescence modality, to determine the onset of expression, image quality and to monitor eye health. Animal 2 and the control animal received 50 µl of triamcinolone (Kenalog-40) 3 weeks following the injection to treat the symptoms of uveitis. A fundus camera (Topcon TRC 50ex) equipped with custom filters to spectrally separate GCaMP6s (excitation 466/40 nm, emission 520/28 and tdTomato (excitation 549/25 nm and emission 586/20 nm) were used to monitor expression levels independently. Histology Animal 1 was euthanized with intravenous pentobarbital to effect, perfused with 1 litre heparinized saline and 2 litres of 4% paraformaldehyde. 100 µl of additional fixative was injected directly into the vitreous humor. The eye was enucleated, and the retina removed from the eyecup and postfixed in 4% paraformaldehyde for 2 h before being placed in 10%, followed by 30%, sucrose cryoprotectant until equilibrated. The tissue was flash frozen and an ultramicrotome used to cut the retina into 14 μm sections. Dried sections were coverslipped with vectorshield containing DAPI and examined under the confocal microscope, to image GCaMP6s expression (excitation 488 nm, emission 530/43 nm) and tdTomato (543 nm excitation, 620/52 nm emission), denoting expression of ChrimsonR. To assess the extent of photoreceptor loss caused by the ultrafast laser exposure delivered to the retina through the adaptive optics system, animal 5 was euthanised 4 weeks following the exposure as described previously and perfused with 2.5% glutaraldehyde and 4% paraformaldehyde. The eye was enucleated and the tissue postfixed and dehydrated before plastic embedding and sectioning into 2.5 μm sections. Full details of the protocol can be found in Walters et al. 23 . A two part hematoxylin and eosin stain was performed to label nuclei blue and cytoplasm pink, allowing assessment of structural damage.
Show full methods section
Animal care The primates were socially housed in an AAALAC accredited institution. The monkeys had free access to water and food, providing a complete nutritious diet. In addition to daily food and water, monkeys were given various treats such as nuts, raisins and a large variety of fresh fruit and vegetables. An animal behaviorist provided a novel enrichment item to each monkey once a week which included items such as grapevines, fresh wheat grass and treat filled bags. Daily primate enrichment included 2–4 pieces of manipulata, a mirror, puzzle feeders rotated among all animals, daily movies or music and rotating access to a large, free ranging space with swings and elevated perches. They were cared for by the Department of Comparative Medicine which included four full-time veterinarians, five veterinary technicians, and animal care staff who monitored the health of the primates and checked for signs of discomfort at least twice daily. This study was carried out in strict accordance with the Association for Research in Vision and Ophthalmoscopy (ARVO) Statement for the Use of Animals and the recommendations in the Guide for the Care and Use of Laboratory Animals of the National Institutes of Health. The protocol was approved by the University Committee on Animal Resources of the University of Rochester (PHS assurance number: D16-00188(A3292-01)). Immune suppression Immune suppression with Cyclosporine A was begun one week prior to intravitreal injection at a starting dose of 6 mg kg −1 delivered sub-cutaneously. Blood trough levels were collected weekly to titrate the dose into a therapeutic range of 150–200 ng ml −1 and then maintained at that level. Animal 2’s body condition score began to drop after 9 months so immune suppression was stopped in that case. Co-expression of ChrimsonR and GCaMP6s AAV2-CAG-tdTomato-ChrimsonR and AAV2-CAG-GCaMP6s , synthesized by the University of Pennsylvania vector core were intravitreally injected into four eyes of three normal Macaca fascicularis as described previously 8 . Briefly, the eye was sterilized with 50% diluted betadine before the vector was injected into the middle of the vitreous at a location approximately 3 mm behind the limbus using a tuberculin syringe and 30 gauge needle. Two additional control eyes received an intravitreal injection of AAV2-CAG-GCaMP6s only and no ChrimsonR. The neutralizing antibodies, injected titres, volumes and animal number corresponding to each eye are detailed in Supplementary Table 1 . Neutralizing antibodies to AAV2 were 1:25 or lower in all four injected animals. Following injection each eye was imaged weekly with a conventional scanning light ophthalmoscope (Heidelberg Spectralis) using the 488 nm autofluorescence modality, to determine the onset of expression, image quality and to monitor eye health. Animal 2 and the control animal received 50 µl of triamcinolone (Kenalog-40) 3 weeks following the injection to treat the symptoms of uveitis. A fundus camera (Topcon TRC 50ex) equipped with custom filters to spectrally separate GCaMP6s (excitation 466/40 nm, emission 520/28 and tdTomato (excitation 549/25 nm and emission 586/20 nm) were used to monitor expression levels independently. Histology Animal 1 was euthanized with intravenous pentobarbital to effect, perfused with 1 litre heparinized saline and 2 litres of 4% paraformaldehyde. 100 µl of additional fixative was injected directly into the vitreous humor. The eye was enucleated, and the retina removed from the eyecup and postfixed in 4% paraformaldehyde for 2 h before being placed in 10%, followed by 30%, sucrose cryoprotectant until equilibrated. The tissue was flash frozen and an ultramicrotome used to cut the retina into 14 μm sections. Dried sections were coverslipped with vectorshield containing DAPI and examined under the confocal microscope, to image GCaMP6s expression (excitation 488 nm, emission 530/43 nm) and tdTomato (543 nm excitation, 620/52 nm emission), denoting expression of ChrimsonR. To assess the extent of photoreceptor loss caused by the ultrafast laser exposure delivered to the retina through the adaptive optics system, animal 5 was euthanised 4 weeks following the exposure as described previously and perfused with 2.5% glutaraldehyde and 4% paraformaldehyde. The eye was enucleated and the tissue postfixed and dehydrated before plastic embedding and sectioning into 2.5 μm sections. Full details of the protocol can be found in Walters et al. 23 . A two part hematoxylin and eosin stain was performed to label nuclei blue and cytoplasm pink, allowing assessment of structural damage.
Animal preparation for imaging
All monkeys were fasted from 4–18 h prior to anaesthesia induction. Anaesthesia induction began with 10 mg kg −1 Ketamine, 0.25 mg kg −1 Midazolam, and 0.017 mg kg −1 Glycopyrrolate intramuscularly. The monkey was then given 5 mg kg −1 Ketofen intra-muscularly to prevent pain or inflammation from the lid speculum being placed in the eye during imaging for an extended period. The pupil was dilated with a combination of Tropicamide 1% and Phenylephrine 2.5%. In cases of minimal pupil dilation within the standard time, Phenylephrine 10% and/or Cyclopentolate 1% drops were administered. Both eyes were covered with a hydrating ophthalmic gel (Genteal). The target eye then had the lid speculum placed to keep the eye open during imaging and a contact lens was placed to ensure corneal protection. The fellow eye was taped closed with porous tape, to protect the cornea from drying. The animal was placed in a stereotaxic cart. Prior to intubation, an oxygen mask with 1–2% isoflurane, was placed over the monkey’s face to allow for adequate sedation for intubation. An intravenous drip of Lactated Ringers with 5% Dextrose was maintained at 5 ml kg −1 h −1 for the duration of imaging. The monkey was intubated and maintained at a surgical plane of anaesthesia with Isoflurane 1.0–2.5%. A Bair Hugger warming system was placed over the monkey to maintain body temperature. Monitoring devices including, rectal temperature probe, blood pressure cuff, electrocardiogram leads, capnograph, and a pulse oximeter, were used to ensure proper monitoring of all vitals. Temperature, heart rate and rhythm, respirations and end tidal CO 2 , blood pressure, SPO 2 and reflexes were monitored consistently and recorded every fifteen minutes. After a surgical plane of anaesthesia had been established, the monkey was given a 300 mcg kg −1 bolus of Rocuronium that was mixed to a concentration of 800 mcg ml −1 , followed by an intravenous infusion of 300 mcg kg −1 h −1 . Once respirations ceased, the monkey was maintained on a ventilator until imaging was over and the infusion was turned off. Once a peripheral nerve response was established, an intravenous dose of Glycopyrrolate 0.01 mg kg −1 was given. Five minutes after the Glycopyrrolate, Neostigmine 0.05 mg kg −1 was given intravenously. The monkey was monitored for indications of breathing against the ventilator and then removed from the ventilator once able to breath without assistance. The monkey was removed from the Isoflurane no sooner than fifteen minutes after the Neostigmine injection to ensure stability off the ventilator. The monkey was then allowed to wake up and extubated once all reflexes had returned. Photoreceptor ablation by ultrafast laser exposure To create a small scotoma suitable for testing restored vision in RGCs lacking photoreceptor input, a 0.87 × 0.79 degree patch of retina was exposed for 106 ms to a scanning, 55 fs pulsed 730 nm laser, with an average power of 4.48 W cm −2 and a repetition rate of 80 MHz. The exposure was delivered to the photoreceptor layer using an adaptive optics scanning light ophthalmoscope 21 . The structural impact of the exposure was assessed with OCT. SLO 488 nm imaging post-exposure was used to identify a region of reduced fluorescence providing a preliminary indication of ganglion cells that had been functionally impacted by photoreceptor damage. High resolution functional testing to assess the impact of the lesion was then conducted using the AOSLO as described in the following sections.
AOSLO calcium imaging
Data was collected using an AOSLO system described in Gray et al. 22 . Briefly, a Shack-Hartman wavefront sensor and deformable mirror were used to correct aberrations in closed loop using an 843 nm laser diode source (Thorlabs). During each trial the AO correction was static to prevent any periodic signal changes, between trials the loop was closed to refresh the shape of the mirror. A 796 nm superluminescent diode light source (Superlum) was focused on the photoreceptor layer and reflectance images were collected using a 2 Airy disk pinhole at a rate of 25.6 Hz. Simultaneously a 488 nm laser source (Qioptiq) was focused on the ganglion cell layer to excite GCaMP6s fluorescence, which was detected in a 517/20 nm emission band. An 8 airy disc pinhole was used to maximize signal collection. The excitation light was presented only during the forward scan phase and filled the whole field except for experiments comparing the activation of ganglion cells through photoreceptor versus ChrimsonR activity, where the 488 nm imaging light was confined to the region of ganglion cell bodies and foveal photoreceptors were not exposed. The imaging light intensities used were 3.8 mW cm −2 in Fig. 1(c, d) , 3 and Supplementary Fig. 1a , 4.3 mW cm −2 in Figs. 1 e, 2e and Supplementary Fig. 1b , 4.5 mW cm −2 in Fig. 1f, g and 2.6 mW cm −2 in Figs. 2a–d and 4 .
Visual stimulation
To drive photoreceptors we presented a pan-retinal, temporally modulated LED stimulus in Maxwellian view (peak wavelength 590 nm, 0.2 Hz, mean luminance 0.75 mW cm −2 ). The stimulus was presented for 90 s following a 30 s period of adaptation to the imaging light. To drive ChrimsonR, a spatially localized, 561 nm 0.2 Hz square wave drifting grating stimulus was focused onto the ganglion cell layer using a laser presented through our 25.6 Hz scanning system. The drifting grating stimulus was generated by modulation of the intensity of this laser source creating grating pattern moving at 0.2 Hz. The stimulus was presented for 90 s following a 30 s period of adaptation to the imaging light and stimulus mean luminance. To compare photoreceptor and ganglion cell sensitivity the drifting grating stimulus was focused either at the photoreceptor layer and presented at the fovea or to the ganglion cell layer (GCL). The mean luminance of the visual stimulus presented during each trial was increased in a stepwise manner (an ascending staircase) to produce the data presented in Fig. 4 . A spatial frequency of 1.1 cycles per degree and mean luminance of 12.5mWcm −2 was used in the trials presented in Figs. 1c, d , and 3 , 14 mW cm −2 in Fig. 1e and 15 mW cm −2 in 1f–g. The mean stimulus luminances used in Fig. 2b–e were 0.9, 9.7, 9, and 10.8 mW cm −2 respectively. In each case the imaging light was focused at and localized to the foveal ganglion cell layer as described above. Control trials consisted of the presentation of a constant equivalent mean luminance for the duration of the trial or when light exposure was a concern in the case of the sensitivity comparison, the imaging light only. The stimulus was also presented in the same field of view without the imaging light to detect any optical bleed through, anti-stokes or tdTomato emission and this was subtracted from the test data in all cases except Fig. 3 where light exposure consideration limited the number of permissible trials. Additional data was also collected using a 640 nm stimulus to drive ChrimsonR confirming that responses were present in the absence of any tdTomato excitation (Data available on request). The visual stimuli and imaging fields were stabilized on the retina using an approach described previously 10 .
Data analysis
To remove the effect of eye movements, each frame of the fluorescence video was co-registered using the corresponding high signal-to-noise infrared reflectance video. For each field of view, a single frame was chosen, typically the tenth infrared reflectance frame in the video, and frame to frame image registration of all videos for that field of view was performed using a whole frame cross correlation method. Frames were summed to create a fluorescence image of the ganglion cell layer and individual cells were segmented by hand to create a mask that could be applied to all videos with that field of view. All identifiable cells in the focal plane within the stimulation area were segmented. To illustrate the experimental paradigm in Figs. 1 , 2 , fluorescence images were contrast adjusted, thresholded, pseudo-colored and superimposed on the corresponding reflectance images. A similar process was used with SLO to illustrate the method in Fig. 4e, f, k . No such manipulations were performed on the raw data. The frames corresponding to the adaptation period were removed from the registered fluorescence video and the segmentation mask was applied to the remaining frames. The mean of the signal within each cell mask was computed for each frame and a Hann windowing function was applied to the data. Each data sequence was temporally Fourier transformed into the frequency domain. The Fourier amplitudes were normalized relative to the standard deviation of the noise in the signal from 0.35 Hz to 0.55 and 0.65 to 1.1 Hz (avoiding the respiration rate) producing a response metric equivalent to the sensitivity index D’. This allowed comparison of data between different animals and different areas of the foveal ring. To produce the sensitivity comparison in Fig. 3 , the same cell mask was applied to both the photoreceptor driven and ChrimsonR driven data in each ascending staircase. The sensitivity index characterising the magnitude of the response was computed as described and then both the optogenetic mediated and photoreceptor mediated data for each field of view was scaled by the magnitude of the maximum photoreceptor response. This allowed us to combine data sets from different areas of the foveal RGC ring and from different imaging sessions under the assumption that the photoreceptor response is constant. Three datasets from the right eye of animal 2 were combined to produce Fig. 4 ; two from the same imaging session from nasal and temporal sides of the ganglion cell layer 51 weeks after injection, and one from the nasal side at 61 weeks. To assess the spatial frequency of the response, we Fourier transformed the raw fluorescence time course data on a pixel by pixel basis and from the result computed the phase of the response at 0.2 Hz for each pixel. The phase was assigned a color (rainbow color scheme ranging from 0 to 360 degrees as shown in Fig. 2 ) and phase maps of the response were produced (Fig. 2 ). To examine the spatial frequency of the response pattern more quantitively, the complex output from the pixelwise temporal Fourier transform, containing both the phase and amplitude signatures of the response, was spatially Fourier transformed. A two-dimensional Fourier transform was applied to data from the 255 × 255 pixel region of ganglion cells that were stimulated. The same region of interest was used in the photoreceptor stimulation condition. We observed low amplitude anti-stokes emission from the GCaMP6s in control trials with the stimulation laser only. While the amplitude of this signal was very low, the phase information contained in the signal was potentially misleading and therefore the Fourier transformed data for the stimulus only condition was subtracted prior to the production of the spatial Fourier transform. Reporting summary Further information on experimental design is available in the Nature Research Reporting Summary linked to this paper.
Supplementary information Supplementary Information Reporting Summary
📊 Figures
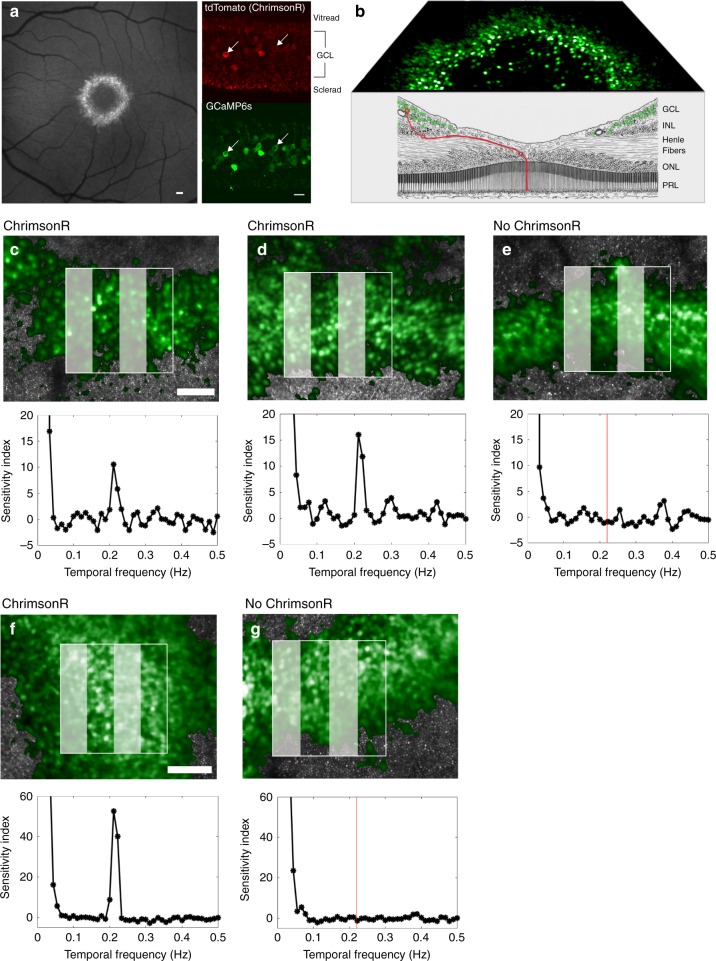
Fig. 1
GCaMP6s recording from foveal retinal ganglion cells in the living macaque shows ChrimsonR mediated responses to a drifting grating stimulus.
a (Left panel) Scanning light ophthalmoscope image of GCaMP6s expression in the ring of ganglion cells serving the foveal cones, scale bar 150u03bcm. (Right panel) Confocal microscope images of GCaMP6...
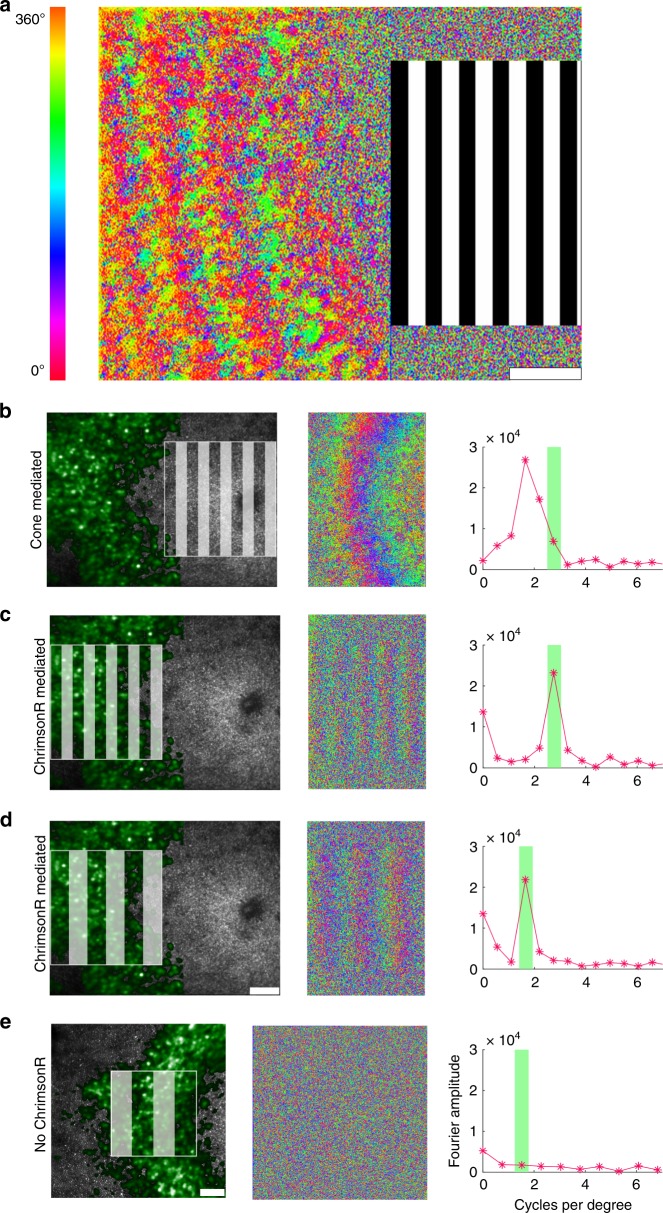
Fig. 2
Optogenetic therapy restores characteristic retinal ganglion cell responses to patterned stimuli in the living primate.
a Pixelwise map of the temporal phase of ganglion cells responding to a 0.2u2009Hz drifting grating presented to foveal cones. b The spatial frequency of the ganglion cell layer (GCL) response to a 2....
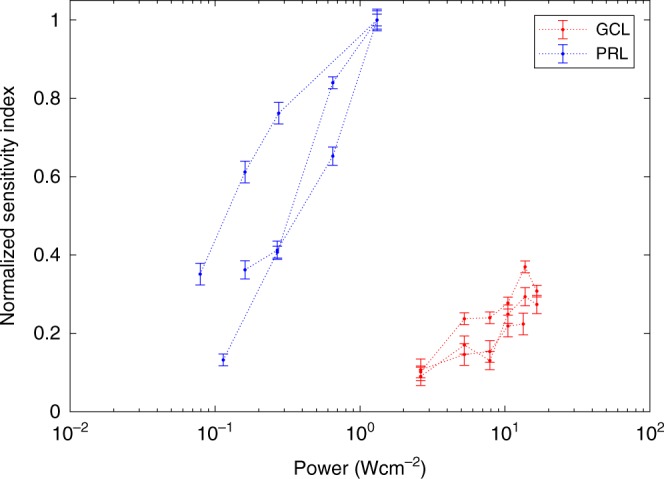
Fig. 3
Comparison of photoreceptor mediated RGC activity (blue) and ChrimsonR mediated RGC activity (red) over a range of stimulus powers.
Spatially localized grating stimuli were focussed on the photoreceptor layer (PRL), or directly on the ganglion cell layer (GCL). Mean cellular response was quantified as the sensitivity index normali...
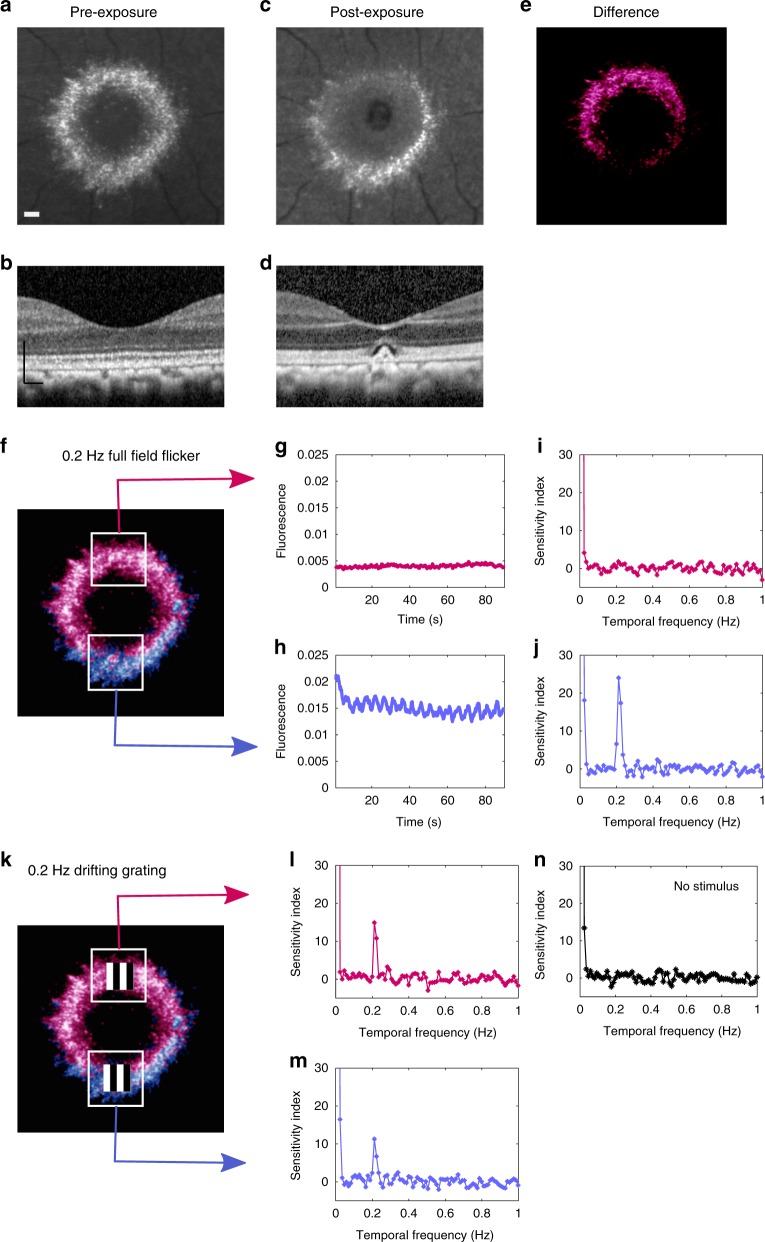
Fig. 4
ChrimsonR mediated responses can be recorded from cells that have lost their photoreceptor input, restoring light sensitivity.
a Confocal SLO image of GCaMP6s fluorescence in foveal RGCs pre-scotoma. 150u2009u00b5m scale bar also applies to ( c , e , f ) and ( k ). b OCT image pre-scotoma 150u2009u00b5m scale bar also applies...
Figure images are served from the NIH/NLM PubMed Central Open Access Subset or Europe PMC; copyright remains with the publishers and authors.
💬 Discussion
0 commentsNo comments yet. Be the first to start a discussion!
Leave a Comment