Abstract
A critical role of circadian oscillators in orchestrating insulin secretion and islet gene transcription has been demonstrated recently. However, these studies focused on whole islets and did not explore the interplay between α-cell and β-cell clocks. We performed a parallel analysis of the molecular properties of α-cell and β-cell oscillators using a mouse model expressing three reporter genes: one labeling α cells, one specific for β cells, and a third monitoring circadian gene expression. Thus, phase entrainment properties, gene expression, and functional outputs of the α-cell and β-cell clockworks could be assessed in vivo and in vitro at the population and single-cell level. These experiments showed that α-cellular and β-cellular clocks are oscillating with distinct phases in vivo and in vitro. Diurnal transcriptome analysis in separated α and β cells revealed that a high number of genes with key roles in islet physiology, including regulators of glucose sensing and hormone secretion, are differentially expressed in these cell types. Moreover, temporal insulin and glucagon secretion exhibited distinct oscillatory profiles both in vivo and in vitro. Altogether, our data indicate that differential entrainment characteristics of circadian α-cell and β-cell clocks are an important feature in the temporal coordination of endocrine function and gene expression.
🔬 Techniques
💻 Software
✨ Fluorophores
🧪 Sample Preparation
🏭 Microscope Brands
🧪 Reagent Suppliers
📷 Detectors
💻 Software Details
💾 Data Repositories
🏛️ Research Organizations (ROR)
Affiliated research institutions:
📋 Methods
Animal care and reporter mouse strain
Animal studies were performed according to the regulations of the veterinary office of the State of Geneva. The triple reporter mouse strain was established by crossing Gcg - Venus reporter ( Reimann et al. 2008 ), RIP- Cherry ( Zhu et al. 2015 ), and Per2 :: Luc ( Yoo et al. 2004 ) mice ( Supplemental Fig. S1 ). ProGcg - Venus and RIP-Cherry reporters exhibited very high specificity and expression levels in α and β cells, respectively ( Supplemental Fig. S1 ; Zhu et al. 2015 ; Dusaulcy et al. 2016 ). Bmal1 knockout mice have been described previously by Jouffe et al. (2013) . All experiments were done in mice between 7 and 16 wk of age under standard animal housing conditions with free access to food and water and in 12-h light/12-h dark cycles (LD). For the in vivo sample collection, animals were subjected to night-restricted feeding ( Supplemental Fig. S1 ) 2 wk prior to the experiments and during the entire period of sample collection, allowing us to reduce the effect of individual feeding rhythms ( Atger et al. 2015 ). For sample collection covering the 24-h period, half of the animals were entrained by inverted LD and feeding cycles during the 3 wk preceding the experiments. Fasted blood collection around the clock was performed in the absence of feeding and following 12 h of fasting prior to the first time point. For Bmal1 knockout mice and their control littermates, serum samples were collected during the light phase (ZT0–ZT12) and dark phase (ZT12–ZT24).
Pancreatic islet isolation and separation of α and β cells
Islets of Langerhans were isolated by standard procedure based on collagenase (type XI; Sigma) digestion of the pancreas followed by Ficoll purification ( Wojtusciszyn et al. 2009 ). Islet cells were gently dissociated by trypsin (GIBCO) resuspended in KRB solution (pH 7.4) supplemented with 0.3 % free fatty acid bovine serum albumin (BSA) (Sigma), 1.4 mM glucose, and 0.5 mM EDTA). α-Cell and β-cell populations were separated by flow cytometry FACS (Astrios sorter, Beckman Coulter) based on fluorescence wavelength and intensity and cell singlet nature, size, and viability ( Supplemental Fig. S2 ). In vitro islets/islet cell culture, synchronization, and bioluminescence monitoring For in vitro culture, the intact islets or dissociated or sorted cells were recovered in RPMI 1640 complete medium (11.2 mM glucose, 110 µg/mL sodium pyruvate) supplemented with 10% fetal calf serum, 110 U/mL penicillin, 110 µg/mL streptomycin, and 50 µg/mL gentamycin and attached to 35-mm dishes or multiwell plates precoated with a laminin-5-rich extracellular matrix ( Parnaud et al. 2008 ). Adherent islets/cells were synchronized by a 1-h pulse of 10 µM forskolin (Sigma), 100 nM insulin (NovoRapid), or 5 µM adrenaline (Geneva Hospital Pharmacy) prior to continuous bioluminescence recording in RPMI supplemented with 100 µM luciferin (NanoLight Technology) ( Saini et al. 2016 ). For detrended time series, raw luminescence signals were processed by a moving average with a window of 24 h ( Saini et al. 2016 ). β1 adrenergic receptor antagonist atenolol (100 µM), and 100 µM α2 adrenergic receptor antagonist yohimbine were applied to α and β cells, respectively, 15 min prior to adding adrenaline for the synchronization, and cells were kept in the medium during a 1-h synchronization period.
Show full methods section
Animal care and reporter mouse strain
Animal studies were performed according to the regulations of the veterinary office of the State of Geneva. The triple reporter mouse strain was established by crossing Gcg - Venus reporter ( Reimann et al. 2008 ), RIP- Cherry ( Zhu et al. 2015 ), and Per2 :: Luc ( Yoo et al. 2004 ) mice ( Supplemental Fig. S1 ). ProGcg - Venus and RIP-Cherry reporters exhibited very high specificity and expression levels in α and β cells, respectively ( Supplemental Fig. S1 ; Zhu et al. 2015 ; Dusaulcy et al. 2016 ). Bmal1 knockout mice have been described previously by Jouffe et al. (2013) . All experiments were done in mice between 7 and 16 wk of age under standard animal housing conditions with free access to food and water and in 12-h light/12-h dark cycles (LD). For the in vivo sample collection, animals were subjected to night-restricted feeding ( Supplemental Fig. S1 ) 2 wk prior to the experiments and during the entire period of sample collection, allowing us to reduce the effect of individual feeding rhythms ( Atger et al. 2015 ). For sample collection covering the 24-h period, half of the animals were entrained by inverted LD and feeding cycles during the 3 wk preceding the experiments. Fasted blood collection around the clock was performed in the absence of feeding and following 12 h of fasting prior to the first time point. For Bmal1 knockout mice and their control littermates, serum samples were collected during the light phase (ZT0–ZT12) and dark phase (ZT12–ZT24).
Pancreatic islet isolation and separation of α and β cells
Islets of Langerhans were isolated by standard procedure based on collagenase (type XI; Sigma) digestion of the pancreas followed by Ficoll purification ( Wojtusciszyn et al. 2009 ). Islet cells were gently dissociated by trypsin (GIBCO) resuspended in KRB solution (pH 7.4) supplemented with 0.3 % free fatty acid bovine serum albumin (BSA) (Sigma), 1.4 mM glucose, and 0.5 mM EDTA). α-Cell and β-cell populations were separated by flow cytometry FACS (Astrios sorter, Beckman Coulter) based on fluorescence wavelength and intensity and cell singlet nature, size, and viability ( Supplemental Fig. S2 ). In vitro islets/islet cell culture, synchronization, and bioluminescence monitoring For in vitro culture, the intact islets or dissociated or sorted cells were recovered in RPMI 1640 complete medium (11.2 mM glucose, 110 µg/mL sodium pyruvate) supplemented with 10% fetal calf serum, 110 U/mL penicillin, 110 µg/mL streptomycin, and 50 µg/mL gentamycin and attached to 35-mm dishes or multiwell plates precoated with a laminin-5-rich extracellular matrix ( Parnaud et al. 2008 ). Adherent islets/cells were synchronized by a 1-h pulse of 10 µM forskolin (Sigma), 100 nM insulin (NovoRapid), or 5 µM adrenaline (Geneva Hospital Pharmacy) prior to continuous bioluminescence recording in RPMI supplemented with 100 µM luciferin (NanoLight Technology) ( Saini et al. 2016 ). For detrended time series, raw luminescence signals were processed by a moving average with a window of 24 h ( Saini et al. 2016 ). β1 adrenergic receptor antagonist atenolol (100 µM), and 100 µM α2 adrenergic receptor antagonist yohimbine were applied to α and β cells, respectively, 15 min prior to adding adrenaline for the synchronization, and cells were kept in the medium during a 1-h synchronization period.
Combined bioluminescence–fluorescence time-lapse microscopy and data analysis
Dispersed islet cells attached to glass-bottomed dishes (WillCo Wells BV) were synchronized by forskolin and subjected to combined bioluminescence–fluorescence imaging ( Pulimeno et al. 2013 ). An Olympus LV200 workstation equipped with a 63× UPLSAPO objective and EM CCD camera (Image EM C9100-13, Hamamatsu) was used. The recorded time-lapsed images were analyzed on ImageJ 1.50 ( Schneider et al. 2012 ), with individual cells tracked in the bioluminescence and fluorescence channels using a modified version of ImageJ plug-in CGE ( Sage et al. 2010 ). Measuring of expression levels was performed on the labeled and tracked cells in the bioluminescence images over time. To assess the circadian characteristics of single-cell profiles, a Cosine fitting method (CosinorJ) was applied ( Mannic et al. 2013 ). RNA-seq Total RNA was prepared from FACS-sorted α and β cells collected every 4 h around the clock in duplicates (total of 24 samples representing an RNA pool of six to 12 mice each) using RNeasy Plus Micro Kit (Qiagen). RNA-seq was performed on the Institute of Genetics and Genomics in Geneva genomics platform (University of Geneva, Switzerland). The TruSeq stranded total RNA with Ribo-Zero Gold kit (Illumina) was used for library preparation with 100 ng of total RNA as input. Library molarity and quality were assessed with Qubit (Life Technologies) and Tapestation using a DNA high-sensitivity chip (Agilent Technologies). Paired-end reads of 50 bases were generated using TruSeq SBS HS version 3 chemistry on an Illumina HiSeq 2500 sequencer. RNA-seq mapping and quantification and model selection and rhythmicity assessment are described in the Supplemental Material . Measurements of insulin, glucagon, and glucose levels in the blood serum Mice were sacrificed by decapitation at ZT0, ZT4, ZT8, ZT12, ZT16, and ZT20 with subsequent blood collection and serum preparation by immediate centrifugation at 3000 rpm for 15 min at 4°C ( Supplemental Fig. S1 ) and storage at −80°C. Protease inhibitors PMSF (Axon), aprotinin (Sigma), and DPP4 (Millipore) were added to the samples to preserve the hormones from degradation. Insulin and glucagon concentrations were assessed by ultrasensitive mouse insulin and glucagon ELISA kits (Mercodia), and serum glucose was assessed by Accu-Chek glucometer (Roche). Islet cell continuous perifusion Dispersed islet cells or FACS-separated α and β cells were attached and forskolin-synchronized as described above, placed into an in-house-developed two-well horizontal perifusion chamber connected to a LumiCycle, and continuously perifused with RPMI (without sodium pyruvate) containing 5.5 mM glucose and 100 µM luciferin as described ( Saini et al. 2016 ). Bioluminescence recordings were performed in parallel to the 4-h interval automated collection of the outflow medium. Basal insulin and glucagon levels were quantified in the outflow medium by mouse insulin and glucagon ELISA kits (Mercodia) and normalized to the total cellular content with subsequent moving average transformation. Circadian parameters of the secreted profiles were evaluated by the CosinorJ algorithm ( Mannic et al. 2013 ).
📊 Figures
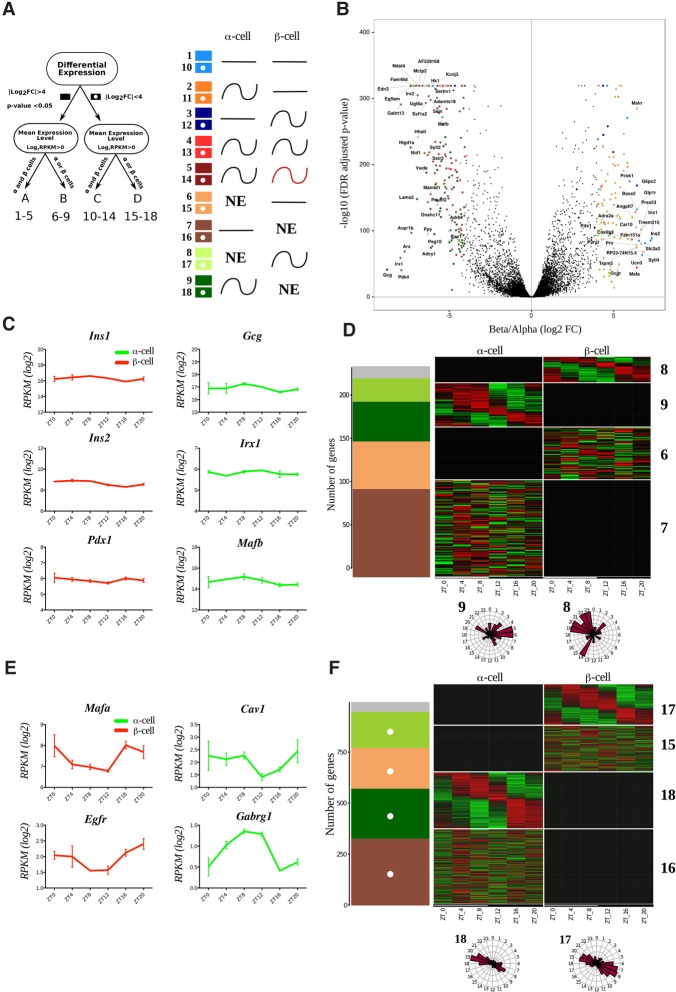
Figure 1.
Temporal pattern of transcripts differentially expressed in u03b1 and u03b2 cells. ( A ) Groups and models assigned to transcripts with respect to their differential expression and rhythmic pattern. T...
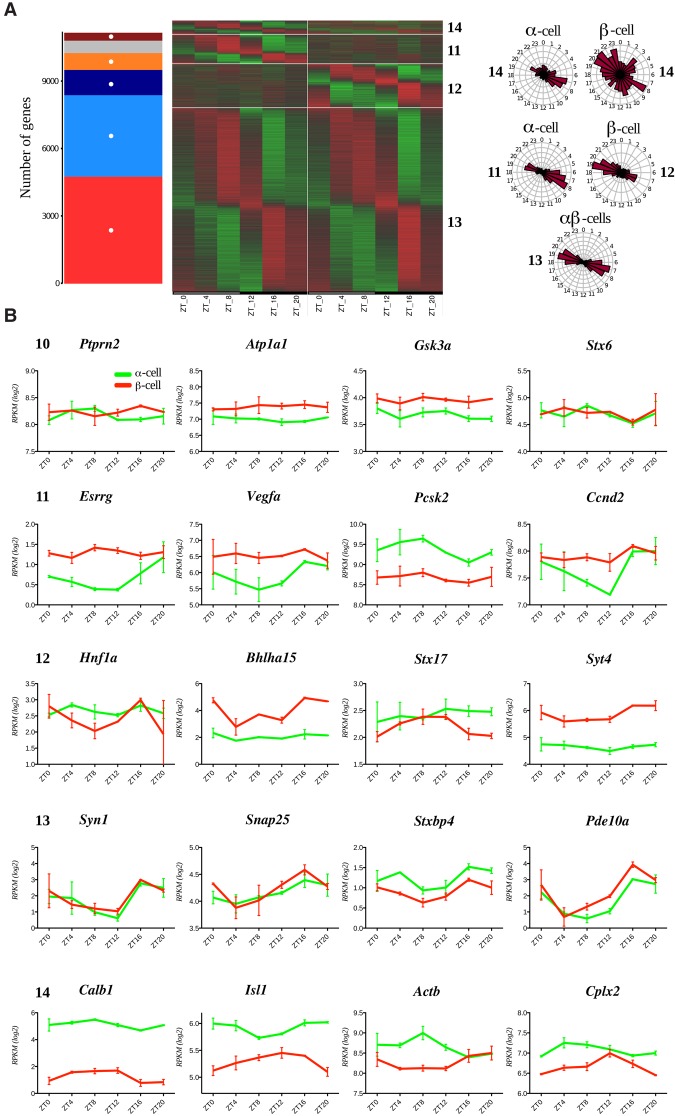
Figure 2.
Comparative analysis of temporal expression patterns of the transcripts expressed in u03b1 and u03b2 cells (group C in Fig. 1 A). A total of 11,171 transcripts expressed in both u03b1 and u03b2 cells ...
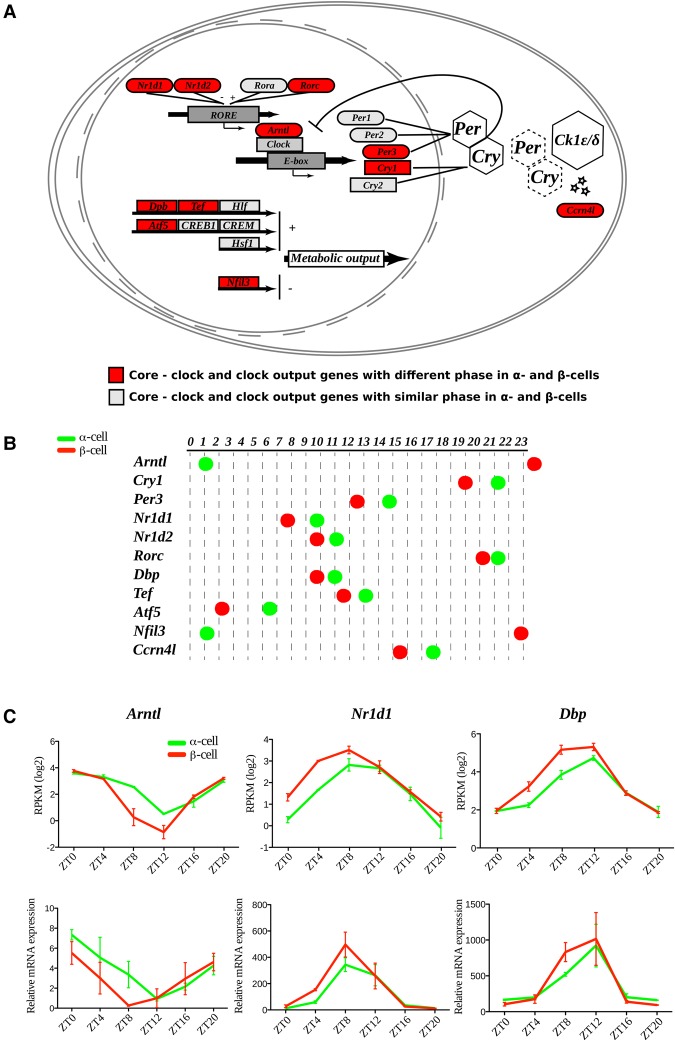
Figure 3.
Core clock transcripts expressed in u03b1 and u03b2 cells exhibit distinct rhythmic phases in vivo. ( A ) Mapping of identified u03b1-cell and u03b2-cell molecular clock and clock-controlled transcrip...
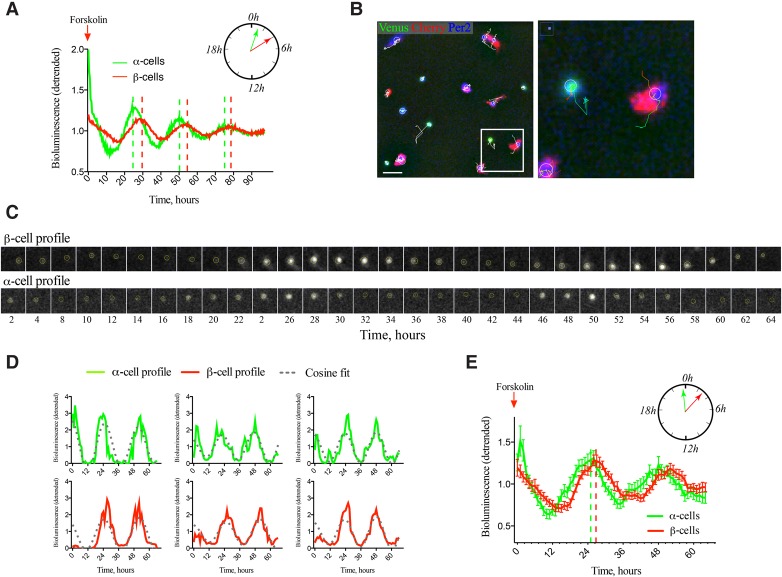
Figure 4.
u03b1-Cell and u03b2-cell clocks synchronized in vitro by forskolin exhibit distinct circadian phases at the population ( A ) and single-cell ( B u2013 E ) levels. ( A ) Average PER :: Luc oscillation...
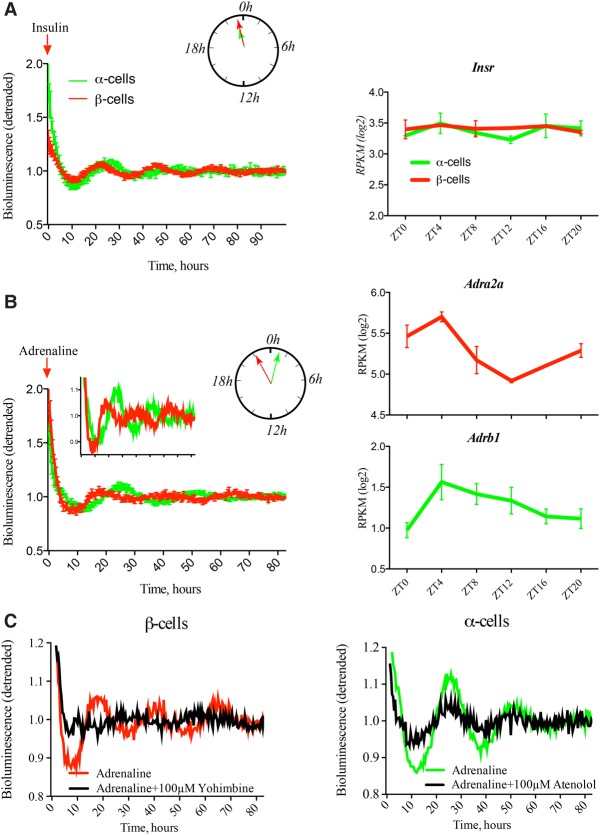
Figure 5.
u03b1-Cell and u03b2-cell clocks synchronized in vitro by adrenaline, but not by insulin, exhibit distinct circadian phases. ( Left panels) Average detrended PER2 :: Luc bioluminescence profiles for s...
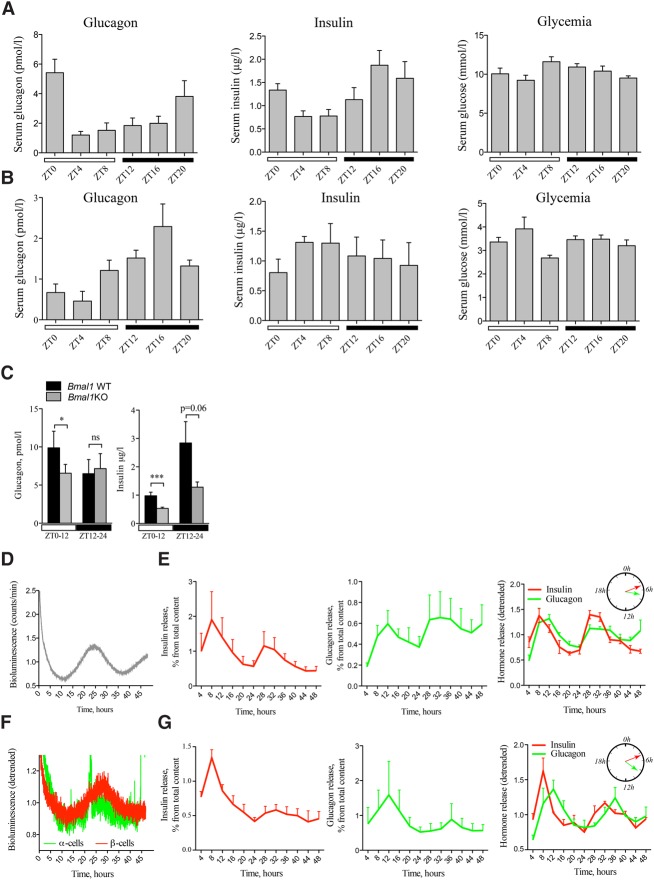
Figure 6.
Secretion of insulin and glucagon in vivo and in vitro exhibits rhythmic profiles altered in circadian mutant mice. In vivo insulin, glucagon, and glucose levels were assessed in the sera collected fr...
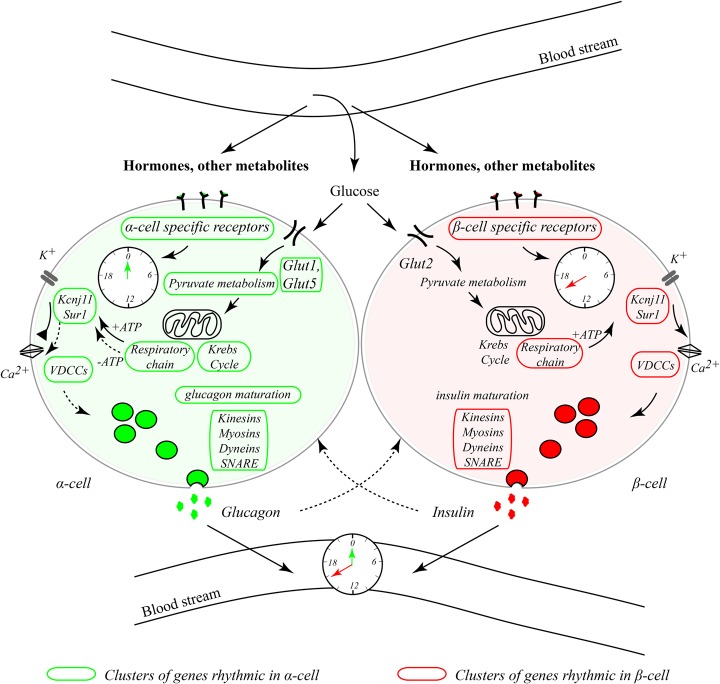
Figure 7.
Inputs and outputs of u03b1-cellular and u03b2-cellular clocks. u03b1-Cellular and u03b2-cellular oscillators exhibit different circadian phases in vivo and in vitro in response to physiologically rel...
Figure images are served from the NIH/NLM PubMed Central Open Access Subset or Europe PMC; copyright remains with the publishers and authors.
💬 Discussion
0 commentsNo comments yet. Be the first to start a discussion!
Leave a Comment