Abstract
In the brain, a paravascular space exists between vascular cells and astroglial end-foot processes, creating a continuous sheath surrounding blood vessels. Using in vivo two-photon imaging we demonstrate that the paravascular circulation facilitates selective transport of small lipophilic molecules, rapid interstitial fluid movement and widespread glial calcium signaling. Depressurizing the paravascular system leads to unselective lipid diffusion, intracellular lipid accumulation and pathological signaling in astrocytes. As the central nervous system is devoid of lymphatic vessels, the paravascular space may serve as a lymphatic equivalent that represents a separate highway for the transport of lipids and signaling molecules.
🔬 Techniques
💻 Software
✨ Fluorophores
🧪 Sample Preparation
🔬 Cell Lines
🏭 Microscope Brands
🧪 Reagent Suppliers
🔴 Lasers
💻 Software Details
🏛️ Research Organizations (ROR)
Affiliated research institutions:
📋 Methods
Animals Glt-1 -eGFP, NG2-DsRed and Aqp4 −/− mice were generated as outlined previously 4 17 , and mice of either sex from 6–12 weeks used in conjunction with C57BL/6J wild-types (Jackson Laboratories) were used for experiments. All animals, except those used for awake imaging, were anesthetized with ketamine (0.12 mg g −1 ) and xylazine (0.01 mg g −1 ) intraperitoneally (i.p.). All animal experiments were approved by the Animal Care and Use Committee of the University of Rochester. Tracer preparation and intracisternal infusion The hydrophilic tracers fluorescein isothiocyanate (FITC) dextran (0.5%, 2000 kDa) and tetramethylrhodamine (TMR) dextran (0.5%, 3 kDa) and the lipophilic, cell-permeant tracers palmitic acid (BODIPY® FL C 16 1 mg ml −1 , 0.474 kDa, Molecular Probes), Texas red hydrazide (0.4–2 mM, 0.621 kDa), sulforhodamine SR101 acid chloride (0.2 mM, 0.607 kDa), rhod-2 acetoxymethyl (AM) (0.45–4.5 mM, 1.124 kDa) and Oregon-green BAPTA-1 (OGB) AM (0.5 mM, 1.258 kDa, acquired from Invitrogen and Sigma-Aldrich) were constituted in artificial cerebrospinal fluid (aCSF) 17 . These tracers were chosen because of their small size (comparable to endogenous lipids), relevance to in vivo imaging (e.g. as calcium indicators) and ability to cross cell membranes, such as the endfoot membrane that encases the paravascular space 15 17 . The mice were secured in a stereotaxic frame, and a 30G needle was inserted into the cisterna magna. Tracer dissolved in aCSF was delivered at a rate of 2 μL min −1 over 5 minutes with a syringe pump (Harvard Apparatus). The dyes were used at higher concentrations than direct cortical application to allow the approximate dilution factor of 1:5 when 10 μL was infused into the total mouse CSF volume of 40 μL 22 . The cisterna magna was punctured with a 30G needle to drain the CSF and depressurize the paravascular space. In sham control animals the cisterna magna was exposed without puncturing it.
Show full methods section
Animals Glt-1 -eGFP, NG2-DsRed and Aqp4 −/− mice were generated as outlined previously 4 17 , and mice of either sex from 6–12 weeks used in conjunction with C57BL/6J wild-types (Jackson Laboratories) were used for experiments. All animals, except those used for awake imaging, were anesthetized with ketamine (0.12 mg g −1 ) and xylazine (0.01 mg g −1 ) intraperitoneally (i.p.). All animal experiments were approved by the Animal Care and Use Committee of the University of Rochester. Tracer preparation and intracisternal infusion The hydrophilic tracers fluorescein isothiocyanate (FITC) dextran (0.5%, 2000 kDa) and tetramethylrhodamine (TMR) dextran (0.5%, 3 kDa) and the lipophilic, cell-permeant tracers palmitic acid (BODIPY® FL C 16 1 mg ml −1 , 0.474 kDa, Molecular Probes), Texas red hydrazide (0.4–2 mM, 0.621 kDa), sulforhodamine SR101 acid chloride (0.2 mM, 0.607 kDa), rhod-2 acetoxymethyl (AM) (0.45–4.5 mM, 1.124 kDa) and Oregon-green BAPTA-1 (OGB) AM (0.5 mM, 1.258 kDa, acquired from Invitrogen and Sigma-Aldrich) were constituted in artificial cerebrospinal fluid (aCSF) 17 . These tracers were chosen because of their small size (comparable to endogenous lipids), relevance to in vivo imaging (e.g. as calcium indicators) and ability to cross cell membranes, such as the endfoot membrane that encases the paravascular space 15 17 . The mice were secured in a stereotaxic frame, and a 30G needle was inserted into the cisterna magna. Tracer dissolved in aCSF was delivered at a rate of 2 μL min −1 over 5 minutes with a syringe pump (Harvard Apparatus). The dyes were used at higher concentrations than direct cortical application to allow the approximate dilution factor of 1:5 when 10 μL was infused into the total mouse CSF volume of 40 μL 22 . The cisterna magna was punctured with a 30G needle to drain the CSF and depressurize the paravascular space. In sham control animals the cisterna magna was exposed without puncturing it.
Ex vivo imaging
Mouse preparation was modified from published protocols 4 . The animals were perfused transcardially with 4% paraformaldehyde in 0.1 M phosphate buffered saline (pH 7.4) and post-fixed overnight. 100 μm vibratome brain sections were then cut and mounted on slides using PROLONG anti-fade gold with DAPI (Invitrogen). Epifluorescence multi-channel whole-brain montages were collected using a virtual slice module (Microlucida Software, Microbrightfield). Exposure and gain levels were maintained constant throughout the study. The percentage of brain tracer penetration was calculated using the area fraction function in ImageJ (NIH) on consistently thresholded images, as described previously 4 . For EM experiments 0.1% glutaraldehyde was added to the perfusate/fixation solution and the ultra-thin Lowicryl sections were prepared as outlined previously 23 . Images were obtained 125 μm below the surface in the barrel cortex. In vivo imaging Anesthetized animals were intubated and artificially ventilated with a small animal ventilator (CWE), their temperature was maintained using a heating pad, and blood gasses were collected via a femoral arterial cannula to ensure physiological hemodynamic parameters 17 . To visualize the cerebral vasculature FITC or Texas red dextran (Invitrogen) were administered intra-arterially. A steel frame was secured to the skull using dental cement, and a 2 mm craniotomy was opened over the somatosensory cortex with particular care being taken not to puncture the dura mater. To stabilize imaging, the craniotomy was then sealed with agarose (1.5%, type III-A, Sigma) and a coverslip. A Mai Tai laser (SpectraPhysics) attached to a confocal scanning system (Fluoview 300, Olympus) and an upright microscope (IX51 W) were used. Tracers and eGFP were excited at 850–890 nm and emission was collected at 575–645 nm using a 20x (0.95NA) lens. 512 × 512 pixel frames were collected from the pial surface to 200 μm depth at 20 μm z-steps. Superficial arteries and veins were distinguished based on morphology (e.g. arteries pass more superficially, and have fewer branches near the surface) 4 . Tracer movement was analyzed as outlined previously by defining doughnut shaped ROIs around cerebral blood vessels 4 .
Awake calcium imaging
Animal preparation was performed as described by the authors previously 15 . Briefly, mice were anesthetized with isoflurane (1.0–1.5%), head-restrained with a steel mini-frame, and habituated to imaging through training sessions. The craniotomy was made as outlined above and rhod-2 (2 mM, Invitrogen) was loaded onto exposed cortex before applying the coverslip. Calcium signaling was imaged 75–125 μm depth and dual channel (rhod-2 and eGFP) frames were collected at 0.2 or 1 Hz. Calcium transients were analysed using previously described custom-made software (MatLab Inc.) and Image J (NIH) 15 17 . In situ calcium imaging Acute cortical slices were prepared from P10-20 mice as described previously 16 17 . Briefly, 400 μm acute cortical slices were incubated with rhod-2 (2 mM) for 20 min, before being transferred to a recording chamber where they were imaged and analyzed as outlined before 17 . ATP (500 μM in aCSF) was injected via a glass microelectrode 40–80 μm into the paravascular space or parenchyma of the slice using a picospritzer (10 psi, 100 ms, Parker Instrumentation). We used FITC dextran (1%, 2000 kDa) to visualize the injection.
Statistical analyses
All analysis was performed using IBM SPSS Statistics 19 and all tests were two-tailed where significance was achieved at α = 0.05 level. Wherever necessary a Bonferroni correction for multiple testing was done.
📊 Figures

Figure 1
Rapid paravascular movement of lipophilic tracers.
(a) Experimental design for studying tracer (red) movement in paravascular space via cisterna magna. Inset: electron micrograph of penetrating arteriole (PA) with surrounding paravascular space (PVS)....
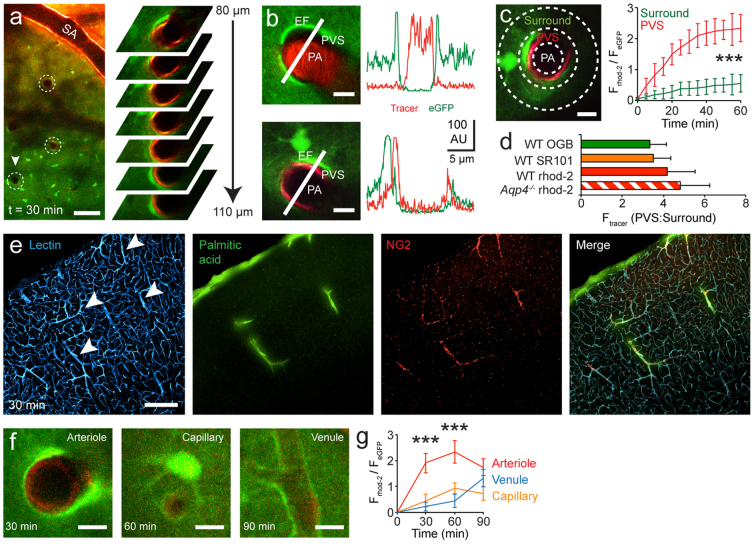
Figure 2
Lipophilic tracers selectively enter and exit brain via paravascular space surrounding arterioles and venules.
(a) Left: in vivo two-photon image of rhod-2 circulation via the paravascular space in Glt1 -eGFP mouse. White circles indicate penetrating arterioles. Surface artery (SA). Scale bar represents 100u20...
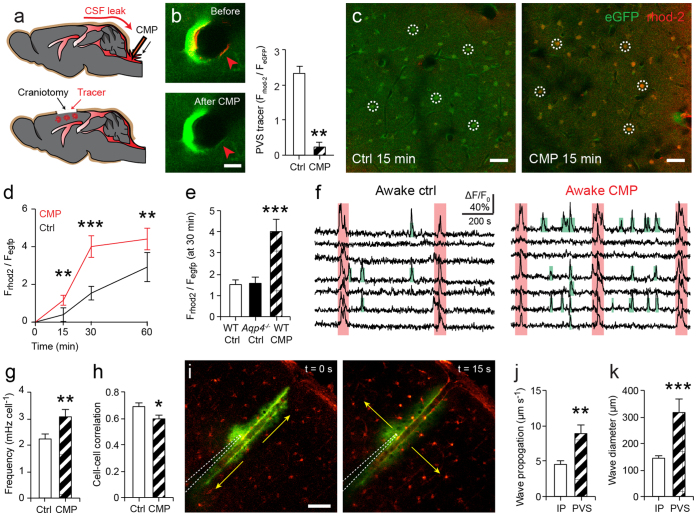
Figure 3
Depressurizing the paravascular space impairs lipid transport and astrocyte signaling.
(a) Cisterna magna puncture (CMP) temporarily depressurizes the paravascular space. Lipophilic tracer (rhod-2) was applied to cortical surface or injected into parenchyma to assess tissue influx. (b) ...
Figure images are served from the NIH/NLM PubMed Central Open Access Subset or Europe PMC; copyright remains with the publishers and authors.
💬 Discussion
0 commentsNo comments yet. Be the first to start a discussion!
Leave a Comment