Abstract
Topoisomerase 1 (Top1) is essential for removing the DNA supercoiling generated during replication and transcription. Anticancer drugs like camptothecin (CPT) and its clinical derivatives exert their cytotoxicity by reversibly trapping Top1 in covalent complexes on the DNA (Top1cc). Poly(ADP-ribose) polymerase (PARP) catalyses the addition of ADP-ribose polymers (PAR) onto itself and Top1. PARP inhibitors enhance the cytotoxicity of CPT in the clinical trials. However, the molecular mechanism by which PARylation regulates Top1 nuclear dynamics is not fully understood. Using live-cell imaging of enhanced green fluorescence tagged-human Top1, we show that PARP inhibitors (Veliparib, ABT-888) delocalize Top1 from the nucleolus to the nucleoplasm, which is independent of Top1-PARP1 interaction. Using fluorescence recovery after photobleaching and subsequent fitting of the data employing kinetic modelling we demonstrate that ABT-888 markedly increase CPT-induced bound/immobile fraction of Top1 (Top1cc) across the nuclear genome, suggesting Top1-PARylation counteracts CPT-induced stabilization of Top1cc. We further show Trp205 and Asn722 of Top1 are critical for subnuclear dynamics. Top1 mutant (N722S) was restricted to the nucleolus in the presence of CPT due to its deficiency in the accumulation of CPT-induced Top1-PARylation and Top1cc formation. This work identifies ADP-ribose polymers as key determinant for regulating Top1 subnuclear dynamics.
🔬 Techniques
🔭 Microscopes
✨ Fluorophores
🧪 Sample Preparation
🔬 Cell Lines
🏭 Microscope Brands
🧪 Reagent Suppliers
🔎 Objectives
🏛️ Research Organizations (ROR)
Affiliated research institutions:
📋 Methods
Drug and antibodies
CPT was purchased from Sigma (St Louis, MO, USA). PARP inhibitor Veliparib (ABT-888) was kindly gifted by Dr Yves Pommier (NIH/NCI).
Mouse monoclonal anti-human Top1
(C21) and anti-GFP (B-2) antibodies were from Santa Cruz Biotechnology (Santa Cruz, USA). Rabbit polyclonal anti-GFP (A-11122) antibody was from Invitrogen and anti-actin (ACTN05) antibody was from Neo Markers (USA). Rabbit polyclonal anti-nucleolin antibody (ab22758) was from Abcam (USA). The anti-PAR polymer mouse monoclonal (10H) and rabbit polyclonal antibodies were from Trevigen (USA). Rabbit polyclonal PARP1 antibody and secondary antibodies: horseradish peroxidase-conjugated anti-rabbit IgG or anti-mouse IgG were obtained from Santa Cruz Biotechnology (Santa Cruz, USA). Expression constructs and site-directed mutagenesis The EGFP-tagged human Top1 fusion construct ( 24 , 50 ) was a kind gift from Dr William T. Beck (University of Illinois, IL, USA). The following point mutations: EGFP–Top1 Y723F , EGFP–Top1 N722S and EGFP–Top1 W205G were constructed using the ‘QuikChange’ protocol (Stratagene, La Jolla, CA, USA). All constructs were confirmed by DNA sequencing. Cell culture, treatment and transfections The colon carcinoma cell line (HCT116) was obtained from the Developmental Therapeutics Program (NCI, NIH/USA). Cell cultures were maintained at 37°C under 5% CO 2 in Dulbecco's modified Eagle's medium containing 10% fetal calf serum (Life Technologies). Cells were either treated with different concentrations of CPT or PARP inhibitor Veliparib (ABT-888) or combination of both as described ( 32 , 51 ). For Confocal microscopy experiments, cells (60–70% confluent) were grown on glass bottom dish where CPT or ABT-888 was added to a final concentration of 1–10 μM as indicated. Plasmid DNAs were transfected with Lipofectamine 2000 (Invitrogen) according to the manufacturer's protocol. Cell extracts, immunoblotting and immunoprecipitation Preparation of whole cell extracts, immunoprecipitation and immunoblotting were carried out as described ( 32 , 51 , 52 ). Briefly, HCT116 cells ectopically expressing EGFP–Top1 WT , EGFP–Top1 Y723F , EGFP–Top1 N722S and EGFP–Top1 W205G were separately lysed in a lysis buffer (10 mM Tris–HCl (pH 8), 150 mM NaCl, 0.1% sodium dodecyl sulphate, 1% NP40, 0.5% Na-deoxycholate supplemented with complete protease inhibitors) and phosphatase inhibitors (Phosphatase Inhibitor Cocktail 1 from Sigma). After thorough mixing and incubation at 4°C for 2 h, lysates were then centrifuged at 12 000 g for 20 min at 4°C. Supernatants were collected and stored in aliquotes at −80°C. For immunoprecipitation, cells were lysed in a lysis buffer (50 mM Tris–HCl (pH 7.4), 300 mM NaCl, 0.4% NP-40, 10 mM MgCl 2 , 0.5 mM dithiothreitol supplemented with protease and phosphatase inhibitors). Supernatants of cell lysates were obtained by centrifugation at 15 000 g for 20 min at 4°C and pre-cleared with 50 μl of protein A/G-PLUS agarose beads (Santa Cruz, CA, USA). About 3–5 mg of pre-cleared lysate was incubated overnight at 4°C with indicated antibodies (2–5 mg/ml) and 50 μl of protein A/G-PLUS agarose beads. Isolated immunocomplexes were recovered by centrifugation, washed thrice with lysis buffer and were subjected to electrophoresis on 10% Tris-glycine gels and immunoblot analysis. Immunoblottings were carried out following standard procedures and immunoreactivity was detected using ECL chemiluminescence reaction (Amersham) under ChemiDoc™ MP System (Bio-Rad, USA). In vitro topoisomerase I relaxation assay Type I DNA topoisomerases are assayed by decreased mobility of the relaxed isomers of supercoiled pBS (SK + ) DNA in agarose gel. The relaxation assays were carried out as described ( 53 – 55 ), briefly HCT116 cells ectopically expressing EGFP–Top1 variants (EGFP–Top1 WT , EGFP–EGFP–Top1 N722S or EGFP–Top1 W205G ) were immunoprecipitated (IP) with anti-GFP antibody and the immune complexes were used as source of Top1 (EGFP–Top1 WT , EGFP–Top1 Y723F , EGFP–Top1 N722S or EGFP–Top1 W205G ) for the time course DNA relaxation experiments. The immune complexes with anti-IgG antibody served as control. The relaxation assays were performed in relaxation buffer (25 mM Tris–HCl, pH 7.5, 5% glycerol,0.5 mM Dithiothreitol (DTT), 10 mM MgCl 2 , 50 mM KCl, 25 mM ethylenediaminetetraacetic acid and 150 mg/ml bovine serum albumin) and supercoiled plasmid pBS (SK + ) DNA (85–95% were negatively supercoiled, with remainder being nicked circles). For all kinetic studies, the reaction mixtures containing the buffer and DNA were heated to 37°C before addition of the enzyme. The reactions were rapidly quenched using stop solution and kept on ice. The amount of supercoiled monomer DNA band florescence after ethidium bromide (EtBr) (0.5 mg/ml) staining was quantitated by using Bio-Rad ChemiDoc™ MP system under UV illumination (Bio-Rad Quantity One software).
Show full methods section
Drug and antibodies
CPT was purchased from Sigma (St Louis, MO, USA). PARP inhibitor Veliparib (ABT-888) was kindly gifted by Dr Yves Pommier (NIH/NCI).
Mouse monoclonal anti-human Top1
(C21) and anti-GFP (B-2) antibodies were from Santa Cruz Biotechnology (Santa Cruz, USA). Rabbit polyclonal anti-GFP (A-11122) antibody was from Invitrogen and anti-actin (ACTN05) antibody was from Neo Markers (USA). Rabbit polyclonal anti-nucleolin antibody (ab22758) was from Abcam (USA). The anti-PAR polymer mouse monoclonal (10H) and rabbit polyclonal antibodies were from Trevigen (USA). Rabbit polyclonal PARP1 antibody and secondary antibodies: horseradish peroxidase-conjugated anti-rabbit IgG or anti-mouse IgG were obtained from Santa Cruz Biotechnology (Santa Cruz, USA). Expression constructs and site-directed mutagenesis The EGFP-tagged human Top1 fusion construct ( 24 , 50 ) was a kind gift from Dr William T. Beck (University of Illinois, IL, USA). The following point mutations: EGFP–Top1 Y723F , EGFP–Top1 N722S and EGFP–Top1 W205G were constructed using the ‘QuikChange’ protocol (Stratagene, La Jolla, CA, USA). All constructs were confirmed by DNA sequencing. Cell culture, treatment and transfections The colon carcinoma cell line (HCT116) was obtained from the Developmental Therapeutics Program (NCI, NIH/USA). Cell cultures were maintained at 37°C under 5% CO 2 in Dulbecco's modified Eagle's medium containing 10% fetal calf serum (Life Technologies). Cells were either treated with different concentrations of CPT or PARP inhibitor Veliparib (ABT-888) or combination of both as described ( 32 , 51 ). For Confocal microscopy experiments, cells (60–70% confluent) were grown on glass bottom dish where CPT or ABT-888 was added to a final concentration of 1–10 μM as indicated. Plasmid DNAs were transfected with Lipofectamine 2000 (Invitrogen) according to the manufacturer's protocol. Cell extracts, immunoblotting and immunoprecipitation Preparation of whole cell extracts, immunoprecipitation and immunoblotting were carried out as described ( 32 , 51 , 52 ). Briefly, HCT116 cells ectopically expressing EGFP–Top1 WT , EGFP–Top1 Y723F , EGFP–Top1 N722S and EGFP–Top1 W205G were separately lysed in a lysis buffer (10 mM Tris–HCl (pH 8), 150 mM NaCl, 0.1% sodium dodecyl sulphate, 1% NP40, 0.5% Na-deoxycholate supplemented with complete protease inhibitors) and phosphatase inhibitors (Phosphatase Inhibitor Cocktail 1 from Sigma). After thorough mixing and incubation at 4°C for 2 h, lysates were then centrifuged at 12 000 g for 20 min at 4°C. Supernatants were collected and stored in aliquotes at −80°C. For immunoprecipitation, cells were lysed in a lysis buffer (50 mM Tris–HCl (pH 7.4), 300 mM NaCl, 0.4% NP-40, 10 mM MgCl 2 , 0.5 mM dithiothreitol supplemented with protease and phosphatase inhibitors). Supernatants of cell lysates were obtained by centrifugation at 15 000 g for 20 min at 4°C and pre-cleared with 50 μl of protein A/G-PLUS agarose beads (Santa Cruz, CA, USA). About 3–5 mg of pre-cleared lysate was incubated overnight at 4°C with indicated antibodies (2–5 mg/ml) and 50 μl of protein A/G-PLUS agarose beads. Isolated immunocomplexes were recovered by centrifugation, washed thrice with lysis buffer and were subjected to electrophoresis on 10% Tris-glycine gels and immunoblot analysis. Immunoblottings were carried out following standard procedures and immunoreactivity was detected using ECL chemiluminescence reaction (Amersham) under ChemiDoc™ MP System (Bio-Rad, USA). In vitro topoisomerase I relaxation assay Type I DNA topoisomerases are assayed by decreased mobility of the relaxed isomers of supercoiled pBS (SK + ) DNA in agarose gel. The relaxation assays were carried out as described ( 53 – 55 ), briefly HCT116 cells ectopically expressing EGFP–Top1 variants (EGFP–Top1 WT , EGFP–EGFP–Top1 N722S or EGFP–Top1 W205G ) were immunoprecipitated (IP) with anti-GFP antibody and the immune complexes were used as source of Top1 (EGFP–Top1 WT , EGFP–Top1 Y723F , EGFP–Top1 N722S or EGFP–Top1 W205G ) for the time course DNA relaxation experiments. The immune complexes with anti-IgG antibody served as control. The relaxation assays were performed in relaxation buffer (25 mM Tris–HCl, pH 7.5, 5% glycerol,0.5 mM Dithiothreitol (DTT), 10 mM MgCl 2 , 50 mM KCl, 25 mM ethylenediaminetetraacetic acid and 150 mg/ml bovine serum albumin) and supercoiled plasmid pBS (SK + ) DNA (85–95% were negatively supercoiled, with remainder being nicked circles). For all kinetic studies, the reaction mixtures containing the buffer and DNA were heated to 37°C before addition of the enzyme. The reactions were rapidly quenched using stop solution and kept on ice. The amount of supercoiled monomer DNA band florescence after ethidium bromide (EtBr) (0.5 mg/ml) staining was quantitated by using Bio-Rad ChemiDoc™ MP system under UV illumination (Bio-Rad Quantity One software).
Live-cell confocal microscopy and immunocytochemistry
Live-cell imaging was carried out as described previously ( 51 , 52 ), using confocal laser-scanning microscope (Leica TCS SP8) with a UV-laser and 63X/1.4 NA oil objective equipped with a heated environmental chamber set to 37°C with optimal CO 2 facility. Fluorophores were excited using a 488/514 nm argon laser line. All the EGFP–Top1 constructs were separately transfected in HCT116 cells cultured on cover glass bottom dish (Genetix, Biotech Asia Pvt. Ltd.) and were imaged for 24 h post-transfection under live cell confocal microscopy. Cells were treated with CPT, ABT-888 or combination of CPT + ABT-888 for 30 min with indicated concentrations. Nuclei were stained with Hoechst 33342 (Blue) (Sigma). Immunofluorescence staining and confocal microscopy were performed as described previously ( 51 , 52 ). Briefly, HCT116 cells ectopically expressing EGFP–Top1 WT treated with or without CPT were fixed with 4% paraformaldehyde for 10 min at room temperature. Primary antibodies against nucleolin and green fluorescent protein (GFP) were detected with anti-rabbit or anti-mouse IgG secondary antibodies labelled with Alexa 488/568 (Invitrogen). Cells were mounted in anti-fade solution with DAPI (Vector Laboratories, USA) and examined using a laser scanning confocal microscope. Images were collected and processed using the Leica software and sized in Adobe Photoshop 7.0. The percentage of cells displaying nucleolar fluorescence was determined with Adobe Photoshop 7.0 from at least 60–70 cells expressing individual EGFP–Top1 constructs. Photobleaching experiments Photobleaching experiments were carried out as described previously ( 32 , 51 ), using Andor Spining disc inverted confocal laser-scanning microscope equipped with a 60X/1.42 NA oil-immersion objective (Olympus). Fluorophores were excited using a 488 nm laser line. The microscope was equipped with a CO 2 -controlled on-stage heated environmental chamber set to 37°C. FRAP analyses were carried out with living HCT116 cells grown on chamber cover glass (Genetix, Biotech Asia Pvt. Ltd.). Cells were transfected with EGFP fusion proteins and mounted on an incubation chamber filled with medium 24 h after transfection. Cells were treated with different concentrations of CPT, PARP inhibitor (ABT-888) or combination of CPT + ABT-888 as indicated. For FRAP analysis, a subnuclear spot was bleached for 30 ms by solid state laser line (488 nm for EGFP) adapted to the fluorescent protein of interest. For imaging, the laser power was attenuated to 0.1% of the bleach intensity. Subsequently, the recovery of fluorescence in the spot was continuously monitored for ∼90 s at 3 ms intervals. Relative fluorescence intensities of the bleached region were corrected for background. To show the FRAP curves, the fluorescence signal measured in a region of interest (ROI) was individually normalized to the pre-bleach signal in the ROI according to the following equation: ROI = (I t -I bg )/(I o -I bg ) × 100, where I o is the intensity in the ROI during pre-bleach, I t is the intensity in the ROI at time point t and I bg is the background signal determined in a region outside of the cell nucleus.
FRAP kinetic modelling and fitting
Analysis of FRAP data were performed by fitting them according to the general kinetic model of FRAP recovery that incorporates both free diffusion of the protein and binding of protein to other cellular components. In our present study the protein is Top1 (EGFP-tagged) and the binding partner is DNA. During DNA relaxation, Top1 binds DNA non covalently (during Top1 anchoring on the DNA) followed by transient covalent binding (nucleophilic attack by the hydroxyl group of the active site tyrosine on the scissile phosphate resulting in covalent attachment of Top1 to the 3′ end of the broken strand i.e. Top1–DNA cleavage complexes; Top1cc) and finally religation of the DNA strand and release of the enzyme ( 2 , 13 ). The dissociation timescale of strongly bound complex (irreversible Top1cc) in the presence of specific inhibitors (CPT) is generally very high and does not contribute to the recovery process. Therefore, we only consider the weak binding reaction and free diffusion of Top1 are the only two factors contributing towards recovery. In this situation, the equation for time dependent normalized FRAP can be written as ( 48 , 49 ), (1) documentclass[12pt]{minimal} usepackage{amsmath} usepackage{wasysym} usepackage{amsfonts} usepackage{amssymb} usepackage{amsbsy} usepackage{upgreek} usepackage{mathrsfs} setlength{oddsidemargin}{-69pt} begin{document} }{}begin{eqnarray*} &&{rm frap}(t) = nonumber \ &&{a_o}left[ {{e^{ - frac{{{tau _D}}}{{2t}}}}left{ {{I_0}left( {frac{{{tau _D}}}{{2t}}} right) + {I_1}left( {frac{{{tau _D}}}{{2t}}} right)} right}} right] + {a_1}left( {1 - {e^{ - frac{t}{{{tau _{{rm dis}({rm wb})}}}}}}} right) end{eqnarray*}end{document} Where, frap(t) represents normalized intensity of ROI or bleached point after photobleaching at time t. a o is the diffusion fraction, a 1 is the fraction of weakly bound molecule. τ D is the diffusion time and τ dis(wb) is the dissociation time for weak bound molecule ( k off = 1/τ dis ). I o and I 1 are the basal function. (1-a o -a 1 ) is the bound (immobile) fraction which corresponds to the fraction of strongly bound Top1 which does not contribute to the recovery. Using the value of documentclass[12pt]{minimal} usepackage{amsmath} usepackage{wasysym} usepackage{amsfonts} usepackage{amssymb} usepackage{amsbsy} usepackage{upgreek} usepackage{mathrsfs} setlength{oddsidemargin}{-69pt} begin{document} }{}${tau _D}$end{document} (diffusion time), we estimated the diffusion coefficient of the free Top1 as, documentclass[12pt]{minimal} usepackage{amsmath} usepackage{wasysym} usepackage{amsfonts} usepackage{amssymb} usepackage{amsbsy} usepackage{upgreek} usepackage{mathrsfs} setlength{oddsidemargin}{-69pt} begin{document} }{}begin{equation*}{tau _D} = frac{{{omega ^2}}}{{4D}}end{equation*}end{document} where, ω 2 is the ROI area and D is diffusion coefficient.
📊 Figures
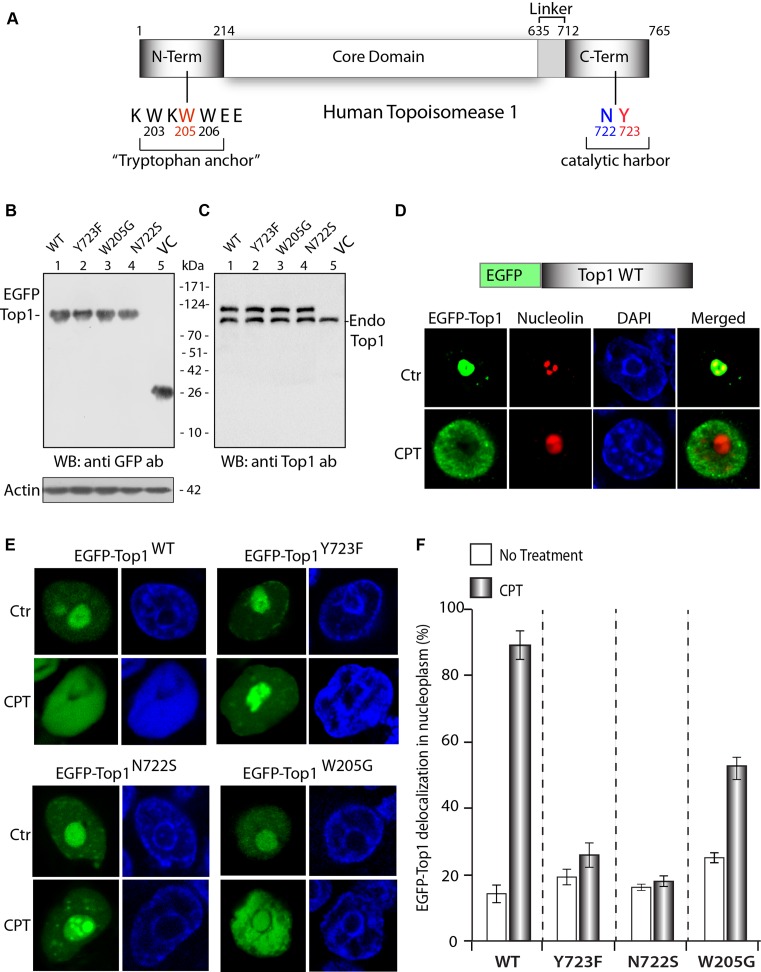
Figure 1.
Differential nuclear dynamics of enhanced green fluorescence (EGFP)u2013Top1 variants in live cell. ( A ) Schematic representation of human Top1 organized into four domains: N-terminal domain (1u20132...
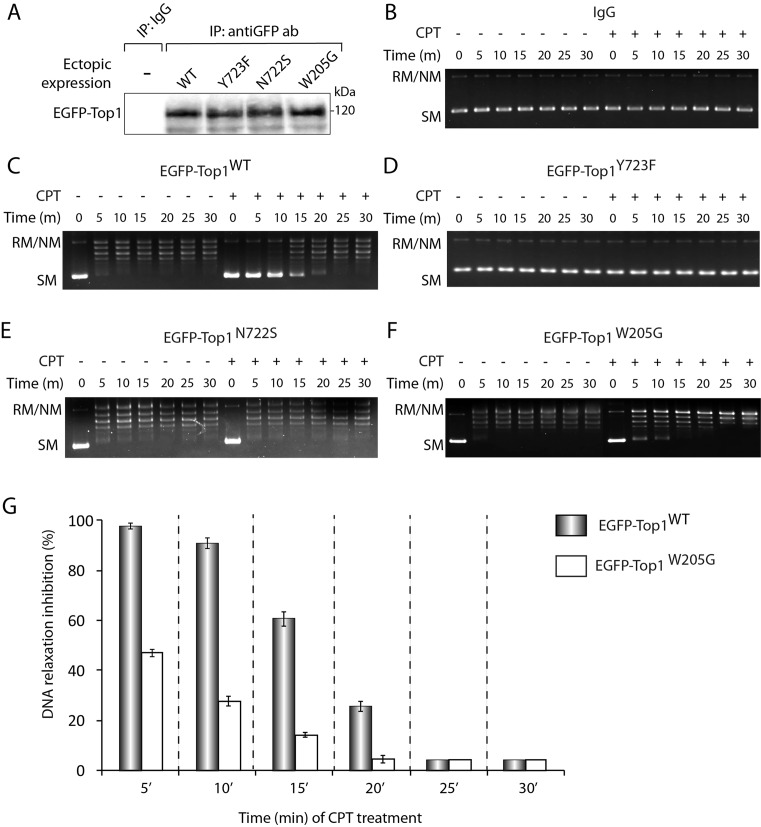
Figure 2.
Effect of CPT on the plasmid DNA relaxation activity of EGFPu2013Top1 variants. ( A ) EGFP-tagged wild-type (WT) and mutant (Y723F, N722S, W205G) Top1 constructs were ectopically expressed in HCT116 c...
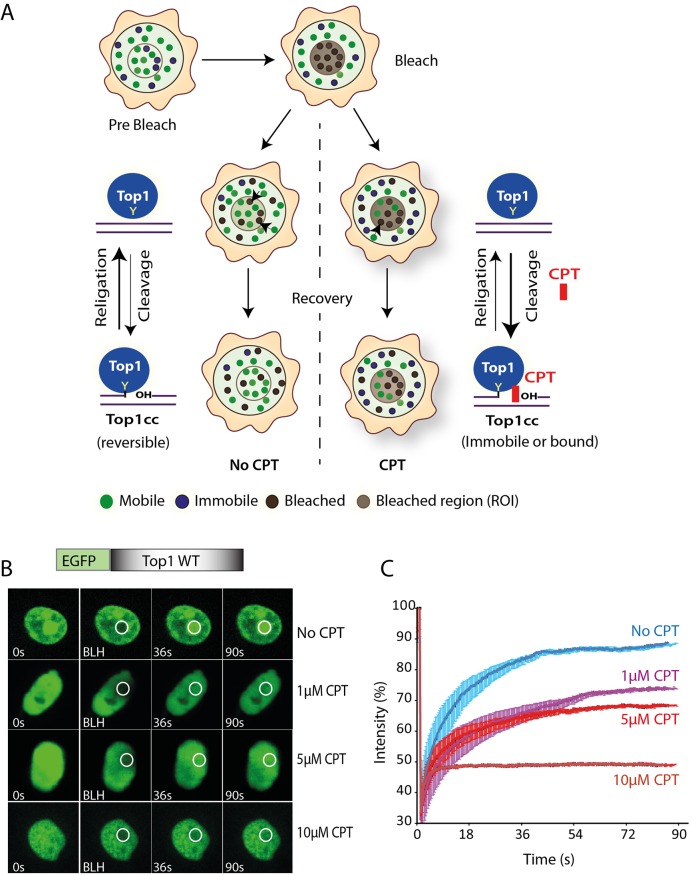
Figure 3.
CPT accumulates immobile/bound Top1 in the nucleus. ( A ) Cartoon representing live cells Top1 dynamics in the presence and absence of CPT. Fluorescence tagged-human Top1 was evaluated with fluorescen...
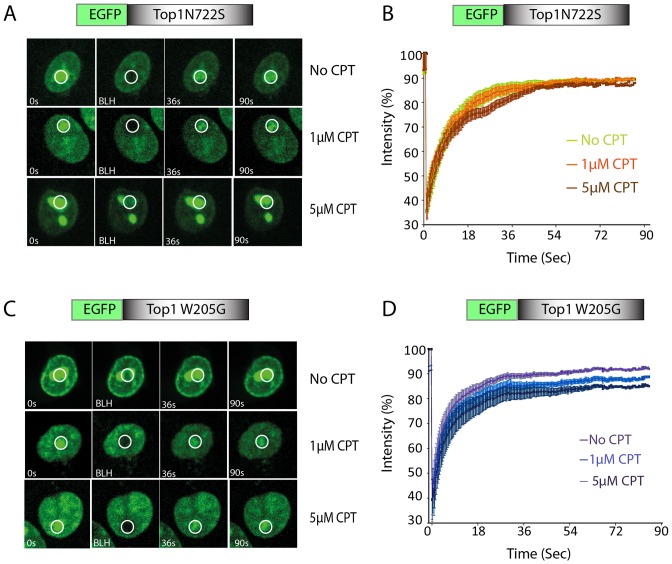
Figure 4.
Top1 W205 and N722 residues are critical for CPT-induced nuclear dynamics. Representative images showing the FRAP of Top1mutants ( A ) EGFPu2013Top1 N722S or ( C ) EGFPu2013Top1 W205G transiently expr...
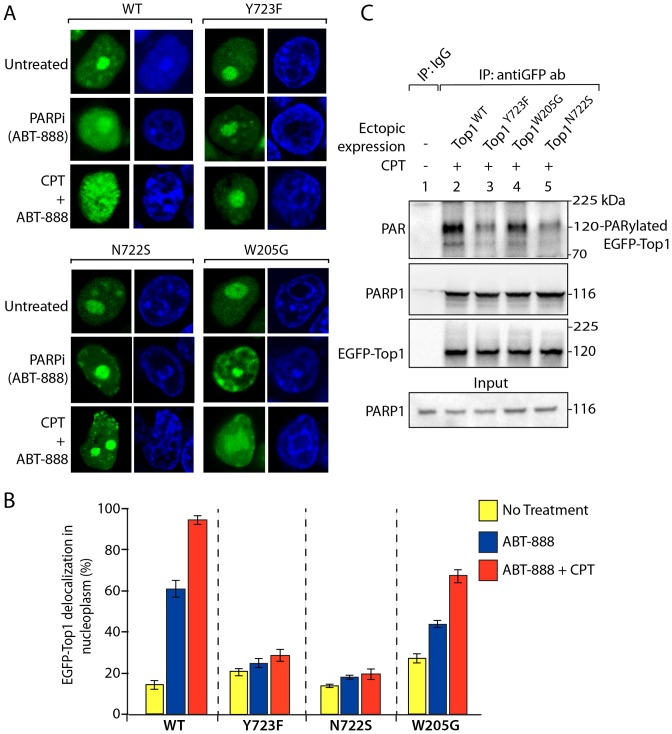
Figure 5.
(ADP)ribose polymers regulate Top1 subnuclear distribution. ( A ) Representative live cell images showing nucleolar delocalization of ectopic EGFPu2013Top1 WT when treated with PARP inhibitor (ABT-888...
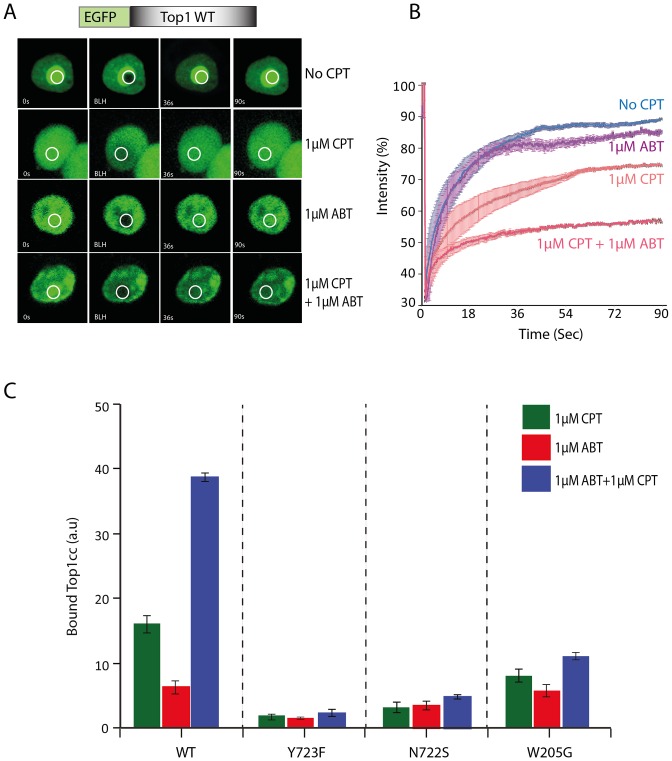
Figure 6.
PARP inhibitor (ABT-888) promotes CPT-induced prolong Top1 trapping across nuclear genome. ( A ) Representative images showing the FRAP of WT Top1 (EGFPu2013Top1 WT ) transiently expressed in HCT116 c...
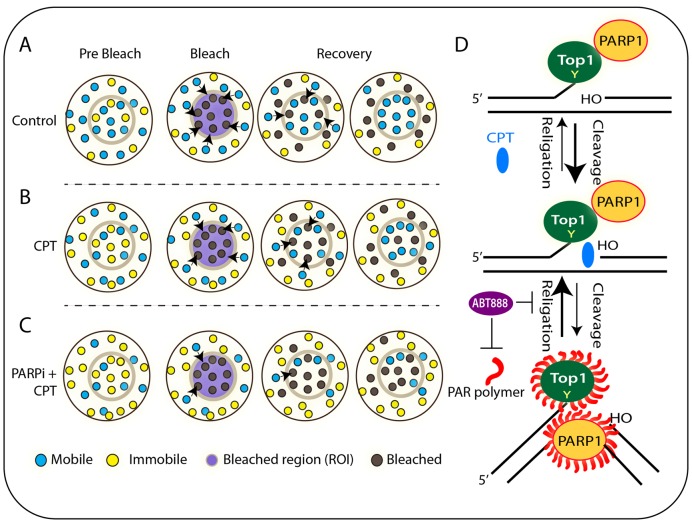
Figure 7.
Schematic representation of our findings regarding the Top1 dynamics in live cells and response to combination of PARP inhibitor (ABT-888) plus CPT as established by FRAP. ( A ) Cartoon representing a...
Figure images are served from the NIH/NLM PubMed Central Open Access Subset or Europe PMC; copyright remains with the publishers and authors.
💬 Discussion
0 commentsNo comments yet. Be the first to start a discussion!
Leave a Comment