Abstract
As an essential characterization, size distribution is an important indicator for the synthesis, optimization, and application of nanoparticles. Electron microscopes such as transmission electron microscopes (TEMs) are commonly utilized to collect size information on nanoparticles. However, the current popular statistical method of manually measuring large particles one by one, using a ruler tool in the corresponding image analysis software is time-consuming and can introduce manual errors. Moreover, it is difficult to determine the measurement interval for irregularly shaped nanoparticles. Therefore, it is necessary to use an efficient and standard method to perform size distribution analysis of nanoparticles. In this work, we use basic ImageJ software (1.53 t) to analyze the size of typical silica nanoparticles in a TEM image and use Origin software to process the data, to obtain its accurate distribution quickly. Using it as a template, we believe that this work can provide a paradigm for the standardized analysis of nanoparticle size.
🔬 Techniques
🧪 Reagent Suppliers
💻 Software Details
🏛️ Research Organizations (ROR)
Affiliated research institutions:
📋 Methods
2. Experimental Design 2.1. Materials, Devices, and Software Tetraethyl orthosilicate (TEOS), NH 3 ·H 2 O (30%), and ethanol were all purchased from Sigma Aldrich (St. Louis, MO, USA); water was obtained from a deionized water system. A magnetic stirring bar and a 250 mL beaker with a stirring station (Isotemp™ Hot Plate Stirrer, ambient to 400 °C, ceramic) were purchased from Fisher Scientific (Waltham, MA, USA).
Transmission electronic microscope
(TEM) images were obtained from a TEM system (Hitachi 7600 TEM, Hitachi, Tokyo, Japan) with an accelerating voltage of 75 keV. For ImageJ and Origin, each historic version was available; here ImageJ 1.53 t bundled with 64-bit and Origin 9.1 32-bit were used to analyze the size distributions from TEM images. 2.2.
Synthesis of Silica Nanoparticles
The synthesis of SiO 2 nanoparticles relies on the classic Stöber process [ 8 ] with some improvements: firstly, 1 mL TEOS is mixed with 9 mL ethanol to form Solution A, and 9 mL NH 3 ·H 2 O is added into 90 mL ethanol to prepare Solution B. Thereafter, add 9 mL Solution A into Solution B drop by drop, keep stirring (stirring speed is 400 rpm) in room temperature for 20 min, then the mixture solution is collected and centrifuged three times with water (at 10,000 rpm, 10 min). 2.3.
Characterization of Silica Nanoparticles
After the synthesis, the SiO 2 nanoparticles are re-dispersed into ethanol to increase their dispersion and dropped onto the copper mesh for TEM characterization. The image with excellent dispersion is selected as the purpose sample for further analysis.
2.1. Materials, Devices, and Software Tetraethyl orthosilicate (TEOS), NH 3 ·H 2 O (30%), and ethanol were all purchased from Sigma Aldrich (St. Louis, MO, USA); water was obtained from a deionized water system. A magnetic stirring bar and a 250 mL beaker with a stirring station (Isotemp™ Hot Plate Stirrer, ambient to 400 °C, ceramic) were purchased from Fisher Scientific (Waltham, MA, USA).
Show full methods section
2. Experimental Design 2.1. Materials, Devices, and Software Tetraethyl orthosilicate (TEOS), NH 3 ·H 2 O (30%), and ethanol were all purchased from Sigma Aldrich (St. Louis, MO, USA); water was obtained from a deionized water system. A magnetic stirring bar and a 250 mL beaker with a stirring station (Isotemp™ Hot Plate Stirrer, ambient to 400 °C, ceramic) were purchased from Fisher Scientific (Waltham, MA, USA).
Transmission electronic microscope
(TEM) images were obtained from a TEM system (Hitachi 7600 TEM, Hitachi, Tokyo, Japan) with an accelerating voltage of 75 keV. For ImageJ and Origin, each historic version was available; here ImageJ 1.53 t bundled with 64-bit and Origin 9.1 32-bit were used to analyze the size distributions from TEM images. 2.2.
Synthesis of Silica Nanoparticles
The synthesis of SiO 2 nanoparticles relies on the classic Stöber process [ 8 ] with some improvements: firstly, 1 mL TEOS is mixed with 9 mL ethanol to form Solution A, and 9 mL NH 3 ·H 2 O is added into 90 mL ethanol to prepare Solution B. Thereafter, add 9 mL Solution A into Solution B drop by drop, keep stirring (stirring speed is 400 rpm) in room temperature for 20 min, then the mixture solution is collected and centrifuged three times with water (at 10,000 rpm, 10 min). 2.3.
Characterization of Silica Nanoparticles
After the synthesis, the SiO 2 nanoparticles are re-dispersed into ethanol to increase their dispersion and dropped onto the copper mesh for TEM characterization. The image with excellent dispersion is selected as the purpose sample for further analysis.
2.1. Materials, Devices, and Software Tetraethyl orthosilicate (TEOS), NH 3 ·H 2 O (30%), and ethanol were all purchased from Sigma Aldrich (St. Louis, MO, USA); water was obtained from a deionized water system. A magnetic stirring bar and a 250 mL beaker with a stirring station (Isotemp™ Hot Plate Stirrer, ambient to 400 °C, ceramic) were purchased from Fisher Scientific (Waltham, MA, USA).
Transmission electronic microscope
(TEM) images were obtained from a TEM system (Hitachi 7600 TEM, Hitachi, Tokyo, Japan) with an accelerating voltage of 75 keV. For ImageJ and Origin, each historic version was available; here ImageJ 1.53 t bundled with 64-bit and Origin 9.1 32-bit were used to analyze the size distributions from TEM images.
3. Procedure The TEM image of SiO 2 nanoparticles is shown in Figure 1 , which shows the uniform size of SiO 2 nanoparticles and excellent dispersion. The size of SiO 2 nanoparticles is roughly estimated to be below 100 nm, but a more accurate value cannot be obtained through visual judgment alone. To analyze the image, ImageJ software is used. Firstly, open ImageJ software and import the image ( Figure 2 A), then click on the Analyze and Set Measurements buttons in turn, to set corresponding parameters ( Figure 2 B). The Area option is selected as the analysis object to measure the square of particles ( Figure 2 C). It is worth mentioning that if your particles are irregular, you can also click the Feret’s diameter button as a parameter to obtain a solid value for particle diameter. After that, the size of the nanoparticle should be synchronously mapped into the parameter of ImageJ . Firstly, the photo is magnified in the scale bar section as much as possible, and a straight line is drawn with the same length as the scale bar ( Figure 2 D). Then, click the Analyze and Set Scale buttons in turn to set it, change the Known Distance value to the scale bar length value (it is 500 nm in this image, so we input 500) and set Unit of Length as “nm” ( Figure 2 E). This process allows for a more precise analysis of the nanoparticle size by using advanced software tools. By mapping the size of the nanoparticle into the parameter of ImageJ , we can achieve a level of accuracy that was previously unattainable through visual judgment alone. After importing the image into ImageJ and setting the parameters, the next step is to adjust the image format and threshold value. Click the Image and Type in turn, select 8-bit as image format ( Figure 3 A), then click Image, Adjust, and Threshold in turn to set the threshold value ( Figure 3 B); usually, we use the system default value, so just click Set and OK in turn ( Figure 3 C). By this point, the nanoparticles are separated from the background due to their different brightness and contrast. Then, we can analyze the size distribution of silica nanoparticles by clicking on Analyze and Analyze particles in turn ( Figure 3 D), setting Size from 1000 (if you set zero as the value, other impurities may also be calculated and influence the results, so some the minimum value should be set to avoid the situation, depending on your trial) to infinity ( Figure 3 E), then click OK, obtain the results of individual area (square) and the number of the corresponding nanoparticles ( Figure 3 F). Here, we obtained 276 nanoparticles and their individual squares. This process allows for a more precise analysis of the size distribution of silica nanoparticles by using advanced software tools. By adjusting the image format and threshold value, we can separate the nanoparticles from the background and accurately analyze their size distribution. After analyzing the square of silica nanoparticles using ImageJ , the diameter size of the nanoparticles can be further analyzed using Origin software. Firstly, copy individual area values to the Origin workbook, the numbers are set as x value, the squares are set as y value ( Figure 4 A), and abnormal values should be deleted ( Figure 4 B and its inner Figure, in the TEM image, few particles linked together and are counted as one, so this kind of particles should be removed to increase the accuracy of calculation), then, we need to obtain the diameter values from area (square) values, here we click another column in the workbook (that is Column C)and Set Column Values in turn, according to the simple square-diameter formula of round: (1) S = π r 2 = π ( d 2 ) 2 d = 2 × S / π set Column C as the diameter value ( Figure 4 C). Then, click the Column C, Plot, Statistics, and Histogram in turn ( Figure 4 D) to obtain a histogram of the values ( Figure 4 E), optimize the histogram, and obtain the results. The average diameter of particles is calculated by dividing the sum of all available particle sizes by the total number of available particles. This information is then used to generate the final diagram, as shown in Figure 4 F. From the results, we can deduce that the average size of the silica nanoparticles is 70.6 nm, and it has a narrow size distribution that fits the Gauss Curve, showing its excellent distribution property. This process allows for a more precise analysis of the size of silica nanoparticles by using advanced software tools. By combining the power of ImageJ and Origin , we can achieve a level of accuracy that was previously unattainable through manual measurement alone.
4.
Protocol
Limitations and Further Applications This method is most effective when used on regular and un-agglomerated particles, such as the round and dispersed silica nanoparticles in this work. By analyzing these kinds of nanoparticles, we can obtain a uniform diameter for each particle, rather than one of the specific diameters (maybe the maximum or minimum diameter) obtained manually, which may select the diameter deliberately or induce a significant error unintentionally. For irregular particles, the Feret’s diameter setting in ImageJ (this parameter can be set in Figure 2 C, below the Set Measurements button) can be used to address this issue, though it cannot provide a uniform diameter, but only a specific diameter for each particle. However, this method is not suitable for analyzing aggregated nanoparticles due to the lack of an aggregated particle discrimination function in ImageJ [ 9 ]. In the future, artificial intelligence used in image processing software may be able to solve this problem to improve the utility of this method [ 10 ]. Besides shape and distribution, contrast is another important indicator, as it decides whether the particles can be separated effectively from the background. In this case, some low-contrast particles may not be suitable, such as lipid particles or vesicles. In addition to nanoparticle size analysis, this method can also be applied to the size analysis of other small particles or particle analogs, such as microparticles and even bacteria and cells obtained from optical microscope images; for bacteria and cell analysis, we believe that staining them is the most suitable means to distinguish them from the background in processing. Except for those used for TEM images, the images obtained from other electron microscopes such as SEM or AFM can also be analyzed by using the same method.
📊 Figures
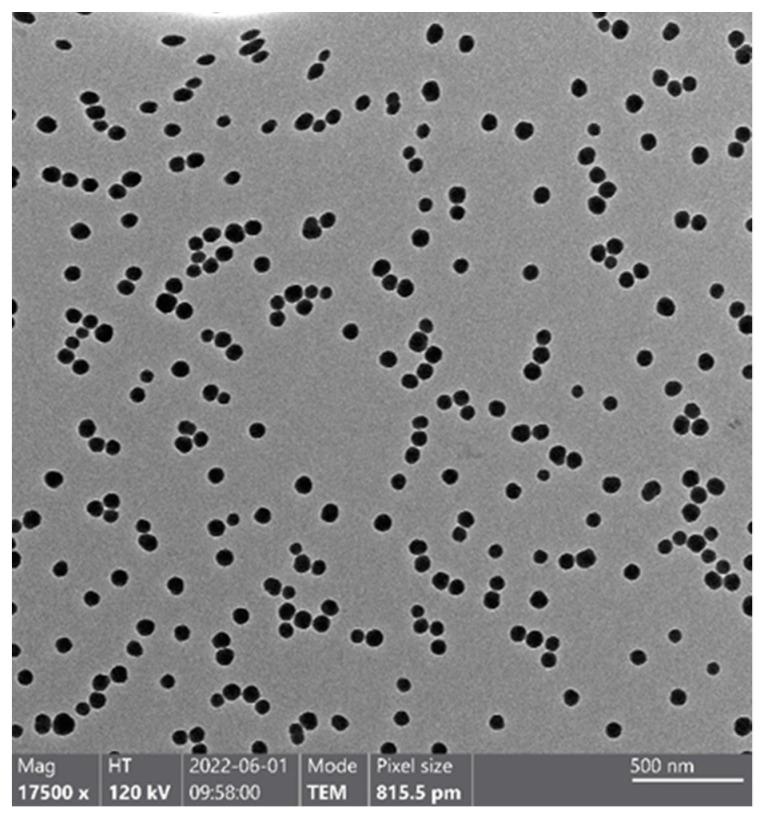
Figure 1
TEM image of SiO 2 nanoparticles. It shows nanoscale, uniform (non-aggregation), and high-contrast (from background) silica nanoparticles, which is suitable for the following analysis.
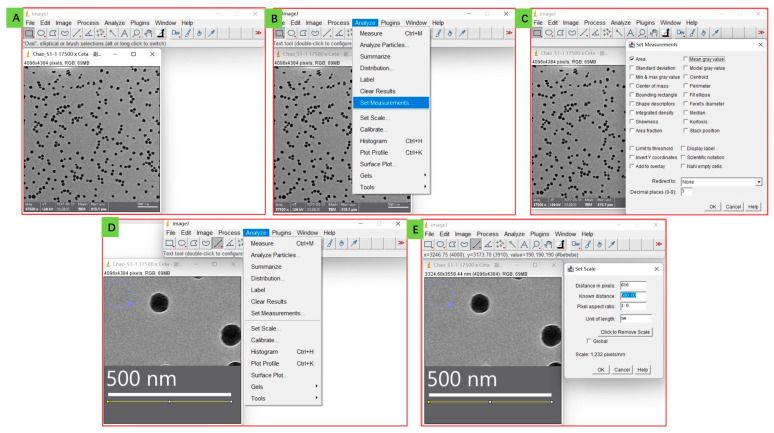
Figure 2
Analysis by ImageJ software: from importing the image ( A ) to setting measurement parameters ( B , C ) to calibrating the scale bar ( D , E ).
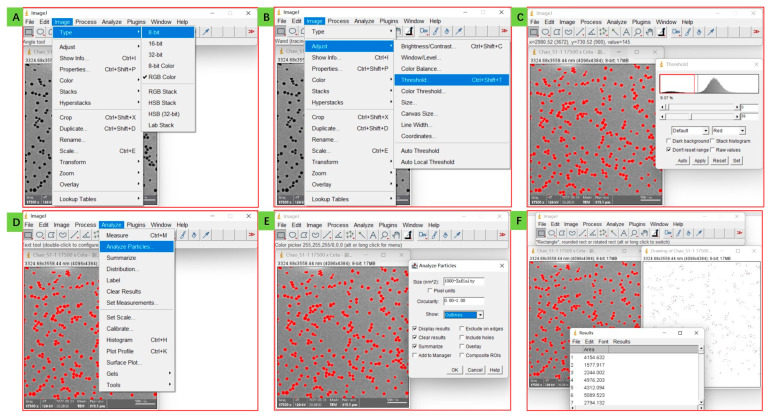
Figure 3
Analysis by ImageJ software: adjust the image format ( A ), separate nanoparticles from the background ( B , C ), and analyze and obtain the square values of each nanoparticle ( D u2013 F ).
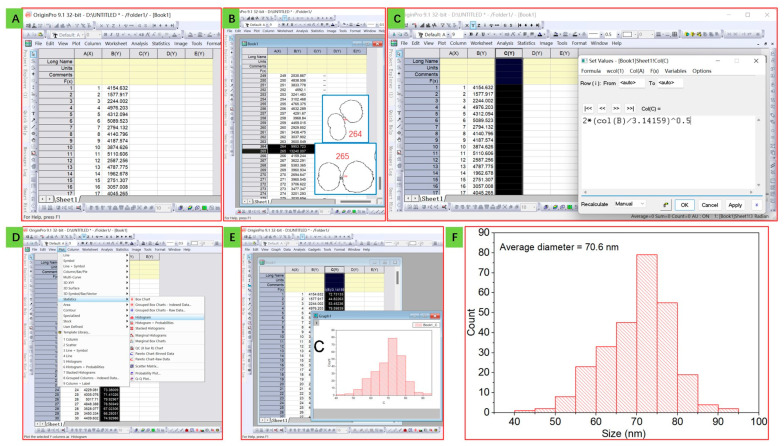
Figure 4
Analysis using Origin software: import the data from results of ImageJ ( A ), delete wrong values of linked particles ( B ), calculate the diameter using the diameter-square equation ( C ), and obtain...
Figure images are served from the NIH/NLM PubMed Central Open Access Subset or Europe PMC; copyright remains with the publishers and authors.
💬 Discussion
0 commentsNo comments yet. Be the first to start a discussion!
Leave a Comment