Abstract
Cellularized collagen gels are a common model in tissue engineering, but the relationship between the microstructure and bulk mechanical properties is only partially understood. Multiphoton microscopy (MPM) is an ideal non-invasive tool for examining collagen microstructure, cellularity and crosslink content in these gels. In order to identify robust image parameters that characterize microstructural determinants of the bulk elastic modulus, we performed serial MPM and mechanical tests on acellular and cellularized (normal human lung fibroblasts) collagen hydrogels, before and after glutaraldehyde crosslinking. Following gel contraction over 16 days, cellularized collagen gel content approached that of native connective tissues (∼200 mg ml⁻¹). Young's modulus (E) measurements from acellular collagen gels (range 0.5-12 kPa) exhibited a power-law concentration dependence (range 3-9 mg ml⁻¹) with exponents from 2.1 to 2.2, similar to other semiflexible biopolymer networks such as fibrin and actin. In contrast, cellularized collagen gel stiffness (range 0.5-27 kPa) produced concentration-dependent exponents of 0.7 uncrosslinked and 1.1 crosslinked (range ∼5-200 mg ml⁻¹). The variation in E of cellularized collagen hydrogels can be explained by a power-law dependence on robust image parameters: either the second harmonic generation (SHG) and two-photon fluorescence (TPF) (matrix component) skewness (R²=0.75, exponents of -1.0 and -0.6, respectively); or alternatively the SHG and TPF (matrix component) speckle contrast (R²=0.83, exponents of -0.7 and -1.8, respectively). Image parameters based on the cellular component of TPF signal did not improve the fits. The concentration dependence of E suggests enhanced stress relaxation in cellularized vs. acellular gels. SHG and TPF image skewness and speckle contrast from cellularized collagen gels can predict E by capturing mechanically relevant information on collagen fiber, cell and crosslink density.
🔬 Techniques
🔭 Microscopes
💻 Software
✨ Fluorophores
🧪 Sample Preparation
🔬 Cell Lines
🏭 Microscope Brands
🧪 Reagent Suppliers
🔴 Lasers
🔎 Objectives
💻 Software Details
🏛️ Research Organizations (ROR)
Affiliated research institutions:
📋 Methods
Acellular collagen hydrogels Acellular collagen hydrogels were prepared as previously described at pH 6.5, creating coarse-structured gels with large fiber diameters and large pores [ 16 ]. Final gel preparations contained 0.9 ml of 3-9 mg/ml collagen, and were allowed to polymerize at room temperature for 24 hours before mechanical testing and imaging. For mechanical (indentation) testing, the samples remained in the original polymerization chambers (12-well glass bottom plate, MatTek Corporation, Ashland, MA) thus avoiding irreversible gel deformation. After glutaraldehyde (GTA) crosslinking (room temperature, 4% GTA/PBS, 24 hours) and extensive rinses with PBS to remove unreacted GTA, the gels were again tested via indentation. Cellularized collagen gels Cellularized collagen gels were prepared similarly to acellular gels, except after all other components were mixed on ice and pH was adjusted to 6.5 with a small amount of sodium hydroxide, 50,000 normal human lung fibroblasts (NHLFs, passages 3-7, Lonza, Basel, Switzerland) were added per ml of a 4 mg/ml collagen solution. The NHLFs had undergone monolayer culture to 70-80% confluency under standard tissue culture conditions as previously described [ 18 ]. 0.5 ml of the collagen-NHLF solution was pipetted into wells of two 24-well plates (Corning) and allowed to polymerize at room temperature (24 °C) for one hour, creating 16 tissue contructs. After one hour, excess DMEM was added and changed several times during the first day of culture to ensure equilibration to pH 7.4. The constructs were cultured in DMEM overnight, and then released from the wells using a sterile spatula, placed in 13.5 cm-diameter Petri dishes, and covered with DMEM supplemented with 10% fetal bovine serum (FBS, Sigma, St. Louis, MO). These floating gels were cultured in standard conditions for sixteen days, during which time gels were periodically removed from the Petri dishes using a spoon-shaped sterile spatula for imaging and mechanical testing. In a second experiment, cellularized gels were prepared identically except the polymerization occurred at pH 9.5, which produces a collagen network with more, smaller diameter fibers [ 16 ]. These gels were cultured for 12 days in identical conditions, except for some gels DMEM media plus 10% FBS was supplemented with additional soluble factors: 2 ng/ml TGF-β2, 35 pg/ml PGE2, or 10 μM GM6001. TGF-β2 has been shown to affect alpha-smooth muscle actin [ 19 ] and tenascin expression, as well as SHG signal from a lung fibroblast-seeded collagen gel construct [ 8 ], and has been shown to enhance lung fibroblast proliferation and matrix synthesis [ 20 ]. In contrast, PGE2 has negative effects on lung fibroblast proliferation and matrix synthesis [ 21 - 23 ]. GM6001 is an inhibitor of MMP-1,2,3,8, and 9, and is known to inhibit lung fibroblast mediated collagen gel contraction [ 24 ]. In a third experiment, cellularized gels were prepared identically to the time-course experiment except that some gels were polymerized with 25 μg/ml DQ collagen (type I from bovine skin, fluorescein conjugate, Invitrogen, Carlsbad, CA). After one week of floating culture, as described above, the gels were imaged with a confocal fluorescence feature of the Zeiss LSM 510Meta, with excitation wavelength of 488 nm and emission filter of 500-550 nm. GTA crosslinking of some of the cellularized gels occurred after initial imaging and mechanical testing. Gels were incubated at room temperature in 4% GTA/PBS for 24 hours, and then washed for several hours with 3-5 × 50 ml PBS. Estimated collagen concentration ( c , mg/ml) was calculated by dividing initial collagen mass in the gels (2 mg) by gel volume calculated from caliper measurements of gel height ( h, mm ) , and diameter ( d, mm ) , according to the following relation: c = 2 ∕ ( π d 2 h 4 ) ∕ 1000 . Multiphoton microscopy A LSM 510 Meta multiphoton microscope (Zeiss, Jena, Germany) was used for all imaging experiments. All SHG and TPF signals were collected in the epi-configuration with an Achroplan 40×/0.8 NA water-immersion objective (Zeiss). Each 12-bit image contained 512×512 pixels, and each pixel was ~440×440 nm. Pixel sampling rate was 625 kHz; pixel dwell time was 1.6 μs. Cellularized collagen gels were placed on 22×50 mm No. 1 coverslips (170 μm thickness) for imaging. Multiphoton signals were produced by a circularly-polarized Chameleon laser tuned to 780 nm. Power before the objective was ~102 mW, and at the sample focus ~92 mW. The SHG signal was collected using the instrument’s Meta detector, with wavelength cutoff points set at 383 nm and 405 nm, whereas the TPF signal was collected with an infrared-blocking 500-550 nm bandpass filter. At this excitation (780 nm), TPF emission at 500-550 is restricted mainly to: glutaraldehyde [ 15 ] and pyridinium-type crosslinks [ 25 , 26 ] in collagen; and NADH, FAD, riboflavin and other vitamin-derived fluorophores in cells [ 27 , 28 ], whereas the SHG signal is specific for collagen. SHG images with signal averaged over 16 frames were collected within the first 10 μm from the tissue surface in the region of highest SHG signal (before depth-dependent decay) to provide the best assessment of collagen microstructure. Five single image frames were collected per tissue (with lateral separation of 1.1 mm).
Show full methods section
Acellular collagen hydrogels Acellular collagen hydrogels were prepared as previously described at pH 6.5, creating coarse-structured gels with large fiber diameters and large pores [ 16 ]. Final gel preparations contained 0.9 ml of 3-9 mg/ml collagen, and were allowed to polymerize at room temperature for 24 hours before mechanical testing and imaging. For mechanical (indentation) testing, the samples remained in the original polymerization chambers (12-well glass bottom plate, MatTek Corporation, Ashland, MA) thus avoiding irreversible gel deformation. After glutaraldehyde (GTA) crosslinking (room temperature, 4% GTA/PBS, 24 hours) and extensive rinses with PBS to remove unreacted GTA, the gels were again tested via indentation. Cellularized collagen gels Cellularized collagen gels were prepared similarly to acellular gels, except after all other components were mixed on ice and pH was adjusted to 6.5 with a small amount of sodium hydroxide, 50,000 normal human lung fibroblasts (NHLFs, passages 3-7, Lonza, Basel, Switzerland) were added per ml of a 4 mg/ml collagen solution. The NHLFs had undergone monolayer culture to 70-80% confluency under standard tissue culture conditions as previously described [ 18 ]. 0.5 ml of the collagen-NHLF solution was pipetted into wells of two 24-well plates (Corning) and allowed to polymerize at room temperature (24 °C) for one hour, creating 16 tissue contructs. After one hour, excess DMEM was added and changed several times during the first day of culture to ensure equilibration to pH 7.4. The constructs were cultured in DMEM overnight, and then released from the wells using a sterile spatula, placed in 13.5 cm-diameter Petri dishes, and covered with DMEM supplemented with 10% fetal bovine serum (FBS, Sigma, St. Louis, MO). These floating gels were cultured in standard conditions for sixteen days, during which time gels were periodically removed from the Petri dishes using a spoon-shaped sterile spatula for imaging and mechanical testing. In a second experiment, cellularized gels were prepared identically except the polymerization occurred at pH 9.5, which produces a collagen network with more, smaller diameter fibers [ 16 ]. These gels were cultured for 12 days in identical conditions, except for some gels DMEM media plus 10% FBS was supplemented with additional soluble factors: 2 ng/ml TGF-β2, 35 pg/ml PGE2, or 10 μM GM6001. TGF-β2 has been shown to affect alpha-smooth muscle actin [ 19 ] and tenascin expression, as well as SHG signal from a lung fibroblast-seeded collagen gel construct [ 8 ], and has been shown to enhance lung fibroblast proliferation and matrix synthesis [ 20 ]. In contrast, PGE2 has negative effects on lung fibroblast proliferation and matrix synthesis [ 21 - 23 ]. GM6001 is an inhibitor of MMP-1,2,3,8, and 9, and is known to inhibit lung fibroblast mediated collagen gel contraction [ 24 ]. In a third experiment, cellularized gels were prepared identically to the time-course experiment except that some gels were polymerized with 25 μg/ml DQ collagen (type I from bovine skin, fluorescein conjugate, Invitrogen, Carlsbad, CA). After one week of floating culture, as described above, the gels were imaged with a confocal fluorescence feature of the Zeiss LSM 510Meta, with excitation wavelength of 488 nm and emission filter of 500-550 nm. GTA crosslinking of some of the cellularized gels occurred after initial imaging and mechanical testing. Gels were incubated at room temperature in 4% GTA/PBS for 24 hours, and then washed for several hours with 3-5 × 50 ml PBS. Estimated collagen concentration ( c , mg/ml) was calculated by dividing initial collagen mass in the gels (2 mg) by gel volume calculated from caliper measurements of gel height ( h, mm ) , and diameter ( d, mm ) , according to the following relation: c = 2 ∕ ( π d 2 h 4 ) ∕ 1000 . Multiphoton microscopy A LSM 510 Meta multiphoton microscope (Zeiss, Jena, Germany) was used for all imaging experiments. All SHG and TPF signals were collected in the epi-configuration with an Achroplan 40×/0.8 NA water-immersion objective (Zeiss). Each 12-bit image contained 512×512 pixels, and each pixel was ~440×440 nm. Pixel sampling rate was 625 kHz; pixel dwell time was 1.6 μs. Cellularized collagen gels were placed on 22×50 mm No. 1 coverslips (170 μm thickness) for imaging. Multiphoton signals were produced by a circularly-polarized Chameleon laser tuned to 780 nm. Power before the objective was ~102 mW, and at the sample focus ~92 mW. The SHG signal was collected using the instrument’s Meta detector, with wavelength cutoff points set at 383 nm and 405 nm, whereas the TPF signal was collected with an infrared-blocking 500-550 nm bandpass filter. At this excitation (780 nm), TPF emission at 500-550 is restricted mainly to: glutaraldehyde [ 15 ] and pyridinium-type crosslinks [ 25 , 26 ] in collagen; and NADH, FAD, riboflavin and other vitamin-derived fluorophores in cells [ 27 , 28 ], whereas the SHG signal is specific for collagen. SHG images with signal averaged over 16 frames were collected within the first 10 μm from the tissue surface in the region of highest SHG signal (before depth-dependent decay) to provide the best assessment of collagen microstructure. Five single image frames were collected per tissue (with lateral separation of 1.1 mm).
Image analysis
All image analysis was performed with ImageJ (Wayne Rasband, NIH, Bethesda, MD). Noise-subtraction was performed on all images in the following manner: 5-10 void regions from 5-10 SHG and TPF images were traced and the mean and standard deviation of pixel intensities were quantified, and found to be consistent among the image sets. The noise threshold was set at the mean plus three times the standard deviation from these void regions. SHG and TPF images were smoothed, and TPF images were further despeckled (since they contained a higher noise floor than SHG images) using corresponding ImageJ processing tools. Matrix and cell-derived TPF signal from images of uncrosslinked and GTA-crosslinked cellularized gels were separated by using a mask defined by a threshold. The threshold was easily determined, as the cell and matrix contributions to the TPF signal were disparate. In uncrosslinked gels, the image mean intensity was used as the threshold separating cell-derived signal (brighter than mean) and matrix-derived signal (less intense than the mean). In GTA crosslinked gels, the mask threshold was visually determined, at a level providing clear separation between cell-associated (brighter) and matrix-associated (less intense) TPF signals. Masked pixels were assigned values of zero, while unmasked pixels retained their values. The mean signal intensity, signal image area fraction, and skewness of the pixel histogram were calculated in ImageJ. Skewness is defined by the computational formula: (1) skew = { n Σ X i 3 − 3 Σ X i Σ X i 2 + 2 ( Σ X i ) 3 n } ∕ { ( n − 1 ) ( n − 2 ) s 3 } , in which n is the number of pixels, X i the intensity of pixel i , and s is the standard deviation. In practical terms, skewness describes the symmetry of the pixel histogram. A right-weighted (toward more intense signal) pixel distribution produces a positive skew, whereas a left-weighted pixel distribution produces a negative skew. An equally-weighted Gaussian distribution has a skewness of zero. To show the effects on skewness of images with sparse and dense SHG and TPF signal patterns, representative images, pixel histograms and skewness values are shown (see Supplemental Data, Figure S1 ). The speckle contrast was calculated using a Matlab (version 7.4.0, Natick, MA) routine in which the speckle contrast value of each central pixel was the standard deviation divided by the mean of the pixel region. A pixel region of 2401 (49×49 pixels or 1055 μm 2 ) was empirically determined to produce optimal variation in the speckle contrast parameter. The mean speckle contrast of each image was calculated from the pixel values.
SHG image texture simulation
The textural features of SHG images from collagen gels were simulated using a Matlab routine. The constructed images were meant to simulate images of a randomly-oriented collagen fiber network, in order to determine the relationship between robust, gain-independent image parameters and fiber number density. Collagen fiber segments within the MPM image plane were simulated as two-dimensional elliptical Gaussian functions. The length and width of the fiber segments were distributed normally, with mean and standard deviation determined from n = 50 line-segment measurements from SHG images of real collagen gels. Gaussian peak intensity was directly related to the length and width, so that larger fiber segments possessed proportionally more intense signal. Furthermore, the fibers edges were defined where the signal fell to 1/ e 2 times the maximum intensity of each Gaussian function. The simulated fiber areas and intensities were determined so that SHG images from cellularized gels at day 0 of culture would have similar mean intensity and signal area fraction to the simulated image of corresponding fiber number density. Fiber orientations were distributed uniformly through 360°, and positioned at random locations within a 512×512 pixel matrix. Intersecting fibers were allowed to superimpose, creating a linear relationship between mean image intensity and fiber number density, as well as a reasonable approximation to the texture of SHG images from cellularized gels containing 4-200 mg/ml collagen. In order to relate simulated images to SHG images from cellularized gels, simulated images were assigned collagen concentrations equal to the number of Gaussian ‘fibers’ in the simulation times a scaling factor, with units of mg/ml/fiber number. The scaling factor was determined by counting the number of fiber segments in SHG images of cellularized gels at day 0 of culture. These SHG images were thresholded at the noise-cutoff, despeckled as before to remove remaining noise, and a binary opening algorithm was performed in ImageJ to isolate adjacent fibers. Then, particle analysis was performed in ImageJ to count particles larger than 1 μm 2 . It was determined that the day 0 gel images contained 178±34 fibers (μ±s.d.), with an average gel concentration of 6.4 mg/ml. Therefore the scaling factor used for simulated images containing 200-5000 fiber segments was 0.0356 mg/ml/fiber. A second scaling factor was used to ensure similar brightness of individual Gaussian ellipses to collagen fibers SHG signal, and overall simulated image intensity roughly equal to that from SHG images of day 0 cellularized gels.
Mechanical testing
After multiphoton imaging, NHLF-seeded collagen hydrogels were mechanically tested using a Synergie 100 testing system (MTS Systems Corporation, Eden Prarie, MN). The hydrogels were placed on a 50 mm diameter platen covered with 600-grade ultrafine waterproof sandpaper (3M), attached using double-sided tape, to prevent slipping. Before testing, gel height, h, and diameter, d , were measured using a caliper, ranging from 1-2 mm ( h ) and 4-16 mm ( d ). Each gel was compressed to 10% of the gel height with specially-constructed 0.65 mm radius ( a ), nonporous, cylindrical aluminum platens. Indentation occurred at a rate of 0.05 mm/s and the resulting force was measured using a 10 N load cell, while strain was recorded based on motion of the actuator, and defined as percentage of the original sample height. Due to the small ratio of a / h , stresses beneath the platen are assumed to be nonuniform, with compressive stresses at the platen center but tensile stresses at the edges, as previously described [ 29 ]. All E were calculated assuming the gels behave as thin elastic layers bonded to a rigid bottom surface [ 29 ], directly related to the ratio a / h and the linear slope of the low strain stress-strain curve. Cellularized gels typically displayed linear stress-strain relationships through 10% strain (see Supplemental Data, Figure S2 ). Rheology was performed on glutaraldehyde crosslinked acellular gels (diameter 16 mm) only using an AR-G2 rheometer (TA Instruments, New Castle, DE) with a 20 mm diameter parallel plate configuration and a 0.7 mm gap. The gels were compressed slightly (0.1 N), and tested at an oscillation frequency of 0.01 (frequency independent), to confirm linearity of E measurements correlated versus G ’ (slope m = 2.25, R 2 = 0.90, Supplemental Data, Figure S2 ). This correlation is consistent with linear elasticity theory. The ratio of E/G’ = 2.25 corresponds to a Poisson ratio of ~0.13 which is consistent with previous reports in acellular collagen gels [ 30 ]. Uncrosslinked gels could not be tested serially in indentation and shear due to gel fragility during transportation between testing devices.
Sircol assay
After imaging and mechanical testing, collagen content of cellularized gels was assessed using the Sircol assay (Accurate Chemical and Scientific Corporation, Westbury, NY) following a manufacturer-defined protocol for assessing pepsin-soluble collagen. Collagen gels were mixed with 5 mg/ml pepsin from porcine stomach mucosa (Sigma) dissolved in 0.5 M acetic acid, and digested for 24 hours at 4°C.
Statistics
Regressions and t -tests were performed in Excel (Microsoft, Redmond, WA). Multiple linear regression was performed on log-transformed data using SigmaStat (Systat Software, San Jose, CA).
Supplementary Material 01 Supplemental Figure S1 (A) SHG image of a 6 mg/ml cellularized collagen gel on day 0 of culture. (B) SHG image of a 180 mg/ml cellularized collagen gel on day 15 of culture. (C) TPF image of a 180 mg/ml, uncrosslinked cellularized collagen gel on day 15 of culture. (D) TPF image of a 180 mg/ml, crosslinked cellularized collagen gel after 15 days of culture. (E) Pixel histogram with skewness value of the image (A). (F) Pixel histogram with skewness value of the image (B). (G) Pixel histogram with the skewness value of the image (C). (H) Pixel histogram with the skewness value of the image (D). Images are 225 μm on a side. 02 Supplemental Figure S2 (A) Representative stress-strain curve for a cellularized collagen gel from an indentation test to 10% strain. Sample height was 1 mm. R 2 coefficient for the linear best fit is listed in the figure. (B) Young’s modulus in indentation ( E ) versus shear storage modulus (G’) of acellular collagen gels from 1.5-9 mg/ml. Error bars represent standard deviation of five indentation measurements per gel and three shear measurements per gel. 03 Supplemental Figure S3 Axial signal profile along the short axis of a collagen fiber from an SHG image from a cellularized collagen gel at day 0 of culture (solid line) overlaid with a representative axial signal profile along the minor axis of an elliptical Gaussian function used to represent a collagen fiber in a textural simulation image (dashed line)
📊 Figures

Figure 1
Gel volume (u25fb) and estimated concentration (u25fb) for n = 16 cellularized gels collected during sixteen days floating culture.
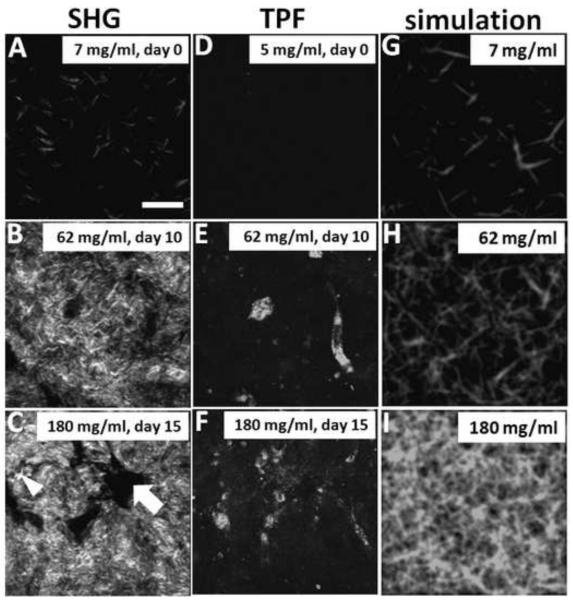
Figure 2
Images of SHG signal (A-C), TPF signal (D-F) from cellularized gels, and simulated signal from a randomly-oriented fiber network of similar texture to the SHG images (G-I). The SHG and TPF images are ...

Figure 3
Mean image intensity versus collagen concentration for SHG and texture simulation images (A), and for TPF signal components (B). Signal image area fraction versus collagen concentration for SHG and te...
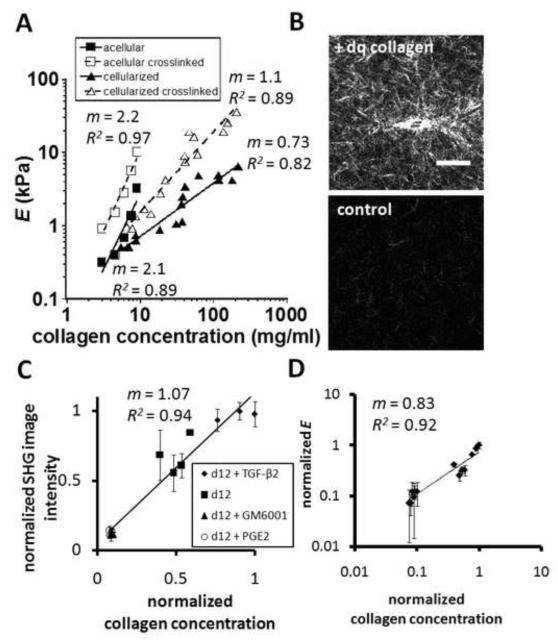
Figure 4
(A) E measured from uncrosslinked cellularized gels (u25fb, n = 16), glutaraldehyde crosslinked cellularized gels (u25fb, n = 16), uncrosslinked acellular gels (u25fb, n = 5), and crosslinked acellula...
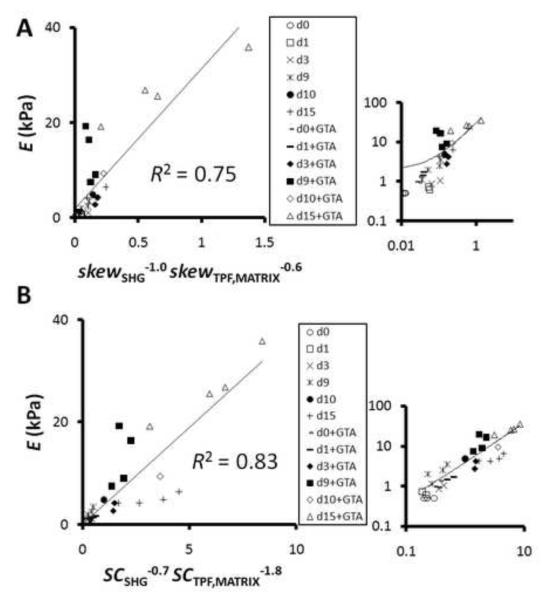
Figure 5
(A) Nonlinear best-fit model for E on SHG signal skewness and matrix-derived TPF signal skewness. Markers indicate days in culture of the collagen gels and presence of GTA crosslinking. The inset on t...
Figure images are served from the NIH/NLM PubMed Central Open Access Subset or Europe PMC; copyright remains with the publishers and authors.
💬 Discussion
0 commentsNo comments yet. Be the first to start a discussion!
Leave a Comment