Abstract
Accurately measuring the bulk minority carrier lifetime is one of the greatest challenges in evaluating photoactive materials used in photovoltaic cells. One-photon time-resolved photoluminescence decay measurements are commonly used to measure lifetimes of direct bandgap materials. However, because the incident photons have energies higher than the bandgap of the semiconductor, most carriers are generated close to the surface, where surface defects cause inaccurate lifetime measurements. Here we show that two-photon absorption permits sub-surface optical excitation, which allows us to decouple surface and bulk recombination processes even in unpassivated samples. Thus with two-photon microscopy we probe the bulk minority carrier lifetime of photovoltaic semiconductors. We demonstrate how the traditional one-photon technique can underestimate the bulk lifetime in a CdTe crystal by 10× and show that two-photon excitation more accurately measures the bulk lifetime. Finally, we generate multi-dimensional spatial maps of optoelectronic properties in the bulk of these materials using two-photon excitation.
🔬 Techniques
✨ Fluorophores
🏭 Microscope Brands
📷 Detectors
🏛️ Research Organizations (ROR)
Affiliated research institutions:
📋 Methods
Samples Rhodamine 101 was diluted in ethanol to a concentration of 2 × 10 −4 M and placed in a cuvette. For the 2P measurement a 10× objective was used to allow for a greater working distance required by using a cuvette. The InGaN quantum well sample was grown using MOCVD on a C-plane sapphire substrate using a Thomas Swan 2 × 3 close-coupled showerhead reactor. Trimethylgallium, trimethylindium and ammonia where used as Ga, In and N precursors, respectively. Two sets of five 2.5 nm-thick InGaN quantum wells, with 7 nm GaN barriers were grown on top of a 2 μm-thick GaN buffer and separated by a 3 μm-thick GaN layer and capped by 300 nm-thick GaN layer. The emission wavelength of the QWs was tuned to ~430 nm and ~460 nm by changing the indium concentration through varying the growth temperature between 750 and 720°C, respectively. Bridgeman grown, CdTe (110) single crystals were obtained from MTI Corp. The crystals were polished to a mirror finish as received. The CdTe crystals were subsequently annealed with a piece of Cd shot in an evacuated (10 −5 Torr) quartz ampoule for 24 hours at 500°C and finally cooled for 5 hours. One-photon time-resolved photoluminescence Samples were excited with a pulsed laser diode, (PicoQuant LDH 485 nm, 100 ps FWHM pulse duration, 10 MHz) focused with a 10× NA = 0.25 objective, spectrally filtered using an Acton 2300i spectrometer and detected with a single-photon avalanche diode (Micro Photon Devices PDM series). A PicoQuant PicoHarp 300 time-correlated single-photon counting (TCSPC) system was used to record the timing data.
Show full methods section
Samples Rhodamine 101 was diluted in ethanol to a concentration of 2 × 10 −4 M and placed in a cuvette. For the 2P measurement a 10× objective was used to allow for a greater working distance required by using a cuvette. The InGaN quantum well sample was grown using MOCVD on a C-plane sapphire substrate using a Thomas Swan 2 × 3 close-coupled showerhead reactor. Trimethylgallium, trimethylindium and ammonia where used as Ga, In and N precursors, respectively. Two sets of five 2.5 nm-thick InGaN quantum wells, with 7 nm GaN barriers were grown on top of a 2 μm-thick GaN buffer and separated by a 3 μm-thick GaN layer and capped by 300 nm-thick GaN layer. The emission wavelength of the QWs was tuned to ~430 nm and ~460 nm by changing the indium concentration through varying the growth temperature between 750 and 720°C, respectively. Bridgeman grown, CdTe (110) single crystals were obtained from MTI Corp. The crystals were polished to a mirror finish as received. The CdTe crystals were subsequently annealed with a piece of Cd shot in an evacuated (10 −5 Torr) quartz ampoule for 24 hours at 500°C and finally cooled for 5 hours. One-photon time-resolved photoluminescence Samples were excited with a pulsed laser diode, (PicoQuant LDH 485 nm, 100 ps FWHM pulse duration, 10 MHz) focused with a 10× NA = 0.25 objective, spectrally filtered using an Acton 2300i spectrometer and detected with a single-photon avalanche diode (Micro Photon Devices PDM series). A PicoQuant PicoHarp 300 time-correlated single-photon counting (TCSPC) system was used to record the timing data.
Two-photon time-resolved photoluminescence
A confocal microscope system was constructed using a Nikon Eclipse Ti-U microscope with a Nikon 100× NA = 0.95 NA objective and a three axis MadCityLabs NanoPDQ piezo nanopositioning sample stage. A Coherent Mira 900 Ti:Sapphire excitation laser (700–1000 nm tunable, 150 fs pulse duration, 80 MHz) is optically coupled to the input of the microscope. The laser was tuned to 830 nm for the InGaN quantum well and Rhodamine 101 samples and was tuned to 920 nm for the CdTe sample. Photoluminescence was collected through a 150 μm pinhole and into detection optics. For spectral collection we used and Acton 2300i spectrometer with 150 groves/mm grating and an Andor iXon electron-multiplied CCD. For time-resolved collection we first spectrally-filtered the PL using band pass filters and then collected with a single-photon avalanche diode (Micro Photon Devices PDM series). A PicoQuant PicoHarp 300 time-correlated single-photon counting (TCSPC) system was used to record the timing data. Lifetimes were fit to a biexponential decay using a constrained least-squared algorithm. A laser pulse energy of 4 pJ/pulse was used to excite the CdTe sample.
Cathodoluminescence microscopy
We performed CL measurements in a Zeiss Gemini Supra 55 scanning electron microscope at 15 kV. CL emission was collected via a multimode optical fiber positioned 300 μm away from the electron-beam location on the sample. CL was then spectrally filtered with an Acton 2300i spectrometer. For CL images collected in a narrow spectral bandwidth, the photons were collected by either a Hamamatsu 7360-01 photomultiplier tube or a Perkin-Elmer SPCM-AGR-15 silicon-avalanche photodiode (below and above 530 nm, respectively).
📊 Figures
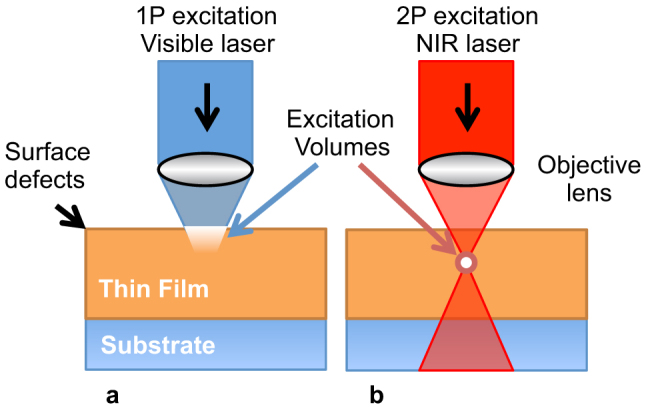
Figure 1
Schematic of one-photon versus two-photon excitation microscopy.
(a) In traditional one-photon microscopy, incident light is absorbed predominantly at the surface following an exponential absorption profile. (b) Two-photon microscopy allows for direct optical excit...
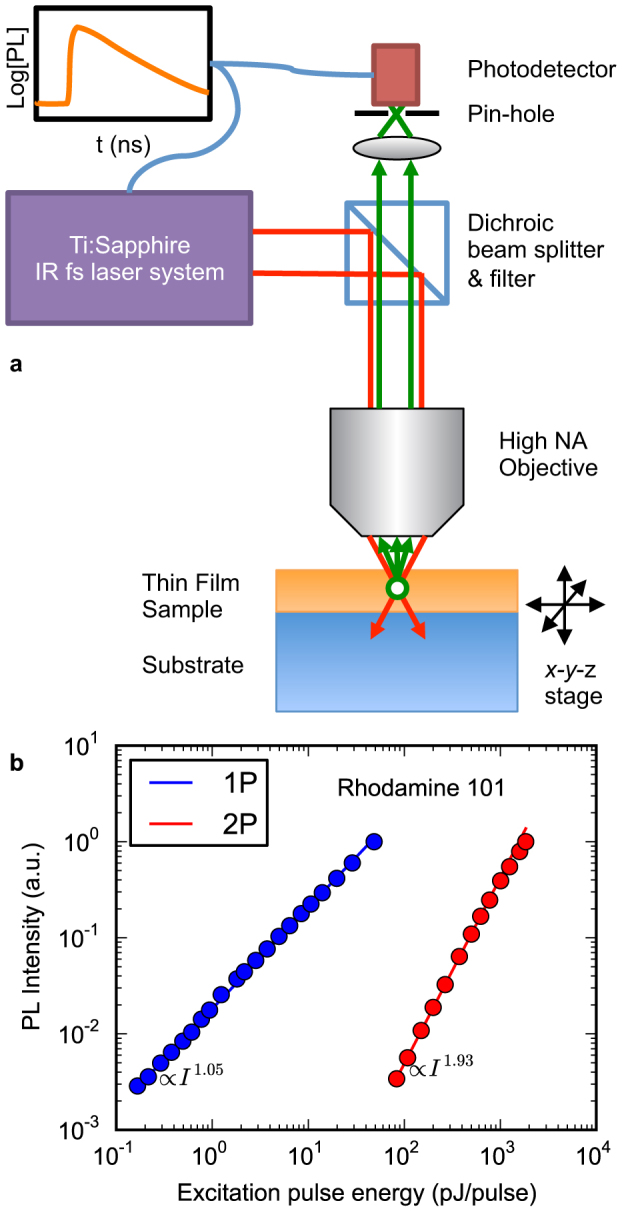
Figure 2
Two-photon excitation microscopy.
(a) Schematic of the 2P-TRPL microscope used in this study. (b) One-photon and two-photon photoluminescence intensity dependence of Rhodamine 101 in ethanol with power-law fits.
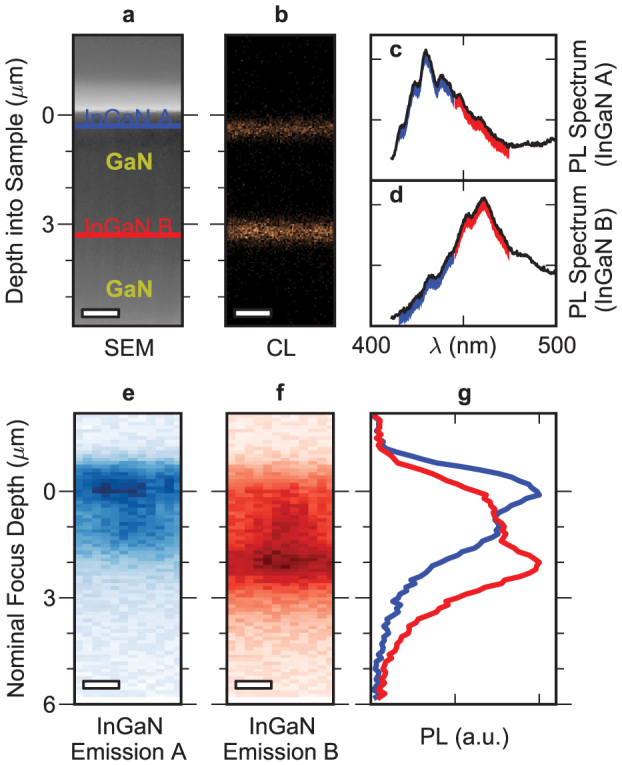
Figure 3
InGaN/GaN/InGaN double quantum well (QW) model system for confirmation of two-photon depth profiling ability.
(a) Labeled scanning electron micrograph of the sample. Scale bar is 1u2005u03bcm. (b) Cathodoluminescence image of the same region of the sample as (a). (c) Representative emission spectrum of the to...
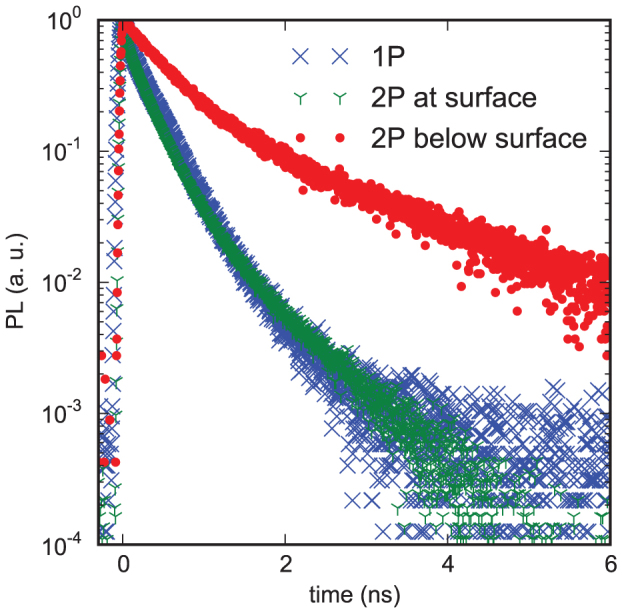
Figure 4
Comparison of one-photon and two-photon time-resolved photoluminescence on an untreated single crystal CdTe sample.
Blue curve indicates photoluminescence (PL) decay using one-photon excitation. Green curve shows PL decay when illuminating the surface of the sample with two-photon excitation. Red curve shows PL dec...
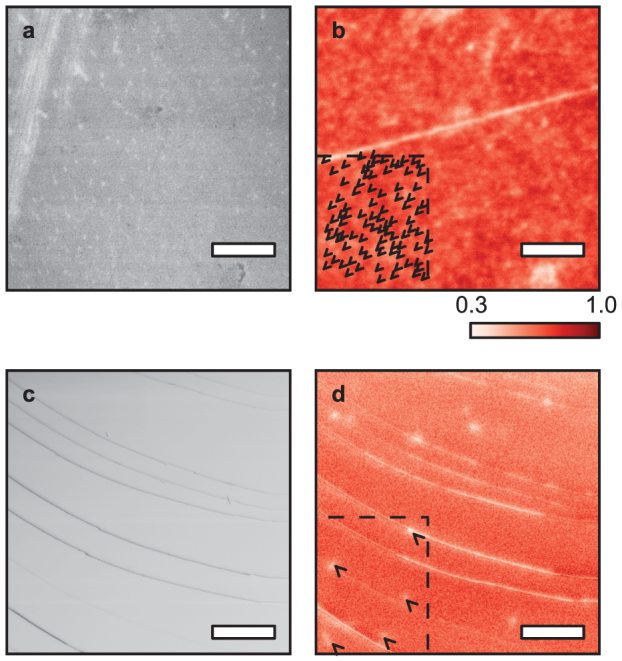
Figure 5
Cathodoluminescence (CL) of the untreated CdTe crystal.
All scale bars are 10u2005u03bcm (a) Scanning electron micrograph (SEM) of the top surface of CdTe sample. (b) Associated CL image of the top surface. Arrows highlight examples of reduced emission sit...
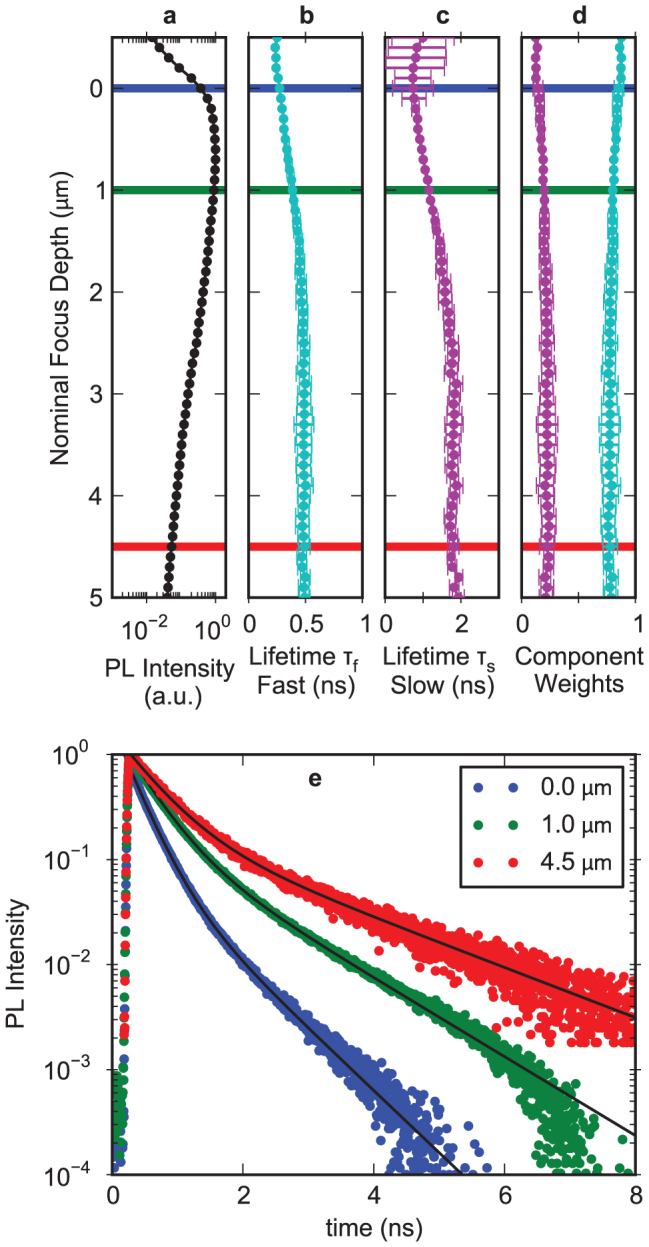
Figure 6
Depth-of-Focus two-photon TRPL of the untreated CdTe crystal.
(a) Total photoluminescence intensity as a function of nominal focus depth (u0394z) into sample as measured by the motion of the sample stage. (b,c) Results of a biexponential fit of PL decay as a fun...
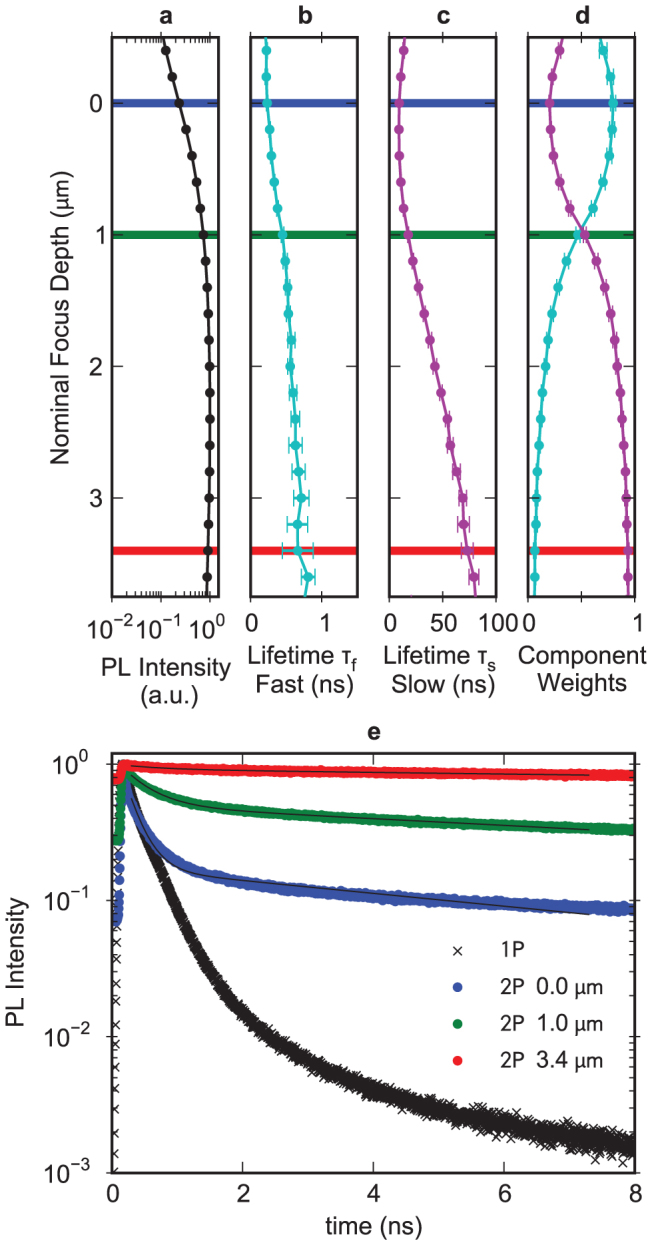
Figure 7
Depth-of-Focus two-photon TRPL of the treated CdTe crystal.
(a) Total photoluminescence intensity as a function of nominal focus depth (u0394z) into sample as measured by the motion of the sample stage. (b,c) Results of a biexponential fit of PL decay as a fun...
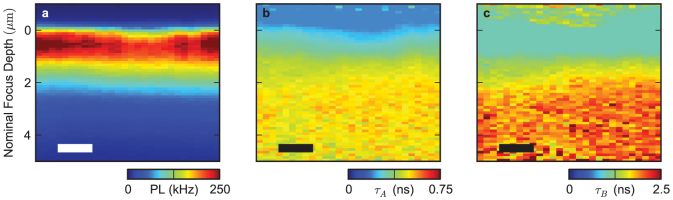
Figure 8
Cross-section depth maps of two-photon TRPL of CdTe.
All scale bars are 1u2005u03bcm. (a) Total photoluminescence intensity as a function of stage position. Vertical axis is the nominal focus depth as measured by the motion of the sample stage. Horizont...
Figure images are served from the NIH/NLM PubMed Central Open Access Subset or Europe PMC; copyright remains with the publishers and authors.
💬 Discussion
0 commentsNo comments yet. Be the first to start a discussion!
Leave a Comment