Abstract
PURPOSE: Lipofuscin and melanolipofuscin organelles in retinal pigment epithelium (RPE) cells are signal sources for clinical fundus autofluorescence (AF). To elucidate the subcellular basis of AF imaging, we identified, characterized, and quantified the frequency of RPE morphology and AF phenotypes in donor eyes with age-related macular degeneration (AMD). METHODS: In 25 RPE-Bruch's membrane flat mounts from 25 eyes, we analyzed 0.4-μm z-stack epifluorescence images of RPE stained with phalloidin for actin cytoskeleton. Using a custom ImageJ plugin, we classified cells selected in a systematic unbiased fashion in six phenotypes representing increasing degrees of pathology. For each cell, area, AF intensity, and number of Voronoi neighbors were compared with phenotype 1 (uniform AF, polygonal morphology) via generalized estimating equations. We also analyzed each cell's neighborhood. RESULTS: In 29,323 cells, compared with phenotype 1, all other phenotypes, in order of increasing pathology, had significantly larger area, reduced AF, and more variable number of neighbors. Neighborhood area and AF showed similar, but subtler, trends. Cells with highly autofluorescent granule aggregates are no more autofluorescent than others and are in fact lower overall in AF. Pre-aggregates were found in phenotype 1. Phenotype 2, which exhibited degranulation despite normal cytoskeleton, was the most numerous nonhealthy phenotype (16.23%). CONCLUSIONS: Despite aggregation of granules that created hyperAF aggregates within cells, overall AF on a per cell basis decreased with increasing severity of dysmorphia (abnormal shape). Data motivate further development of subcellular resolution in clinical fundus AF imaging and inform an ongoing reexamination of the role of lipofuscin in AMD.
🔬 Techniques
✨ Fluorophores
💻 Software Details
🏛️ Research Organizations (ROR)
Affiliated research institutions:
📋 Methods
In 25 RPE–Bruch's membrane flat mounts from 25 eyes, we analyzed 0.4-μm z-stack epifluorescence images of RPE stained with phalloidin for actin cytoskeleton. Using a custom ImageJ plugin, we classified cells selected in a systematic unbiased fashion in six phenotypes representing increasing degrees of pathology. For each cell, area, AF intensity, and number of Voronoi neighbors were compared with phenotype 1 (uniform AF, polygonal morphology) via generalized estimating equations. We also analyzed each cell's neighborhood.
Methods Compliance The institutional review board at the University of Alabama at Birmingham approved this study. All procedures adhered to the tenets of the Declaration of Helsinki.
Overview
This study analyzed epi-fluorescence images of RPE flat mounts that were captured in a systematically unbiased fashion for our published survey of RPE cytoskeleton and histologic AF in 25 AMD eyes 25 (see Supplementary Material for methodologic details). For this quantitative study of the same AMD eyes, each individual RPE cell was represented as a Voronoi region 48 , 49 after assignment of cell centers (see Supplementary Material ). Total AF intensity in projection images of z-stacks, the number of neighbors, and cell area were automatically quantified by custom software. 10 To these quantitative data we added semiquantitative judgments of a trained observer about AF patterns and cellular morphology, within the same Voronoi regions. Although it is possible that removing the retina from RPE–Bruch's membrane flat mounts also removed apical portions of RPE, thus impeding accurate assessment of cellular AF, our experience with histology of postmortem eyes suggests this possibility is unlikely. The most common artifacts are detachment of outer segments from RPE that may or may not take RPE apical processes with them (e.g., figure 5 of Ref. 32 ), detachment of inner segments at the myoids (bacillary layer detachment), 50 and detachment of RPE from Bruch's membrane at sites of basal linear deposit and soft drusen. 51 , 52 We do not see in histology splits through the middle of RPE suggesting that only the basolateral half of cells are present in flat mounts. We assume that these artifacts are stochastic and that their impact on our results is minimized by choosing images in the way we did. We did see in flat mounts many cells with melanosomes, or a brush-like appearance of the phalloidin signal, consistent with intact cell bodies and apical processes (see Results). Finally, cells were imaged in apical-to-basal z-stacks of a constant number at each specific location.
Show full methods section
In 25 RPE–Bruch's membrane flat mounts from 25 eyes, we analyzed 0.4-μm z-stack epifluorescence images of RPE stained with phalloidin for actin cytoskeleton. Using a custom ImageJ plugin, we classified cells selected in a systematic unbiased fashion in six phenotypes representing increasing degrees of pathology. For each cell, area, AF intensity, and number of Voronoi neighbors were compared with phenotype 1 (uniform AF, polygonal morphology) via generalized estimating equations. We also analyzed each cell's neighborhood.
Methods Compliance The institutional review board at the University of Alabama at Birmingham approved this study. All procedures adhered to the tenets of the Declaration of Helsinki.
Overview
This study analyzed epi-fluorescence images of RPE flat mounts that were captured in a systematically unbiased fashion for our published survey of RPE cytoskeleton and histologic AF in 25 AMD eyes 25 (see Supplementary Material for methodologic details). For this quantitative study of the same AMD eyes, each individual RPE cell was represented as a Voronoi region 48 , 49 after assignment of cell centers (see Supplementary Material ). Total AF intensity in projection images of z-stacks, the number of neighbors, and cell area were automatically quantified by custom software. 10 To these quantitative data we added semiquantitative judgments of a trained observer about AF patterns and cellular morphology, within the same Voronoi regions. Although it is possible that removing the retina from RPE–Bruch's membrane flat mounts also removed apical portions of RPE, thus impeding accurate assessment of cellular AF, our experience with histology of postmortem eyes suggests this possibility is unlikely. The most common artifacts are detachment of outer segments from RPE that may or may not take RPE apical processes with them (e.g., figure 5 of Ref. 32 ), detachment of inner segments at the myoids (bacillary layer detachment), 50 and detachment of RPE from Bruch's membrane at sites of basal linear deposit and soft drusen. 51 , 52 We do not see in histology splits through the middle of RPE suggesting that only the basolateral half of cells are present in flat mounts. We assume that these artifacts are stochastic and that their impact on our results is minimized by choosing images in the way we did. We did see in flat mounts many cells with melanosomes, or a brush-like appearance of the phalloidin signal, consistent with intact cell bodies and apical processes (see Results). Finally, cells were imaged in apical-to-basal z-stacks of a constant number at each specific location.
Imaging Data Analysis
From the original image dataset of 1585 images, a set of 400 total images (17 from each eye or until usable images from an eye were depleted) was chosen with a random number generator. We pooled images across three regions (fovea, perifovea, and near periphery), despite regional differences in cell area, 10 because the RPE layer was absent in many areas in central macula of AMD eyes, and our categorical analysis of phenotypes did not depend on cell size. The center of each RPE cell was defined manually in images of phalloidin-labeled RPE by trained observers (AVZ, TA, JM) using a custom FIJI plugin (Find_Centers) 53 and a digitizing tablet (Intuos; Wacom, Saitama Japan). The resulting Voronoi diagrams qualitatively agreed with actual RPE cell geometry by visual inspection. This procedure contrasts with that used in our previous study of normal eyes, 10 in which consistent RPE morphology allowed semiautomated assignment of cell centers by the same plugin. To ensure the validity of Voronoi analyses, we defined in each image a central area that had at least one row of cells between it and the image edge (details in supplementary figure 3 of Ref. 10 ). A custom FIJI plugin (“AF Phenotypes,” Fig. 2 , available on request) generated a scrollable z-stack of successive images. A single trained observer (JAG) assigned morphology and AF distribution pattern phenotypes ( Table 1 , Fig. 3 ). Classifications were repeated at one location from each eye to determine intraobserver repeatability (morphology weighted kappa = 0.9708; AF Pattern weighted kappa = 0.9770). Area, AF intensity, 10 and number of neighbors (NN) was automatically measured via custom FIJI software (KRS) for each Voronoi region. AF intensity was quantified in arbitrary units and normalized to the mean value of phenotype 1 cells in the same eye, which were considered healthy (see below), to control for differing background AF between imaging sessions unrelated to inherent RPE AF. Figure 2 Demonstration of the custom FIJI plugin “AF Phenotypes.” Input to the plugin was an image stack. Image 1 (A) of the stack was cytoskeleton labeled with 647 Alexa-conjugated phalloidin. Image 2 (B) was a projection all-in-focus image of confocal autofluorescence, at excitation wavelength of 488 nm. Images 3-n (C–F) were the 0.4-μm apical-to-basal planes of the z-stack, overlaid by the cytoskeleton image. A single trained observer (JAG) assigned morphology and AF distribution pattern phenotypes ( Table 1 , Fig. 3 ). Phenotypes were assigned by selecting a single radio button from a menu (magnified in G) for both parameters of the “current cell,” denoted by a yellow dot at the cell center. All cells yet to be classified were denoted by a small white circle in the cell center. Cells that were already classified were denoted by a sequence number placed at the cell center. The plugin also featured a zoom-in/out feature and a 20-μm scale bar in the lower right-hand corner. On completion of each image for a given location, the plugin generated a .csv file containing cell numbers with assigned phenotypes and a .tif file of the z-stack for reference. Table 1 Morphology and AF Pattern Phenotype Criteria Phenotype Classification Criteria/Rules Morphology Ungradable Cell border is undetectable or cut off by image edge. Polygonal Cell borders have vertices and mostly straight edges; many cells have brush-like apical surface ( Fig. 3 A). Round Circular or oval cells with no vertices. Mixed At least one vertex and at least one edge that is rounded rather than straight, including cells that appear “bloated”. Misshapen Cell is definitely present and not cut off by image edge, but the shape is indeterminate (blurred/faint cytoskeleton staining, partial discontinuity of cytoskeleton, actin “junk”) or does not fit into other morphology categories. Concave At least one edge with a significant concavity. AF pattern Ungradable Ungradable morphology making AF pattern determination within cell borders impossible, or AF return was so blurry pattern could not be discerned. Unremarkable Roughly even and uniform AF granules throughout the area of the cell, except when blocked by nucleus. 93 Degranulating Areas of no AF return not due to nucleus. Aggregating Delimited, roughly spherical, area of dense AF granule packing; often, but not always, more intense AF return than rest of cell. Aggregating and degranulating At least one aggregate and one area of degranulation present. Empty Completely devoid of AF granules. Figure 3 Morphology and AF phenotypes: (A) Polygonal, (B) Round, (C) Mixed, (D) Misshapen, (E) Unremarkable AF (white arrow shows hypofluorescent area of a nucleus), (F) Mixed, Aggregating AF, (G) Polygonal, Degranulating AF (H), Mixed, Aggregating-Degranulating AF, (I) Polygonal, Empty AF. Scale Bar: 20 μm. Generalized estimating equations were used to compare variables by cellular phenotypes while accounting for repeated measures, the Poisson distribution was used for count data, and the normal distribution was used for continuous data. We did not stratify data by age, severity of AMD, or retinal location because of the relatively few occurrences of diseased phenotypes. Concave cells (defined below) were excluded from all analyses except frequency, because concavity violates assumptions of Voronoi analysis. Cells considered ungradable for either morphology or AF distribution were excluded from all analyses. Phenotype categories were pooled for statistical tractability ( Table 2 ). With these methods, it can be assumed that the most frequently found category is “normal” (i.e., healthy), and categories increase in abnormality (i.e., disease) as frequency decreases. Accordingly, we numbered phenotypes (Ph) 1 to 6 in order of decreasing abundance and increasing pathology. Table 2 Pooled Phenotypes for Statistical Analysis Category Morphology AF Pattern Ph 1 (healthy) Polygonal Unremarkable Ph 2 Polygonal Degranulating/Empty Ph 3 Round/Mixed/Misshapen Unremarkable Ph 4 Polygonal Aggregating and Aggregating/Degranulating Ph 5 Round/Mixed/Misshapen Degranulating/Empty Ph 6 Round/Mixed/Misshapen Aggregating and Aggregating/Degranulating Ph 7 Concave All Our model of locally driven AMD progression suggests that neighbors will be similar to each other, at least at the extremes of all normal and all degenerating. For intermediate phenotypes, neighbors may exhibit high variance. Thus, we also analyzed for each cell its “neighborhood” of Voronoi neighbors. We defined a neighborhood as the cells immediately adjacent to a central reference cell. To eliminate incomplete neighborhoods from analysis, cells without at least one cell center between it and the image edge were not used as a reference. For each phenotype, mean neighborhood area and AF intensity were measured, as well as the average frequency distribution of neighbor phenotypes.
Supplementary Material Supplement 1 Click here for additional data file.
📊 Figures
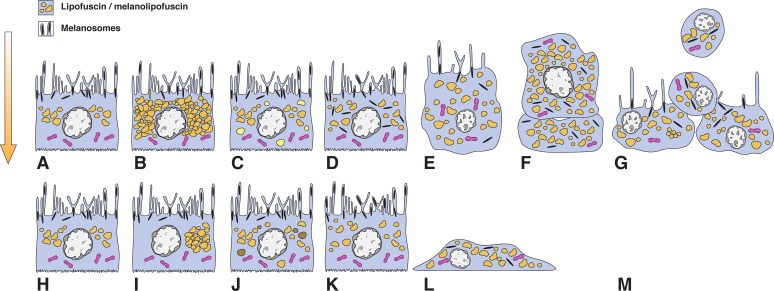
Figure 1
Cellular and subcellular factors influencing autofluorescence signal strength of human RPE. Light enters from above (arrow) to excite fluorophores within cells. Emissions exit above to be detected by ...
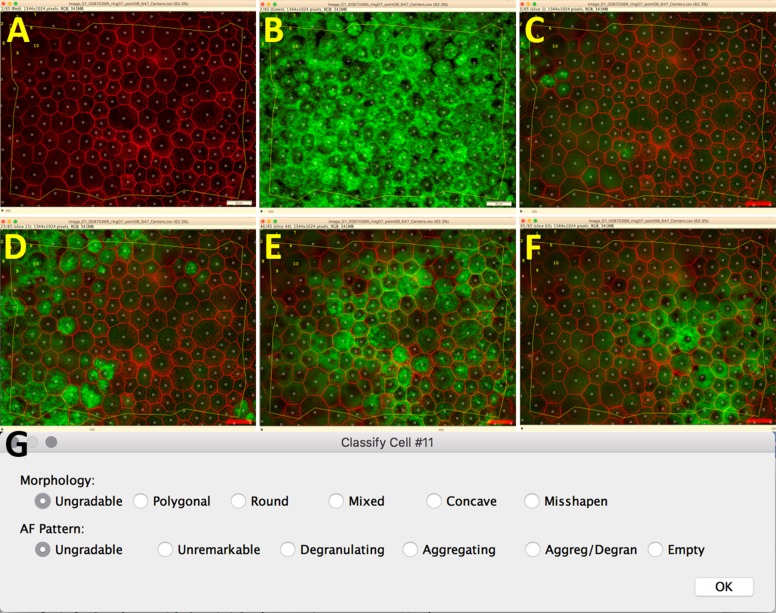
Figure 2
Demonstration of the custom FIJI plugin u201cAF Phenotypes.u201d Input to the plugin was an image stack. Image 1 (A) of the stack was cytoskeleton labeled with 647 Alexa-conjugated phalloidin. Image 2...
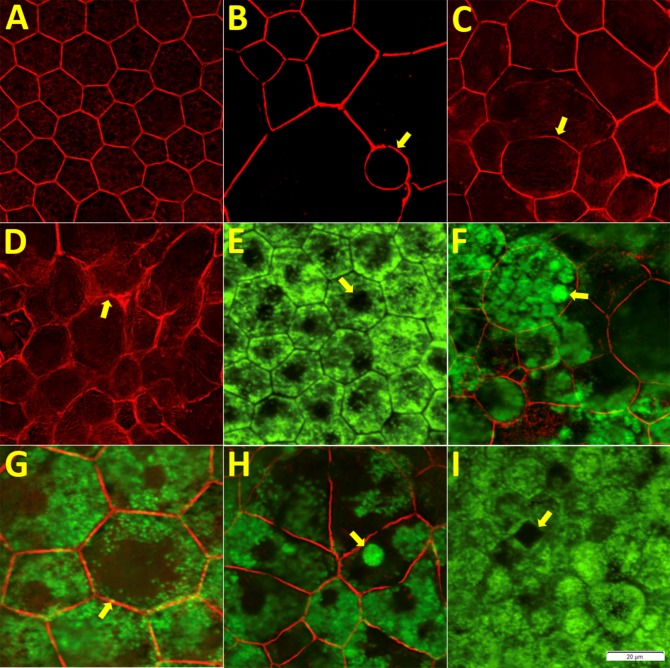
Figure 3
Morphology and AF phenotypes: (A) Polygonal, (B) Round, (C) Mixed, (D) Misshapen, (E) Unremarkable AF (white arrow shows hypofluorescent area of a nucleus), (F) Mixed, Aggregating AF, (G) Polygonal, D...
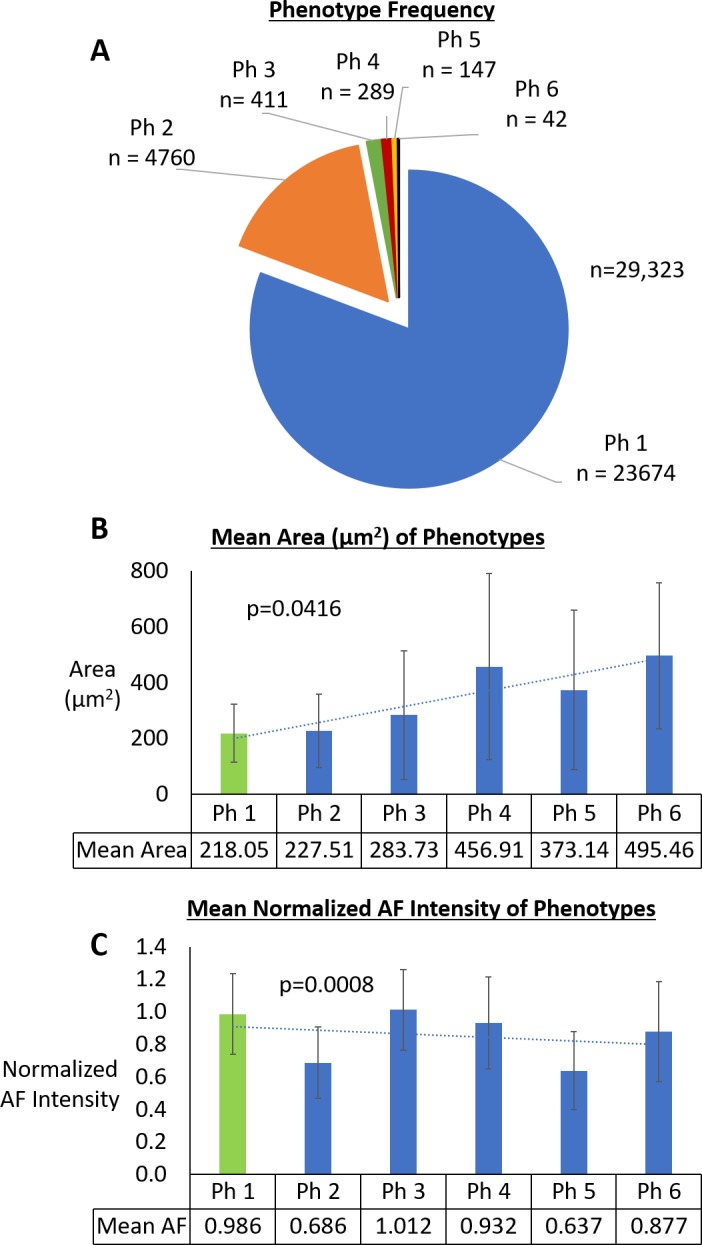
Figure 4
Frequency, area, and AF intensity of RPE phenotypes. (A) Ph 1 (healthy) was by far the most abundant. Ph 2, although far less frequent than Ph 1, was notably more abundant than the rest of the disease...
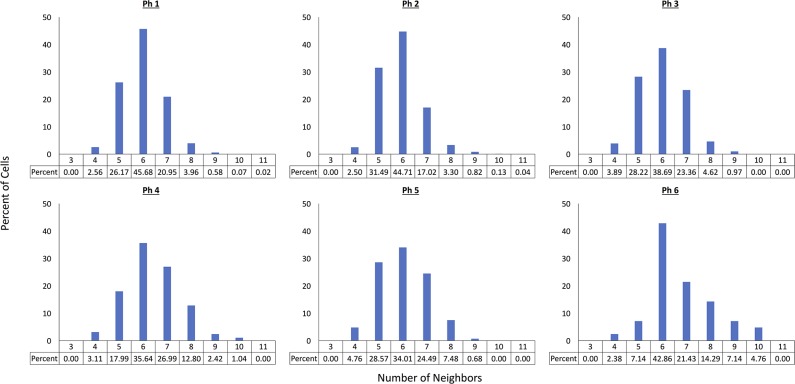
Figure 5
NNs of RPE phenotypes. All phenotypes most often contact six neighbors (34%u201345% per phenotype). Phs 1 to 5 most often contact five to seven neighbors. Ph 6 most often contacts six to eight neighbo...
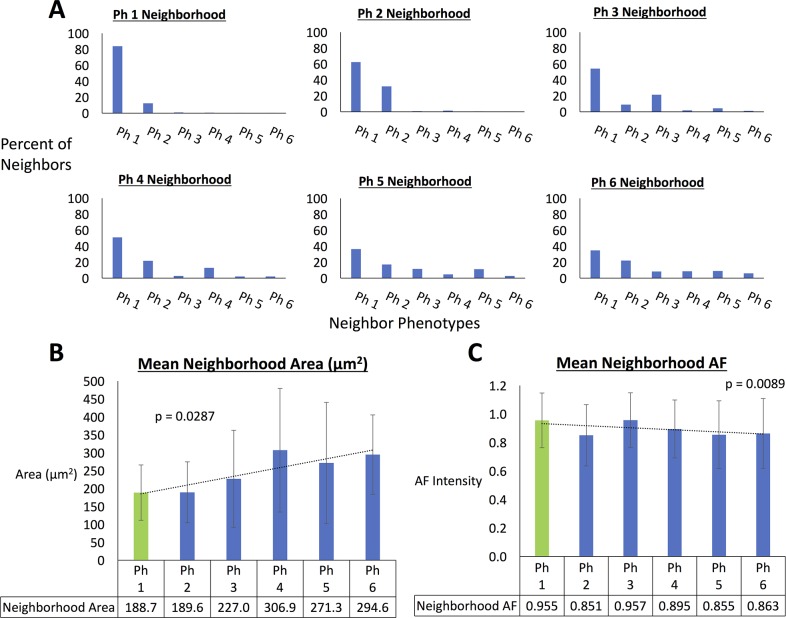
Figure 6
Neighbor frequency distribution becomes more variable as pathology increases, whereas mean neighborhood area and AF show subtler trends than individual phenotype values. (A) Neighbor phenotype proport...
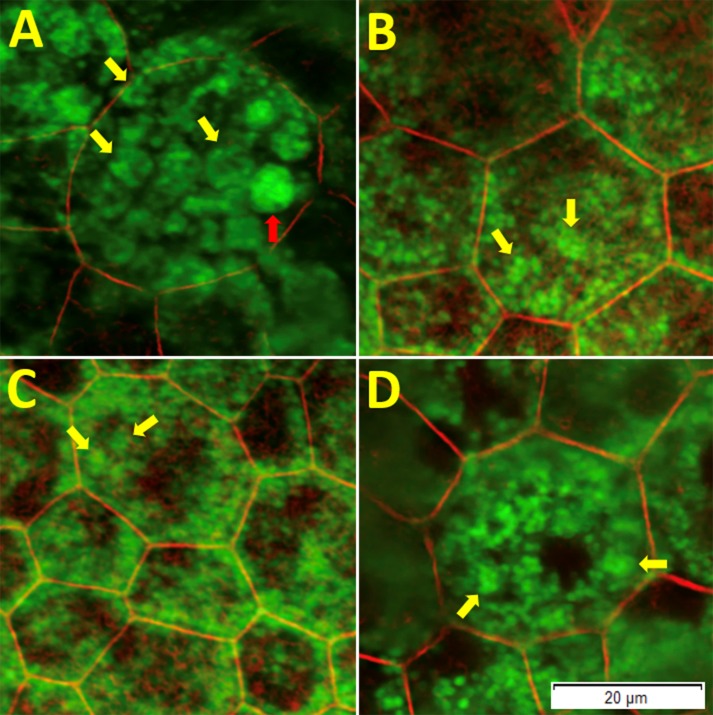
Figure 7
Pre-aggregates of autofluorescent granules in RPE of AMD eyes. (A) Red arrow shows a definite aggregate. (Au2013D) Yellow arrows show proposed pre-aggregates, that is, clumps of AF granules that were ...
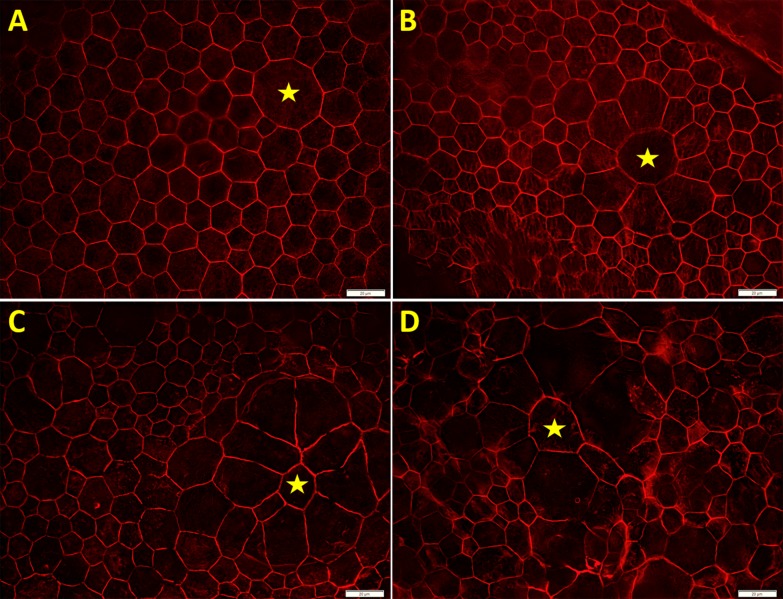
Figure 8
Focality of change in RPE morphology. At lower magnifications than those used in Figure 2 , areas of largely healthy RPE are seen to include areas of notable change as small as a few cells. Many image...
Figure images are served from the NIH/NLM PubMed Central Open Access Subset or Europe PMC; copyright remains with the publishers and authors.
💬 Discussion
0 commentsNo comments yet. Be the first to start a discussion!
Leave a Comment