Abstract
Cell cycle analysis typically relies on fixed time-point measurements of cells in particular phases of the cell cycle. The cell cycle, however, is a dynamic process whose subtle shifts are lost by fixed time-point methods. Live-cell fluorescent biosensors and time-lapse microscopy allows the collection of temporal information about real time cell cycle progression and arrest. Using two genetically-encoded biosensors, we measured the precision of the G(1), S, G(2) and M cell cycle phase durations in different cell types and identified a bimodal G(1) phase duration in a fibroblast cell line that is not present in the other cell types. Using a cell line model for neuronal differentiation, we demonstrated that NGF-induced neurite extension occurs independently of NGF-induced cell cycle G(1) phase arrest. Thus, we have begun to use cell cycle fluorescent biosensors to examine the proliferation of cell populations at the resolution of individual cells and neuronal differentiation as a dynamic process of parallel cell cycle arrest and neurite outgrowth.
🔬 Techniques
💻 Software
✨ Fluorophores
🧪 Sample Preparation
🔬 Cell Lines
🏭 Microscope Brands
🧪 Reagent Suppliers
📷 Detectors
💻 Software Details
🏛️ Research Organizations (ROR)
Affiliated research institutions:
📋 Methods
Cloning the biosensors To create the G 1 phase biosensor, nucleic acids from the carboxy terminus of human DNA helicase B (HDHB) (accession # AF319995 ) were amplified from a full human brain cDNA library using the following primers: 5′ CCC AAG CTT GGG CTC TCC TCT AGC GGC GCA 3′; 5′ CGG GGT ACC CCG AGT TTC TTG ATT ATC GGT GGG C 3′. The 5′ primer used for PCR includes a HindIII site and the 3′ primer includes a KpnI site. These restriction digest sites were used to facilitate ligation of the PCR product into pcDNA3-tdimer2 (a gift of R. Tsein). 11 The resulting vector encoded a fusion protein composed of, from N- to C-terminus, the HDHB C-terminus and tdimer2. The S phase biosensor is a modified version of GFP-PCNAL2, which was a kind gift of M.C. Cardoso. 9 The original sequence for GFP-PCNAL2 includes an SV40 NLS, EGFP, an 18 amino acid flexible linker and full length PCNA (accession # NM_002592 ). The original parent vector, pEVRF (containing GFP-PCNAL2) and pEYFP-N1 (Clontech) were sequentially digested with AgeI and BsrGI and ligated to obtain the construct we refer to as the S phase biosensor.
Cell culture and biosensor expression Though
PC12 cells are a unique and reliable model system to study aspects of neuronal differentiation, they are not ideal for imaging experiments. We used a subpopulation of PC12 cells, Neuroscreen-1, because of their increased rate of growth and their improved cell spreading that eliminates the clumping often seen with PC12 cells (Cellomics, Inc.). 21 , 22 Despite the changes present in NS-1 cells that enhance their usefulness in imaging experiments, as with PC12 cells, NS-1 cells develop neurites upon the addition of NGF while the addition of serum allows for proliferation. For simplicity, we have referred throughout this study to the Neuroscreen-1 cells as PC12 cells. HeLa and NIH3T3 cells from the ATCC were grown and plated in high glucose DMEM supplemented with penicillin/streptomycin/glutamine (PSG) (1%) and fetal bovine serum (FBS) (10%) at 37°C in 10% CO 2 .
Show full methods section
Cloning the biosensors To create the G 1 phase biosensor, nucleic acids from the carboxy terminus of human DNA helicase B (HDHB) (accession # AF319995 ) were amplified from a full human brain cDNA library using the following primers: 5′ CCC AAG CTT GGG CTC TCC TCT AGC GGC GCA 3′; 5′ CGG GGT ACC CCG AGT TTC TTG ATT ATC GGT GGG C 3′. The 5′ primer used for PCR includes a HindIII site and the 3′ primer includes a KpnI site. These restriction digest sites were used to facilitate ligation of the PCR product into pcDNA3-tdimer2 (a gift of R. Tsein). 11 The resulting vector encoded a fusion protein composed of, from N- to C-terminus, the HDHB C-terminus and tdimer2. The S phase biosensor is a modified version of GFP-PCNAL2, which was a kind gift of M.C. Cardoso. 9 The original sequence for GFP-PCNAL2 includes an SV40 NLS, EGFP, an 18 amino acid flexible linker and full length PCNA (accession # NM_002592 ). The original parent vector, pEVRF (containing GFP-PCNAL2) and pEYFP-N1 (Clontech) were sequentially digested with AgeI and BsrGI and ligated to obtain the construct we refer to as the S phase biosensor.
Cell culture and biosensor expression Though
PC12 cells are a unique and reliable model system to study aspects of neuronal differentiation, they are not ideal for imaging experiments. We used a subpopulation of PC12 cells, Neuroscreen-1, because of their increased rate of growth and their improved cell spreading that eliminates the clumping often seen with PC12 cells (Cellomics, Inc.). 21 , 22 Despite the changes present in NS-1 cells that enhance their usefulness in imaging experiments, as with PC12 cells, NS-1 cells develop neurites upon the addition of NGF while the addition of serum allows for proliferation. For simplicity, we have referred throughout this study to the Neuroscreen-1 cells as PC12 cells. HeLa and NIH3T3 cells from the ATCC were grown and plated in high glucose DMEM supplemented with penicillin/streptomycin/glutamine (PSG) (1%) and fetal bovine serum (FBS) (10%) at 37°C in 10% CO 2 .
NCI-H292 cells
(ATCC) were grown and plated in RPMI supplemented with PSG (1%) and FBS (10%) in 5% CO 2 . PC12 cells were cultured in F12K media supplemented with horse serum (15%), FBS (2.5%) and PSG (1%) (full PC12 culture media) in dishes coated with collagen. All cell types were electroporated with the Amaxa system following manufacturer’s instructions (Amaxa Biosystems). Briefly, 10 6 (or 2 × 10 6 NS-1) cells were electroporated with 400 ng of the G 1 phase biosensor and 200 ng of the S phase biosensor. The PC12 cells were the most sensitive to different Nucleofector solutions and Amaxa programs. In our optimized electroporation protocol, we used Amaxa Kit V, with the above mentioned cell number and DNA concentrations, and program U29. Cells were plated into Costar 96-well plastic bottom plates, PC12 cells onto a layer of poly-L-lysine, by multichannel pipette in their respective culture media and incubated for 24 hours before assays were conducted. In the cell cycle phase duration experiment ( Fig. 3 ), PC12 cells were initially serum starved (F12K media containing PSG and 0.1% BSA). After 24 hours, half of the wells were dosed as follows: NGF-treated cells were given serum starvation media, as described above, supplemented with 25 ng/mL NGF. Serum-treated cells were grown in full PC12 culture media. After an additional 24 hours, the remaining wells were dosed as above, and imaged (see below). The cells dosed initially constitute the 24-61 hr samples, and those dosed at the start of imaging are the 0-37 hr samples. Serum starvation was not intended to induce quiescence or synchronization; rather, it was used to decrease basal NGF signaling. As the doubling time of these cells is between 30 and 37 hours, a period of serum starvation longer than 24 hours would be necessary for synchronization. PC12 cells used in the neurite outgrowth/cell cycle experiment ( Fig. 4 ) were either serum starved (as in the cell cycle phase duration experiment), or grown in full PC12 culture media. After 24 hours, media was replaced with either full PC12 culture media supplemented with 25 ng/mL NGF (Control), or serum starvation media as above supplemented with 25 ng/mL NGF (NGF). The serum in the control samples swamps out NGF-induced differentiation.
Image acquisition and data analysis
Time-lapse imaging was performed on an ImageXpress 5000A epifluorescence microscope with live cell capabilities (Universal Imaging). Images were acquired with a CCD camera resolution of 1,280 × 1,024 and a 10x plan fluorescence objective. Filter sets, including the excitation (Ex), excitation dichroic (Di) and emission (Em) filters (Chroma Technology Corporation) were as follows: Hoechst, D360-40x (Ex), 400DCLP (Di), 460-50m (Em); tdimer2, S565-55x (Ex), 86021 (Di), S650-75M (Em); YFP, S500-20x (Ex), 86002 (Di), S535-30 (Em). Humidity, temperature and CO 2 were adjusted to mimic incubator conditions. Well volume evaporation, media pH indicator color change, and general cell health were monitored to ensure environment suitability. Because of the extended time of PC12 imaging, the plate was removed from the microscope after 22 hours, new media with the specified NGF/serum supplement was added, the media was brought to the proper CO 2 saturation in an incubator for 2.5 hours, and the plate was placed back in the microscope for an additional 12.5 hours. Cells chosen for time-lapse analysis were selected based on visible expression of both biosensors and normal morphological appearance at the start of imaging. Selected cells were tracked manually for phase information using biosensor localization using Metamorph software (Universal Imaging). Phase durations were calculated for cells that had at least one incontrovertible frame of the phases both immediately preceding and following the timed phase. For example, if the duration of G 2 phase was calculated, that means the disappearance of large foci at end of the preceding S phase and nuclear envelope breakdown in the following M phase were also visible for the same cell. For the PC12 experiment, durations were tabulated as above for cells that: (1) could be followed through all the frames of the imaging, and (2) did not transition during the time during 2.5 hours when the plate was out of the microscope. The minutes when the plate was outside the microscope were included in the duration calculations. Plasma membrane extensions and cell diameters were measured using the Metamorph software line tool and calculating the ratio of plasma membrane extension length (pixels) to cell diameter (pixels). Plasma membrane extensions more than 1.5 × the diameter of the corresponding cell were classified as neurites. Data compilation and statistical analysis were performed in Excel (Microsoft). p-values for Figure 2A were determined by a two-tailed, two sample of equal variance, Student’s t-test. Confidence intervals (95%) were calculated thusly: ( ( ( ( 1 ∕ total ) ^ 2 ) ∗ sample ) + ( sample/total ^ 2 ) ^ 2 ∗ total ) ^ 0.5 ∗ 100 Flow cytometry Flow cytometry analysis was performed on HeLa cells 24 hours post electroporation and plating. Cells were harvested by trypsinization, pelleted at low rpm, washed with phosphate buffered saline (PBS), fixed in 70% ethanol, treated with 100 μg/mL RNAse A, and treated with 50 μg/mL propidium iodide (PI) to stain DNA. Cells were assayed on a BD FACSCalibur flow cytometer and data was analyzed using FlowJo software.
📊 Figures

Figure 1
Phase-dependent biosensor localization and combinatorial usage. (A) The G 1 phase biosensor construct consists of the HDHB C-terminus and tdimer2 (a dimeric red fluorescent protein). In G 1 phase (pos...

Figure 2
Time-lapse analysis of the combined biosensors measures cell cycle phase durations. (A) NIH3T3 cell example of the G 1 (top, red) and S (bottom, green) phase biosensors in all 4 phases: (G 1 ) nuclear...
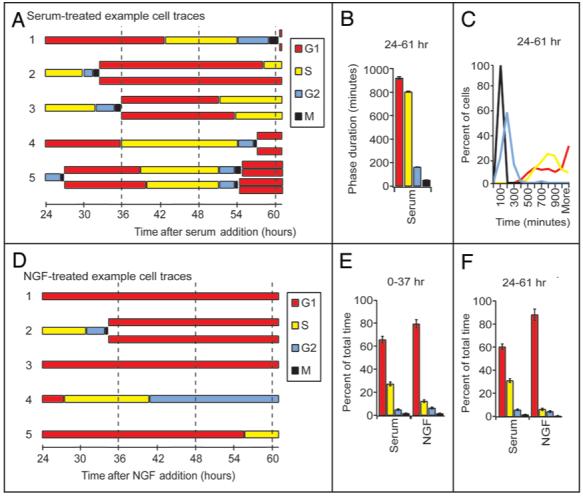
Figure 3
Serum and NGF treated PC12 cells have a marked difference in cell cycle progression. (A) Representative traces of PC12 cells serum starved for 24 hours then treated with serum and imaged after 24 hour...

Figure 4
Cell cycle effects and neurite extension caused by NGF addition. (A) PC12 cells transfected with both the G 1 phase biosensor (left) and a plasma membrane marker (Kras tail) (right) were imaged to ide...
Figure images are served from the NIH/NLM PubMed Central Open Access Subset or Europe PMC; copyright remains with the publishers and authors.
💬 Discussion
0 commentsNo comments yet. Be the first to start a discussion!
Leave a Comment