Abstract
BACKGROUND: Co-expression of proteins is generally achieved by introducing two (or more) independent plasmids into cells, each driving the expression of a different protein of interest. However, the relative expression levels may vary strongly between individual cells and cannot be controlled. Ideally, co-expression occurs at a defined ratio, which is constant among cells. This feature is of particular importance for quantitative single cell studies, especially those employing bimolecular Förster Resonance Energy Transfer (FRET) sensors. METHODOLOGY/PRINCIPAL FINDINGS: Four co-expression strategies based on co-transfection, a dual promotor plasmid, an internal ribosome entry site (IRES) and a viral 2A peptide were selected. Co-expression of two spectrally separable fluorescent proteins in single living cells was quantified. It is demonstrated that the 2A peptide strategy can be used for robust equimolar co-expression, while the IRES sequence allows expression of two proteins at a ratio of approximately 3:1. Combined 2A and IRES elements were used for the construction of a single plasmid that drives expression of three individual proteins, which generates a FRET sensor for measuring heterotrimeric G-protein activation. The plasmid drives co-expression of donor and acceptor tagged subunits, with reduced heterogeneity, and can be used to measure G-protein activation in single living cells. CONCLUSIONS/SIGNIFICANCE: Quantitative co-expression of two or more proteins can be achieved with little cell-to-cell variability. This finding enables reliable co-expression of donor and acceptor tagged proteins for FRET studies, which is of particular importance for the development of novel bimolecular sensors that can be expressed from single plasmid.
🔬 Techniques
💻 Software
✨ Fluorophores
🧪 Sample Preparation
🔬 Cell Lines
🏭 Microscope Brands
🧪 Reagent Suppliers
🔎 Objectives
💻 Software Details
🏛️ Research Organizations (ROR)
Affiliated research institutions:
📋 Methods
Methodology/Principal Findings Four co-expression strategies based on co-transfection, a dual promotor plasmid, an internal ribosome entry site (IRES) and a viral 2A peptide were selected. Co-expression of two spectrally separable fluorescent proteins in single living cells was quantified. It is demonstrated that the 2A peptide strategy can be used for robust equimolar co-expression, while the IRES sequence allows expression of two proteins at a ratio of approximately 3:1. Combined 2A and IRES elements were used for the construction of a single plasmid that drives expression of three individual proteins, which generates a FRET sensor for measuring heterotrimeric G-protein activation. The plasmid drives co-expression of donor and acceptor tagged subunits, with reduced heterogeneity, and can be used to measure G-protein activation in single living cells.
Methods Plasmid Construction For the co-expression analysis we used two bright visible fluorescent proteins (VFPs), mTurquoise [8] and mVenus(L68V) [9] , which are indicated as CFP and YFP respectively. The pBUD-CE4 vector was from Invitrogen (Breda, The Netherlands) and uses the Zeocin resistance marker. VFPs were cut using HindIII and XbaI from the VFP-N1 vector (Clontech) and inserted behind the CMV promoter of pBUD, which was cut with the same enzymes. To insert a VFP downstream of EF1a, the VFPs were amplified using the fw-EF 5′- GGA AGATCT CCACCATGGTGAGCAAGG-3′ and the rv-EF primer 5′- GGA AGATCT GTCGCGGCCGCTTTACTTG-3′ with a VFP-N1 plasmid as template. The product was cut with BglII and inserted into pBud cut with BglII. Two constructs were made in this way; CMV:CFP-EF1a:YFP and CMV:YFP-EF1a:CFP. Construction of 2A plasmids was described previously [8] . A 2A linker is inserted between the coding sequences of the VFPs, encoding the peptide EGRGSLLTCGDVEENPGPGS. Two plasmids are constructed CFP-2A-YFP and YFP-2A-CFP. A mutated non-cleavable linker encodes EGRGSLLTCGDVEENAAPGS and two plasmids based on this linker are denoted as CFP-XX-YFP and YFP-XX-CFP. The pPRIG-IRES vector [11] which carries the ECMV IRES sequence was obtained from Patrick Martin. The IRES sequence was amplified by PCR using the fw-IRES 5′- CTA GCTAGC GCCACCATGG AGATCT GGGCCCCTATAGTGTCAC-3′ and rv-IRES primer 5′- CGC GGATCC GGTTGTGGCCATATTATC-3′ . A Clontech-C1 vector and the amplified IRES were cut using the restriction enzymes NheI and BamHI and ligated. The VFPs were cut from the pBUD vector using BglII and ligated upstream of the IRES and cut from the 2A plasmid vector using BamHI and ligated downstream of the IRES. Two constructs were made CFP-IRES-YFP and YFP-IRES-CFP. Gαq-mTurquoiseΔ6, Gβ1 and YFP-Gγ2 were described previously [4] and used as components for a single plasmid expressing these three proteins. Using PCR-based cloning the plasmids expressing Gβ1-2A-YFP-Gγ2 and Gβ1-XX-YFP-Gγ2 were made. Two plasmids were subsequently constructed encoding either Gαq-mTurquoiseΔ6-IRES-Gβ1-2A-YFP-Gγ2 (Gα-IRES-Gβ-2A-Gγ) or Gβ1-2A-YFP-Gγ2-IRES-Gαq- mTurquoiseΔ6 (Gβ-2A-Gγ-IRES-Gα). The sequences and detailed construction procedures of these plasmids are available upon request.
Show full methods section
Methodology/Principal Findings Four co-expression strategies based on co-transfection, a dual promotor plasmid, an internal ribosome entry site (IRES) and a viral 2A peptide were selected. Co-expression of two spectrally separable fluorescent proteins in single living cells was quantified. It is demonstrated that the 2A peptide strategy can be used for robust equimolar co-expression, while the IRES sequence allows expression of two proteins at a ratio of approximately 3:1. Combined 2A and IRES elements were used for the construction of a single plasmid that drives expression of three individual proteins, which generates a FRET sensor for measuring heterotrimeric G-protein activation. The plasmid drives co-expression of donor and acceptor tagged subunits, with reduced heterogeneity, and can be used to measure G-protein activation in single living cells.
Methods Plasmid Construction For the co-expression analysis we used two bright visible fluorescent proteins (VFPs), mTurquoise [8] and mVenus(L68V) [9] , which are indicated as CFP and YFP respectively. The pBUD-CE4 vector was from Invitrogen (Breda, The Netherlands) and uses the Zeocin resistance marker. VFPs were cut using HindIII and XbaI from the VFP-N1 vector (Clontech) and inserted behind the CMV promoter of pBUD, which was cut with the same enzymes. To insert a VFP downstream of EF1a, the VFPs were amplified using the fw-EF 5′- GGA AGATCT CCACCATGGTGAGCAAGG-3′ and the rv-EF primer 5′- GGA AGATCT GTCGCGGCCGCTTTACTTG-3′ with a VFP-N1 plasmid as template. The product was cut with BglII and inserted into pBud cut with BglII. Two constructs were made in this way; CMV:CFP-EF1a:YFP and CMV:YFP-EF1a:CFP. Construction of 2A plasmids was described previously [8] . A 2A linker is inserted between the coding sequences of the VFPs, encoding the peptide EGRGSLLTCGDVEENPGPGS. Two plasmids are constructed CFP-2A-YFP and YFP-2A-CFP. A mutated non-cleavable linker encodes EGRGSLLTCGDVEENAAPGS and two plasmids based on this linker are denoted as CFP-XX-YFP and YFP-XX-CFP. The pPRIG-IRES vector [11] which carries the ECMV IRES sequence was obtained from Patrick Martin. The IRES sequence was amplified by PCR using the fw-IRES 5′- CTA GCTAGC GCCACCATGG AGATCT GGGCCCCTATAGTGTCAC-3′ and rv-IRES primer 5′- CGC GGATCC GGTTGTGGCCATATTATC-3′ . A Clontech-C1 vector and the amplified IRES were cut using the restriction enzymes NheI and BamHI and ligated. The VFPs were cut from the pBUD vector using BglII and ligated upstream of the IRES and cut from the 2A plasmid vector using BamHI and ligated downstream of the IRES. Two constructs were made CFP-IRES-YFP and YFP-IRES-CFP. Gαq-mTurquoiseΔ6, Gβ1 and YFP-Gγ2 were described previously [4] and used as components for a single plasmid expressing these three proteins. Using PCR-based cloning the plasmids expressing Gβ1-2A-YFP-Gγ2 and Gβ1-XX-YFP-Gγ2 were made. Two plasmids were subsequently constructed encoding either Gαq-mTurquoiseΔ6-IRES-Gβ1-2A-YFP-Gγ2 (Gα-IRES-Gβ-2A-Gγ) or Gβ1-2A-YFP-Gγ2-IRES-Gαq- mTurquoiseΔ6 (Gβ-2A-Gγ-IRES-Gα). The sequences and detailed construction procedures of these plasmids are available upon request.
Cell culture and transfection
HeLa cells were obtained from the American Tissue Culture Collection (ATCC; Manassas, VA, USA) and cultured in DMEM+Glutamax (Invitrogen, #61965), 10% FBS, Penicillin (100 U/ml) and Streptomycin (100 µg/ml). Cells were transfected using 1-2 µl lipofectamine (Invitrogen), 0.5 µg plasmid DNA and 50 µl OptiMEM per 35 mm dish holding a 24 mm Ø #1 coverslip.
Western Blot
Two days after transfection, cells from a single well of a 6-well plate were lysed by addition of 200 µl lysis buffer (PBS, 1% Triton X-100, 0.5% sodium deoxycholate 0.1% sodium dodecyl sulphate) and harvested by scraping. After spinning, 15 µl of the supernatant was used for SDS-PAGE. Immunolabeling was performed with 1∶2000 AntiGFP-serum (Invitrogen, A6455) and 1∶10,000 Goat anti-Rabbit IgG(H&L)-HRP Conjugate (Biorad, 170-6516) as a secondary antibody. Detection was performed with the Amersham Western Blotting Detection System (GE Healthcare RPN2132) and Hyperfilm ECL (28906838).
Fluorescence imaging
Coverslips with cells were mounted in an Attofluor cell chamber (Invitrogen) and submerged in microscopy medium (20 mM HEPES (pH = 7.4), 137 mM NaCl, 5.4 mM KCl, 1.8 mM CaCl 2 , 0.8 mM MgCl 2 and 20 mM glucose). Fluorescence imaging experiments were performed on a Zeiss 200M inverted fluorescence microscope using a Zeiss Plan-Neofluar 40×/1.30 Ph3 oil objective. Excitation light from a Cairn Xenon Arc lamp was selected by a monochromator (Cairn Research). For cyan fluorescent protein, 420 nm excitation light (slit 30 nm) was used and in case of yellow fluorescent proteins, 500 nm excitation light (slit 30 nm) was applied. Additional filtering of was done with CFP excitation filter E460SP (375-460) and YFP excitation filter E520SP (375–520). The dichroic mirror 455DCLP and emission filter BP470/30 were used for CFP and a dichroic mirror 515DCXR and emission filter BP535/30 were used for YFP fluorescence. Metamorph software was used for controlling the equipment. Exposure times were typically 100 ms for the CFP channel and 50 ms for the YFP channel. FRET ratio imaging was performed at 37°C as described before on at least 3 different samples [4] . FRET ratio imaging data were processed using ImageJ ( http://rsbweb.nih.gov/ij/ ) by quantifying the average fluorescence intensity of individual cells in the CFP and the YFP channel and subtracting the background obtained from a region of interest without cells. These intensity data were used to calculate the YFP/CFP ratio. The ratio time-traces from at least 12 cells were not normalized but directly averaged and the standard error of the mean was calculated. The data was subsequently scaled to display the FRET ratio change as a percentage. This procedure was used to depict the heterogeneity of the ratios that we measured and is somewhat different to the processing procedure that is normally performed, in which heterogeneity and folding/maturation of the fluorescent proteins is compensated for by normalizing the individual CFP and YFP traces [4] , [22] , [23] . FLIM was performed as described before [4] at room temperature.
Image Correction and Analysis
Fluorescence images for quantitative co-expression analysis were background corrected and subsequently corrected for shading using a homogenous fluorescent plastic slide (Chroma). Fluorescence intensity of single cells was quantified by drawing an ROI and measuring average fluorescence intensity in both CFP and YFP channels (in arbitray units). All corrections and analyses were performed using the ImageJ software with ObjectJ plug-in and macros. Graphs and fits of the average CFP versus YFP intensity of individual cells were made with KaleidaGraph. The correlation coefficient was determined using Excel (RSQ function).
FCS
Cell extracts were freshly prepared from single wells of a 6-well plate. Transfected cells were washed two times with cold PBS. Cells were lysed with cold 300 µl PBS+1% (v/v) Triton X-100. After centrifugation (5 min. at 16,000 g), 200 µl supernatant was collected and the extracts were diluted 10–20x with PBS+0.01% Triton X-100. Measurements were performed in glass-bottomed 96 wells plates (Whatman), placed on top of an inverted Fluoview 1000 laser scanning microscope (Olympus) equipped with a water immersed 60x UPLSApo objective (NA 1.2). The light of a 440 nm pulsing laser diode (Picoquant), operated at 20 MHz, was combined with the 514 nm line of a continuous wave Ar + laser (Melles-Griot), using a polarizing beam cube in the excitation path. Via a 440/514/594 main dichroic mirror (Chroma) the emission light was guided through a size adjustable pinhole in the Olympus confocal detection box towards the fibre output channel. The optical fibre was coupled to a custom-made detection box (Picoquant) containing two avalanche photodiode detectors (MPD). An LP515 dichroic mirror (Semrock) was placed in the beam path to split the emission light and 475/42 (CFP) and 534/30 (YFP) emission filters (Semrock) were placed in front of the detectors. The photon arrival times were recorded by a Picoharp 300 unit (Picoquant). Before correlating the detector signals, the raw data traces were time-gated in SymPhoTime 5.1.3 software (Picoquant) to prevent cross-talk of the dyes. Photons arriving in the CFP channel within 25 ns of the 440 nm excitation pulse were considered to be the true CFP signal, while the photons arriving in the YFP channel 25–50 ns after the 440 nm excitation pulse are contributing to the YFP signal. The signals were autocorrelated and the resulting curves were analysed with the standard triplet-diffusion model [24] to retrieve particle numbers. Control experiments were performed using solutions of Atto425 (D = 410 m 2 .s −1 ) and Alexa 488 (D = 400 m 2 .s -1 ) to calibrate the size and overlap of the CFP, YFP detection volumes. The obtained particle numbers were corrected for background signal [24] .
Supporting Information Figure S1 Quantitative co-expression analysis of YFP-Gγ2 versus Gαq-CFP. The results of three different plasmids are shown, Gα+Gβ+Gγ (r 2 = 0.004), Gα-IRES-Gβ-2A-Gγ (r 2 = 0.03) and Gβ-2A-Gγ-IRES-Gα (r 2 = 0.5). The r 2 values between brackets represent the square of the correlation coefficient. The dots represent fluorescence intensity data from a single cell. The data set was fit with a linear line as a visual aid. (TIF) Click here for additional data file.
📊 Figures
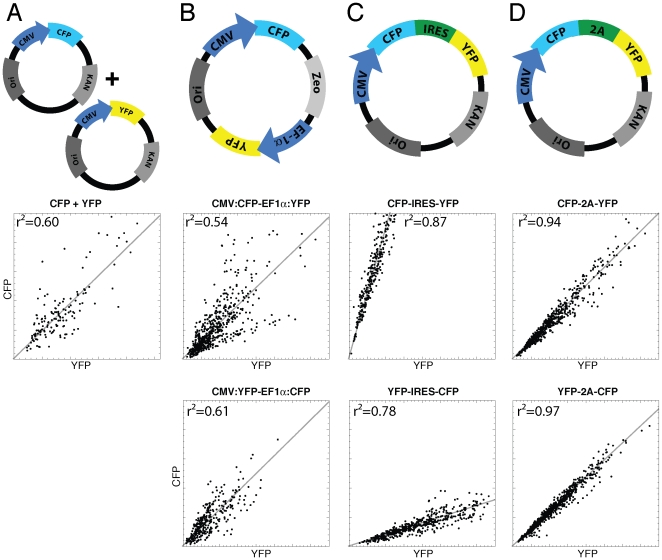
Figure 1
Characterization of different co-expression strategies by quantification of cyan fluorescent protein and yellow fluorescent protein fluorescence from single cells.
Four different strategies for co-expression are analyzed: mixing two plasmids (A), two promoters on a single plasmid (B), an internal ribosome entry site (C) and a 2A viral cleavable peptide sequence ...
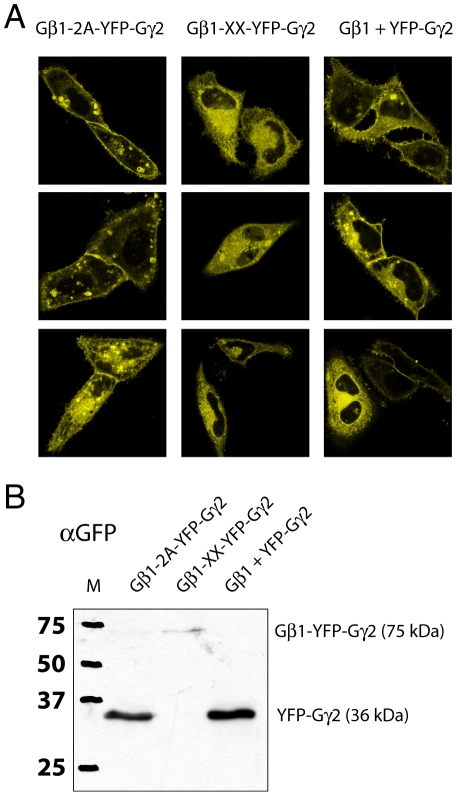
Figure 2
Analysis of Gu03b21 and YFP-Gu03b32 co-expression from a single plasmid or separate plasmids.
(A) Three representative images of the localization of YFP-Gu03b32 by confocal microscopy expressed from plasmid encoding Gu03b21-2A-YFP-Gu03b32, Gu03b21-XX-YFP-Gu03b32 or two separate plasmids, Gu03b...
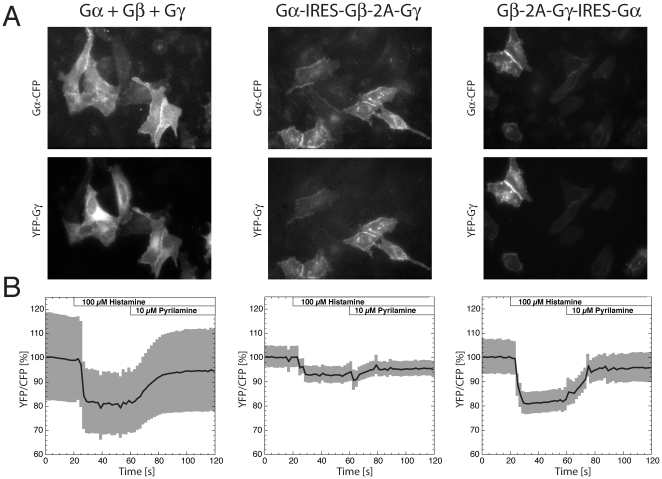
Figure 3
Characterization of a FRET sensor for monitoring G-protein activation expressed from a single plasmid or multiple plasmids.
(A) Gu03b1q-CFP, untagged Gu03b21 and YFP-Gu03b32 were expressed by either mixing three separate plasmids (Gu03b1+Gu03b2+Gu03b3) or from a single plasmid in two orientations, Gu03b1-IRES-Gu03b2-2A-Gu0...
Figure images are served from the NIH/NLM PubMed Central Open Access Subset or Europe PMC; copyright remains with the publishers and authors.
💬 Discussion
0 commentsNo comments yet. Be the first to start a discussion!
Leave a Comment