Abstract
The inheritance of the histone H3 variant CENP-A in nucleosomes at centromeres following DNA replication is mediated by an epigenetic mechanism. To understand the process of epigenetic inheritance, or propagation of histones and histone variants, as nucleosomes are disassembled and reassembled in living eukaryotic cells, we have explored the feasibility of exploiting photo-activated localization microscopy (PALM). PALM of single molecules in living cells has the potential to reveal new concepts in cell biology, providing insights into stochastic variation in cellular states. However, thus far, its use has been limited to studies in bacteria or to processes occurring near the surface of eukaryotic cells. With PALM, one literally observes and ‘counts’ individual molecules in cells one-by-one and this allows the recording of images with a resolution higher than that determined by the diffraction of light (the so-called super-resolution microscopy). Here, we investigate the use of different fluorophores and develop procedures to count the centromere-specific histone H3 variant CENP-A Cnp1 with single-molecule sensitivity in fission yeast ( Schizosaccharomyces pombe ). The results obtained are validated by and compared with ChIP-seq analyses. Using this approach, CENP-A Cnp1 levels at fission yeast ( S. pombe ) centromeres were followed as they change during the cell cycle. Our measurements show that CENP-A Cnp1 is deposited solely during the G2 phase of the cell cycle.
🔬 Techniques
🧬 Organisms
✨ Fluorophores
🧪 Sample Preparation
🏭 Microscope Brands
🧪 Reagent Suppliers
📷 Detectors
🔎 Objectives
🎨 Filters
🏛️ Research Organizations (ROR)
Affiliated research institutions:
📋 Methods
5.1.
Yeast strains
The genotypes of the strains used in this study are listed in the electronic supplementary material, table S1. Standard methods and techniques for fission yeast genetic manipulations were employed. A two-step process was used to N-terminally tag the endogenous Cnp1 locus with either mEos2 or PAmCherry1. Firstly, a PCR-amplified cassette containing the ura4:nmt41 fragment from the pAW33 plasmid [ 35 ] was incorporated by homologous recombination at the N-terminal Cnp1 locus. The ura4:nmt41 insertion was then replaced by a homologous recombination with a fragment containing either the mEos2 [ 14 ] or PAmCherry1 cDNA [ 20 ], to generate the N-terminally tagged mEos2 (DL56) and PAmCherry1 (DL70) Cnp1 strains containing the native and intact Cnp1 promoter. The pREPnmt81mEos2 plasmid containing the mEos2 gene was constructed by inserting the mEos2 fragment generated by PCR from pRSETamEos2 [ 14 ] into pREPNT81 [ 36 ]. All cloning and strains were verified by DNA sequencing. 5.2.
Sample preparation for photo-activated localization microscopy imaging
All strains used for imaging were grown at 30°C for six to eight cell divisions to mid log phase (OD 600 0.5–1.0) in Edinburgh minimal medium (EMM) (containing 200 mg l −1 amino acids as required). To vary the expression levels of the mEos2 fluorophore, thiamine (5, 10, 25 µg ml −1 ) was added to the media of strains carrying the nmt81mEos2 plasmid. For fixed cell samples, cells (2.0 × 10 7 ) were resuspended in 1 ml of phosphate buffer (100 mM sodium phosphate pH 7.5) containing 1 per cent paraformaldehyde and incubated at room temperature for 20 min. Fixed cells were washed (three times) with 1 ml of phosphate buffer, and the pellet resuspended in 400 µl of phosphate buffer. Then, 200 µl of fixed cells was added to a single well of a Labtek 8/well glass chamber slide (Nunc). Before use, Labtek slides were cleaned with 0.5 per cent hydrofluoric acid and then coated with polylysine (Sigma). After a 10 min incubation at room temperature, non-adherent cells were washed away with phosphate buffer. To prevent cells from shaking/wobbling, adherent cells were briefly fixed to the polylysine-coated slide with 1 per cent paraformaldehyde/phosphate buffer for 5 min at room temperature. For imaging, cells were overlayed with phosphate-buffered solution. For live cell samples, cells (1.0 × 10 7 ) were mixed with 1 ml of 0.5 per cent low melting point agarose (Sigma) containing EMM media (with 200 mg l −1 amino acids as required). Then, 200 μl of the cell/agarose/EMM mix was overlayed onto a single well of a Labtek 8/well glass chamber slide (Nunc). Before use, Labtek slides were cleaned with 0.5 per cent hydrofluoric acid. Once set, 200 µl of EMM was added to each well to prevent the agarose pads from drying out. All live-cell imaging was carried out at room temperature. 5.3.
Show full methods section
5.1.
Yeast strains
The genotypes of the strains used in this study are listed in the electronic supplementary material, table S1. Standard methods and techniques for fission yeast genetic manipulations were employed. A two-step process was used to N-terminally tag the endogenous Cnp1 locus with either mEos2 or PAmCherry1. Firstly, a PCR-amplified cassette containing the ura4:nmt41 fragment from the pAW33 plasmid [ 35 ] was incorporated by homologous recombination at the N-terminal Cnp1 locus. The ura4:nmt41 insertion was then replaced by a homologous recombination with a fragment containing either the mEos2 [ 14 ] or PAmCherry1 cDNA [ 20 ], to generate the N-terminally tagged mEos2 (DL56) and PAmCherry1 (DL70) Cnp1 strains containing the native and intact Cnp1 promoter. The pREPnmt81mEos2 plasmid containing the mEos2 gene was constructed by inserting the mEos2 fragment generated by PCR from pRSETamEos2 [ 14 ] into pREPNT81 [ 36 ]. All cloning and strains were verified by DNA sequencing. 5.2.
Sample preparation for photo-activated localization microscopy imaging
All strains used for imaging were grown at 30°C for six to eight cell divisions to mid log phase (OD 600 0.5–1.0) in Edinburgh minimal medium (EMM) (containing 200 mg l −1 amino acids as required). To vary the expression levels of the mEos2 fluorophore, thiamine (5, 10, 25 µg ml −1 ) was added to the media of strains carrying the nmt81mEos2 plasmid. For fixed cell samples, cells (2.0 × 10 7 ) were resuspended in 1 ml of phosphate buffer (100 mM sodium phosphate pH 7.5) containing 1 per cent paraformaldehyde and incubated at room temperature for 20 min. Fixed cells were washed (three times) with 1 ml of phosphate buffer, and the pellet resuspended in 400 µl of phosphate buffer. Then, 200 µl of fixed cells was added to a single well of a Labtek 8/well glass chamber slide (Nunc). Before use, Labtek slides were cleaned with 0.5 per cent hydrofluoric acid and then coated with polylysine (Sigma). After a 10 min incubation at room temperature, non-adherent cells were washed away with phosphate buffer. To prevent cells from shaking/wobbling, adherent cells were briefly fixed to the polylysine-coated slide with 1 per cent paraformaldehyde/phosphate buffer for 5 min at room temperature. For imaging, cells were overlayed with phosphate-buffered solution. For live cell samples, cells (1.0 × 10 7 ) were mixed with 1 ml of 0.5 per cent low melting point agarose (Sigma) containing EMM media (with 200 mg l −1 amino acids as required). Then, 200 μl of the cell/agarose/EMM mix was overlayed onto a single well of a Labtek 8/well glass chamber slide (Nunc). Before use, Labtek slides were cleaned with 0.5 per cent hydrofluoric acid. Once set, 200 µl of EMM was added to each well to prevent the agarose pads from drying out. All live-cell imaging was carried out at room temperature. 5.3.
Photo-activated localization microscopy microscope
PALM experiments were performed on a custom-built microscope described previously [ 37 ]. A multi-line argon–krypton laser (Innova 70C, Coherent, USA) and a diode laser emitting at 378 or 405 nm (Cube, Coherent, USA) were coupled to an inverted microscope (IX71, Olympus, Japan) equipped with a 60× oil immersion objective (PlanApo 60×, NA 1.45, Olympus) that results in a depth of field value of approximately 800 nm. Excitation light and fluorescence light were separated using a dichroic mirror (FF410/504/588/669-Di01, AHF, Germany), and appropriate filters were placed in the detection path (568LP and BP610/75, AHF, Germany). The fluorescence signal was recorded with an electron-multiplying CCD camera (EMCCD; Andor Ixon DU897, Belfast, UK). The spot density was kept below 0.1 per frame to avoid multiple-spot events that would lead to quantification errors (see the electronic supplementary material, figure S3 d ) [ 38 ]. Raw data were processed using the rapid STORM software [ 39 ]. A detailed description of the single-molecule counting analysis is described in the electronic supplementary material, section ‘Material and methods’. 5.4.
CENP-A Cnp1 nucleosome mapping
ChIP was performed as described [ 40 ] with the following modifications. S. pombe strains were grown in complete media (YES) at 32°C to 5 × 10 6 cells ml −1 , fixed for 15 min in 1 per cent formaldehyde (Sigma) and treated with 0.4 mg ml −1 Zymolase (AMS Biotechnology Europe) in PEMS for 1 h. To fragment the DNA, 300 µl aliquots of sample was either sonicated for 20 min in a Bioruptor (Diagenode) or treated with 0.4 U miccrococcal nuclease (MNase; Sigma) at 37°C for 6 min in MNase digestion buffer (50 mM Hepes pH 7.5, 50 mM NaCl, 5 mM MgCl 2 , 1 mM CaCl 2 , 1× Proteinase inhibitor mix (Sigma) and 1 mM phenylmethylsulfonyl fluoride (PMSF)). The MNase reaction was stopped by adding 300 µl lysis buffer 2 (50 mM Hepes pH 7.5, 255 mM NaCl, 12 mM EDTA, 2% Triton X-100, 0.2% sodium deoxycholate, 1× Proteinase inhibitor mix and 1 mM PMSF). Samples were electrophoresed on a 1.5 per cent agarose gel to check the MNase digestion. The samples were incubated for 4–5 h with 10 µl α-Cnp1-antiserum [ 41 ] and 40 µl Protein G agarose beads (Roche). The beads were washed as described and incubated with 1 per cent SDS overnight at 65°C. The supernatant was purified using a PCR purification kit (Qiagen). Solexa/Illumina libraries were then prepared as described in the manufacturer’s hand book (Illumina) with the following modifications: bar-coded linkers were used for ligation (see the electronic supplementary material, table S2), and the 150 ± 50 bp library fraction was extracted from an agarose gel to obtain mainly nucleosomal-sized DNA fragments. These fragments were sequenced using an Illumina GAII sequencer (The Genepool, Edinburgh, UK). To map ChIP-seq data, Fastq files were mapped onto the S. pombe genome assembly RefSeq NC_003424.1, NC_003424.2, NC_003424.3 (Université de Montreal, Canada) using N ovoalign ( www.novocraft.com ). Mapped reads were divided by the number of possible mapping events per sequencing fragment (which accounts for repeated elements in the genome). From the MNase-digested samples, paired-end reads were mapped (a total of 810 000 paired reads). From the sonicated samples, 2 300 000 single-end reads were mapped with the assumption that the library fragments were on average 150 bp. The number of reads in all samples were normalized to the 810 000 paired-end reads. Biological replicates of both sequencing experiments were performed, and a total of 1 100 000 or 860 000 reads for MNase digestion or sonication were mapped, respectively.
Supplementary Material Supplementary methods, figures and tables
📊 Figures
Figureu00a01.
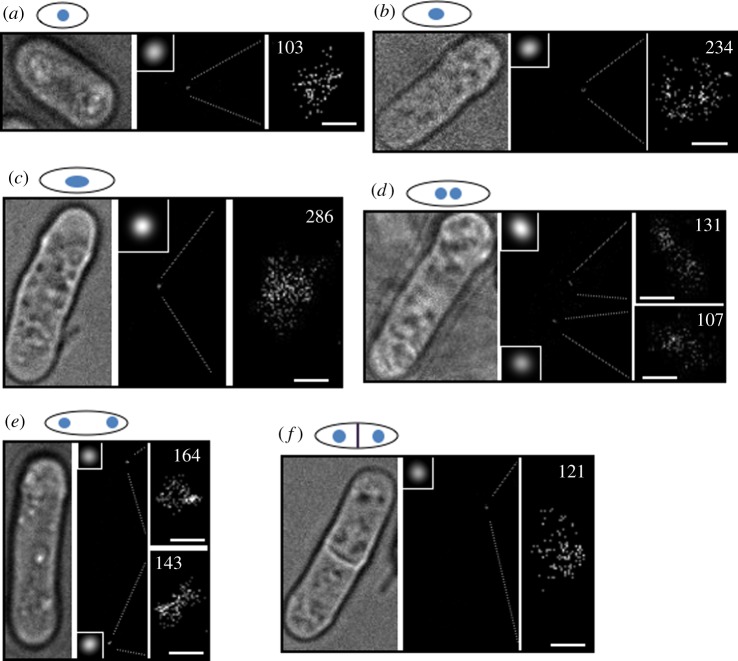
Photo-activated localization microscopy imaging of Schizosaccharomyces pombe mEos2u2013CENP-A Cnp1 at different stages of the cell cycle. Representative images from ( a ) early G2, ( b ) mid-G2, ( c )...
Figureu00a02.
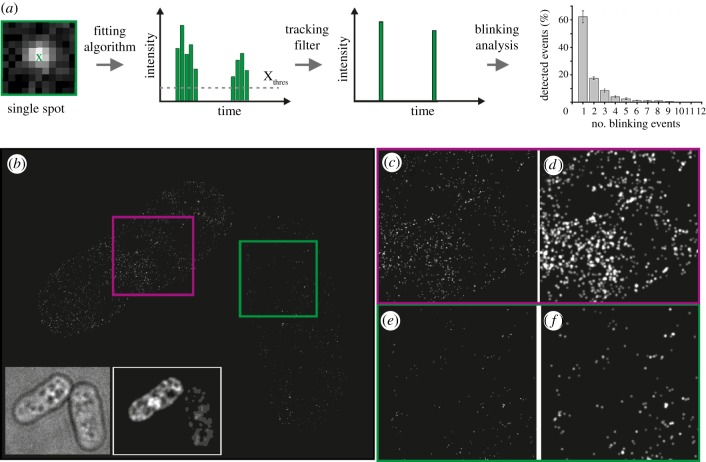
Counting isolated/free mEos2 fluorescent protein molecules using PALM. ( a ) Schematic outlining the process used to determine the average number of blinking events for single mEos2 fluorophores. Usin...
Figureu00a03.
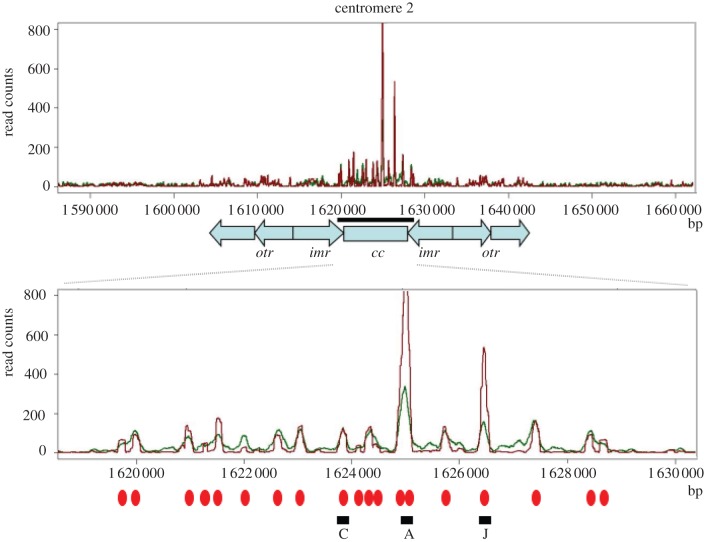
Distribution of CENP-A Cnp1 nucleosomes across the centromere from chromosome 2. Genome view of the centromere region showing ChIP-seq binding profiles of CENP-A Cnp1 from sonicated (green) and MNase-...
Figureu00a04.
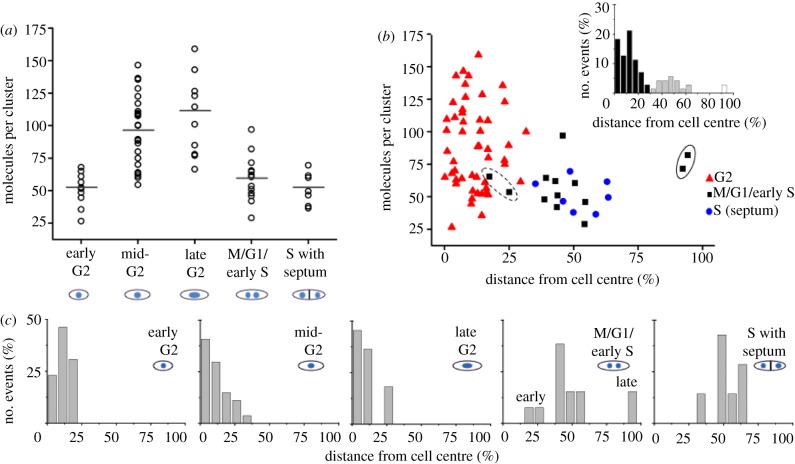
Levels of CENP-A Cnp1 molecules peak during late G2. ( a ) Plot of mEos2u2013CENP-A Cnp1 molecules during the cell cycle (strain DL56): early G2 (up to 10.5 u00b5m), mid-G2 (10.5u201313.5 u00b5m), lat...
Figure images are served from the NIH/NLM PubMed Central Open Access Subset or Europe PMC; copyright remains with the publishers and authors.
💬 Discussion
0 commentsNo comments yet. Be the first to start a discussion!
Leave a Comment