Abstract
Compartmentalization of the nucleus is now recognized as an important level of regulation influencing specific nuclear processes. The mechanism of factor organization and the movement of factors in nuclear space have not been fully determined. Splicing factors, for example, have been shown to move in a directed manner as large intact structures from sites of concentration to sites of active transcription, but splicing factors are also thought to exist in a freely diffusible state. In this study, we examined the movement of a splicing factor, ASF, green fluorescent fusion protein (ASF-GFP) using time-lapse microscopy and the technique fluorescence recovery after photobleaching (FRAP). We find that ASF-GFP moves at rates up to 100 times slower than free diffusion when it is associated with speckles and, surprisingly, also when it is dispersed in the nucleoplasm. The mobility of ASF is consistent with frequent but transient interactions with relatively immobile nuclear binding sites. This mobility is slightly increased in the presence of an RNA polymerase II transcription inhibitor and the ASF molecules further enrich in speckles. We propose that the nonrandom organization of splicing factors reflects spatial differences in the concentration of relatively immobile binding sites.
🔬 Techniques
🔭 Microscopes
💻 Software
✨ Fluorophores
🧪 Sample Preparation
🔬 Cell Lines
🏭 Microscope Brands
🧪 Reagent Suppliers
📷 Detectors
🔎 Objectives
💻 Software Details
🏛️ Research Organizations (ROR)
Affiliated research institutions:
📋 Methods
Cell Culture and Transfections Mouse 10T1/2 cells, human intestinal smooth muscle cells, human lung cancer cells, human neuroblastoma cells, or Indian muntjac fibroblasts were plated onto glass coverslips and cultured 1–2 d in growth medium until 50% confluent. At this point, complete medium was removed and cells were transfected using lipofectamine (GIBCO BRL) and an ASF–GFP fusion protein construct described previously ( Sleeman et al. 1998 ). After transfection, cells were cultured in complete medium for ∼24 h before imaging. In some cases, staurosporine (Sigma-Aldrich) or 5,6-dichlorobenzimidazole riboside (DRB; Sigma-Aldrich) were added at 100 μg/ml and 75 μg/ml, respectively, between 2 and 4 h before imaging.
Live Cell Imaging
Coverslips were placed on glass slides containing several drops of media surrounded by vacuum grease. The vacuum grease allows an airtight seal to form. Cells are capable of growing in these conditions for least 24 h at 22°C. For 4-D imaging, a Zeiss AxioPlan II microscope, a 100× 1.4 NA lens, and a 12-bit cooled CCD (Cooke SensiCam) were used to collect images. Images were further processed by digital deconvolution using AutoQuant Autodeblur. For FRAP, the laser scanning microscope (Zeiss LSM 510) was set to laser scanning mode and the initial imaging conditions were determined. A 25× 0.8 NA lens was used for these experiments and pixel sampling was set between 90 and 120 nm/pixel. The argon laser spectral line at a wavelength of 488 nm was set to an intensity of no greater than 1.25% of its total power (15 mW) for image collection. A mask, which typically covered half of the cell nucleus, was then photobleached using 100 iterations at 3.75 mW laser power. 12-bit images were collected before, immediately after, and at defined intervals after bleaching. Our total experiment time was set to 500 s, which was sufficient for complete recovery from photobleaching. For quantitative imaging, a 3-μm wide strip of the cell was photobleached and then scanned during recovery. Photobleaching was completed in ∼2 s. Similar proportions of GFP (∼25%) and ASF–GFP (∼30%) total nuclear fluorescence were lost during photobleaching. Because the GFP protein recovered very rapidly, it was necessary to only scan the photobleached region in order to adequately sample GFP recovery. For simplicity in the graphical presentation of the data, the initial post-bleach value of the photobleached region was normalized to zero by subtraction and the maximal value obtained during recovery was normalized to 100. The t 1/2 of recovery can then be directly read off of the graph as the 50% value. Identical results were obtained when 2-μm spots, rather than strips, were bleached. To determine the immobile population of ASF–GFP, the maximal recovered value was divided by the starting value of the photobleached region after correction for total nuclear fluorescence lost during photobleaching. This correction factor was determined by measuring the total nuclear fluorescence immediately after photobleaching and dividing this value by the total nuclear fluorescence immediately before bleaching. The laser intensity during recovery was set so that no measurable loss of fluorescence was observed during the monitoring period. To track the mobility of HDAC4–GFP domains and small foci enriched in ASF–GFP we used the track points function in Universal Imaging's MetaMorph 4.0 imaging software. The image sequences were viewed on screen at 200% magnification and the center of each focus was identified with a mouse. For HDAC4 domains, the structures sometimes moved out of the plane of focus. In this instance, the foci could still be followed by identifying slightly elevated regions of signal intensity. Although difficult to identify in single frames, these could be easily identified by rapidly moving between the several frames where the domains move into and out of focus. This occurred for two of the five foci tracked. These foci, however, remained in focus for most of the time course.
Show full methods section
Cell Culture and Transfections Mouse 10T1/2 cells, human intestinal smooth muscle cells, human lung cancer cells, human neuroblastoma cells, or Indian muntjac fibroblasts were plated onto glass coverslips and cultured 1–2 d in growth medium until 50% confluent. At this point, complete medium was removed and cells were transfected using lipofectamine (GIBCO BRL) and an ASF–GFP fusion protein construct described previously ( Sleeman et al. 1998 ). After transfection, cells were cultured in complete medium for ∼24 h before imaging. In some cases, staurosporine (Sigma-Aldrich) or 5,6-dichlorobenzimidazole riboside (DRB; Sigma-Aldrich) were added at 100 μg/ml and 75 μg/ml, respectively, between 2 and 4 h before imaging.
Live Cell Imaging
Coverslips were placed on glass slides containing several drops of media surrounded by vacuum grease. The vacuum grease allows an airtight seal to form. Cells are capable of growing in these conditions for least 24 h at 22°C. For 4-D imaging, a Zeiss AxioPlan II microscope, a 100× 1.4 NA lens, and a 12-bit cooled CCD (Cooke SensiCam) were used to collect images. Images were further processed by digital deconvolution using AutoQuant Autodeblur. For FRAP, the laser scanning microscope (Zeiss LSM 510) was set to laser scanning mode and the initial imaging conditions were determined. A 25× 0.8 NA lens was used for these experiments and pixel sampling was set between 90 and 120 nm/pixel. The argon laser spectral line at a wavelength of 488 nm was set to an intensity of no greater than 1.25% of its total power (15 mW) for image collection. A mask, which typically covered half of the cell nucleus, was then photobleached using 100 iterations at 3.75 mW laser power. 12-bit images were collected before, immediately after, and at defined intervals after bleaching. Our total experiment time was set to 500 s, which was sufficient for complete recovery from photobleaching. For quantitative imaging, a 3-μm wide strip of the cell was photobleached and then scanned during recovery. Photobleaching was completed in ∼2 s. Similar proportions of GFP (∼25%) and ASF–GFP (∼30%) total nuclear fluorescence were lost during photobleaching. Because the GFP protein recovered very rapidly, it was necessary to only scan the photobleached region in order to adequately sample GFP recovery. For simplicity in the graphical presentation of the data, the initial post-bleach value of the photobleached region was normalized to zero by subtraction and the maximal value obtained during recovery was normalized to 100. The t 1/2 of recovery can then be directly read off of the graph as the 50% value. Identical results were obtained when 2-μm spots, rather than strips, were bleached. To determine the immobile population of ASF–GFP, the maximal recovered value was divided by the starting value of the photobleached region after correction for total nuclear fluorescence lost during photobleaching. This correction factor was determined by measuring the total nuclear fluorescence immediately after photobleaching and dividing this value by the total nuclear fluorescence immediately before bleaching. The laser intensity during recovery was set so that no measurable loss of fluorescence was observed during the monitoring period. To track the mobility of HDAC4–GFP domains and small foci enriched in ASF–GFP we used the track points function in Universal Imaging's MetaMorph 4.0 imaging software. The image sequences were viewed on screen at 200% magnification and the center of each focus was identified with a mouse. For HDAC4 domains, the structures sometimes moved out of the plane of focus. In this instance, the foci could still be followed by identifying slightly elevated regions of signal intensity. Although difficult to identify in single frames, these could be easily identified by rapidly moving between the several frames where the domains move into and out of focus. This occurred for two of the five foci tracked. These foci, however, remained in focus for most of the time course.
Photobleaching and Cell Viability
Photobleaching experiments have an undeserved reputation of being photodestructive to living cells. Excessive photodamage, if it occurred, would complicate collection and interpretation of FRAP-based experimental data. However, bleaching GFP using the monochromatic laser at low intensities needed for bleaching and image acquisition, does not noticeably perturb live cells (reviewed White and Stelzer 1999 ). After repeated bleaching, cells expressing GFP-tagged trafficking proteins ( Nakata et al. 1998 ) and centrosome proteins ( Khodjakov and Rieder 1999 ) have remained viable for periods of hours, even to continue through mitosis, an event noted for its sensitivity to cell toxicity. As for cells remaining viable for periods long enough to complete photobleaching experiments, the conditions we have used are sufficient for cells to grow for >24 h and to undergo mitosis (our unpublished observations). To assess that cells remain viable during the initial photobleaching and recovery period, we monitored cells by differential interference contrast (DIC) optics for changes in cellular morphology as well as the maintenance of cytoplasmic organelle transport and the absence of detectable changes in mitochondrial structure (e.g., swelling). Therefore, we are confident that our experimental conditions and/or design does not erroneously influence the collection of FRAP or fluorescence loss in photobleaching (FLIP)–based data. Online Supplemental Material Video 1 further depicts Fig. 1 . A cell expressing ASF–GFP is shown in 3-D red/green stereo time-lapse. Individual frames were captured at 2-min intervals. Videos 2 and 3 further depict Fig. 2 . A cell expressing an HDAC4–GFP fusion protein (video 2) or ASF–GFP (video 3) was captured as a 2-D time-lapse experiment at 1-s intervals for 60 s. These videos are available at http://www.jcb.org/cgi/content/full/150/1/41/DC1.
Online Supplemental Material Video 1 further depicts Fig. 1 . A cell expressing ASF–GFP is shown in 3-D red/green stereo time-lapse. Individual frames were captured at 2-min intervals. Videos 2 and 3 further depict Fig. 2 . A cell expressing an HDAC4–GFP fusion protein (video 2) or ASF–GFP (video 3) was captured as a 2-D time-lapse experiment at 1-s intervals for 60 s. These videos are available at http://www.jcb.org/cgi/content/full/150/1/41/DC1.
Supplemental Material [Supplemental Material Index]
📊 Figures
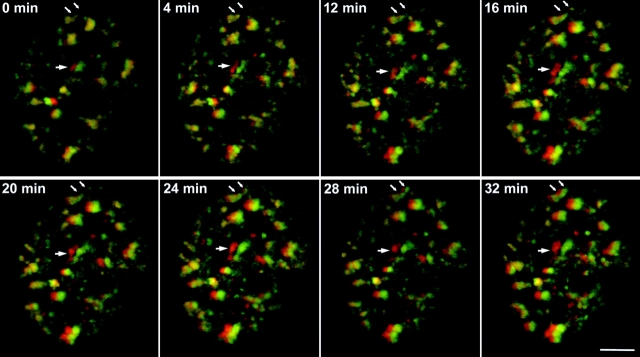
Figure 1
3-D organization of ASF within living cells. A mouse 10T1/2 fibroblast cell line was transfected with an ASFu2013GFP fusion protein. An expressing cell was examined by deconvolution microscopy and 3-D...
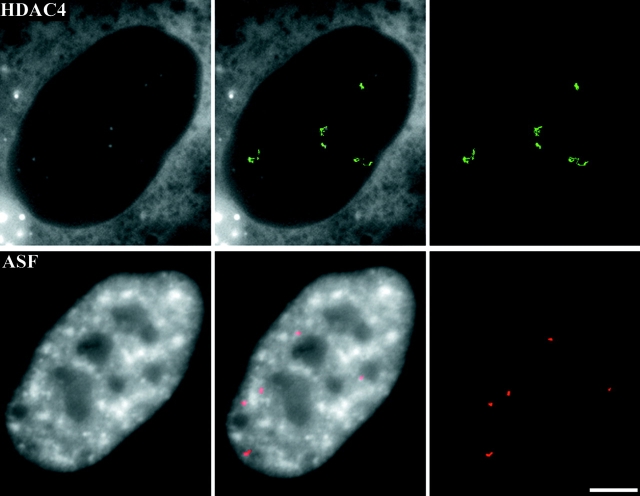
Figure 2
Mobility of an HDAC4u2013GFP-enriched structure. (Top) A mouse 10T1/2 cell was transfected with a hybrid protein containing an NH 2 -terminal fusion of GFP to HDAC4. A cell expressing nuclear HDAC4-en...
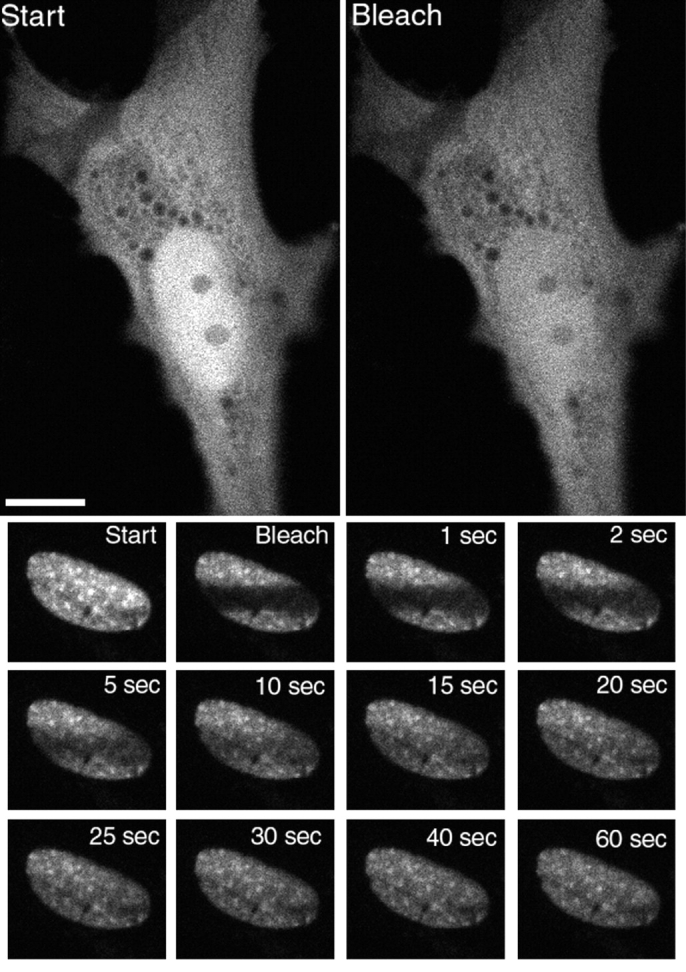
Figure 3
Fluorescence recovery after photobleaching of the ASFu2013GFP factor in living cells. Indian muntjac fibroblast cells were transfected with a GFP expression vector (top panels) or an ASFu2013GFP expre...
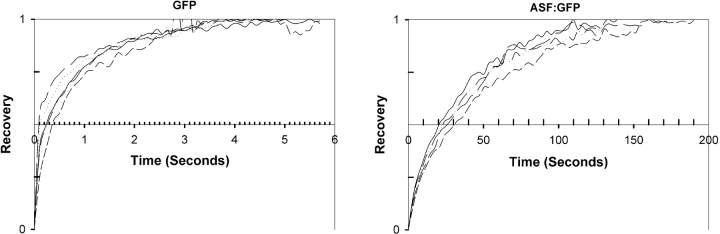
Figure 4
A comparison of recovery rates of GFP and ASFu2013GFP during FRAP. Human A549 cells were transfected with either a GFP expression vector or an ASFu2013GFP expression vector. A 3-u03bcm line was bleach...
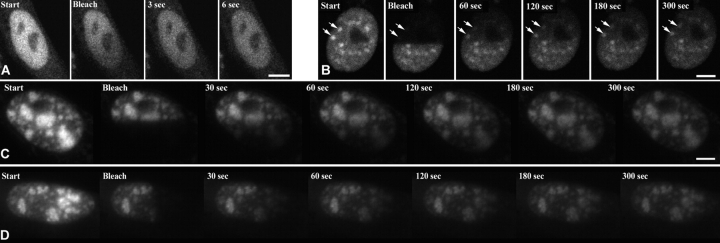
Figure 5
Effect of RNA polymerase II and kinase inhibitors on ASFu2013GFP movement. Mouse 10T1/2 fibroblasts expressing the GFP protein (A) or the ASFu2013GFP (B, C, and D) chimeric protein were incubated in t...
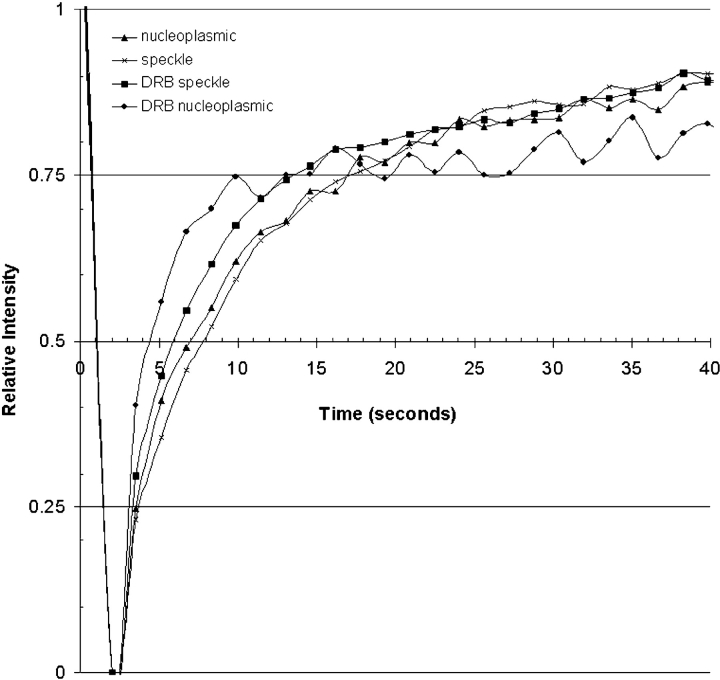
Figure 6
Quantitative analysis of FRAP after spot-bleaching of a nuclear speckle and a nucleoplasmic region of the same cell. Two spots of u223c1.5-u03bcm diameter were photobleached in HeLa cell nuclei, one i...
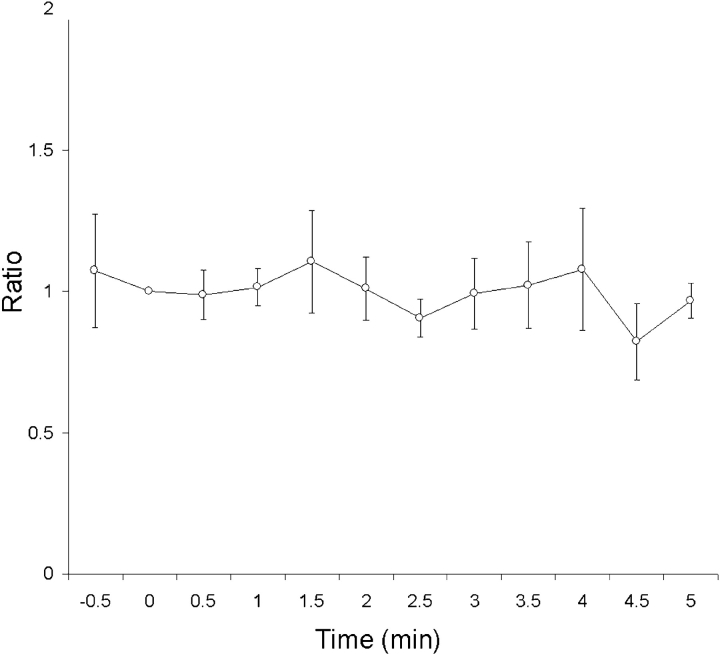
Figure 7
Quantitative analysis of the relative ASFu2013GFP distribution in nuclear speckles and the surrounding nucleoplasm during recovery after photobleaching. A line scan three pixels wide was drawn through...
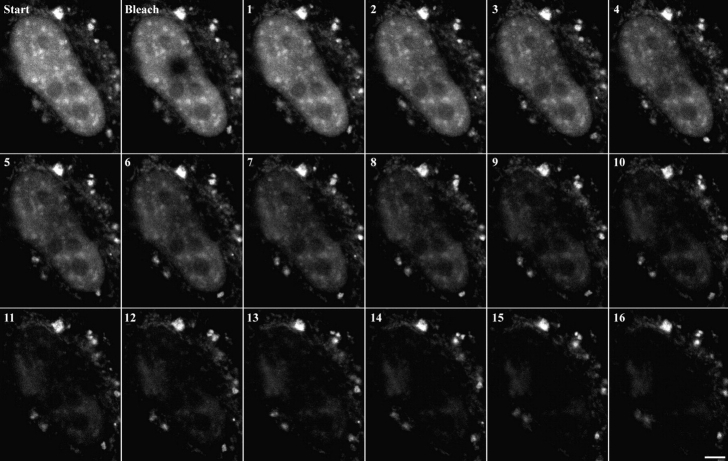
Figure 8
Fluorescence loss in photobleaching demonstrates connectivity between speckles and the nucleoplasm. A single spot 2 u03bcm in diameter was repeatedly photobleached and allowed to recover for 30 s. The...
Figure images are served from the NIH/NLM PubMed Central Open Access Subset or Europe PMC; copyright remains with the publishers and authors.
💬 Discussion
0 commentsNo comments yet. Be the first to start a discussion!
Leave a Comment