Abstract
Tunneling nanotubes (TNT) are thin, membranous, tunnel-like cell-to-cell connections, but the mechanisms underlying their biogenesis or functional role remains obscure. Here, we report, Rhes, a brain-enriched GTPase/SUMO E3-like protein, induces the biogenesis of TNT-like cellular protrusions, “Rhes tunnels,” through which Rhes moves from cell to cell and transports Huntington disease (HD) protein, the poly-Q expanded mutant Huntingtin (mHTT). The formation of TNT-like Rhes tunnels requires the Rhes’s serine 33, C-terminal CAAX, and a SUMO E3-like domain. Electron microscopy analysis revealed that TNT-like Rhes tunnels appear continuous, cell–cell connections, and <200 nm in diameter. Live-cell imaging shows that Rhes tunnels establish contact with the neighboring cell and deliver Rhes-positive cargoes, which travel across the plasma membrane of the neighboring cell before entering it. The Rhes tunnels carry Rab5a/Lyso 20-positive vesicles and transport mHTT, but not normal HTT, mTOR, or wtTau proteins. SUMOylation-defective mHTT, Rhes C263S (cannot SUMOylate mHTT), or CRISPR/Cas9-mediated depletion of three isoforms of SUMO diminishes Rhes-mediated mHTT transport. Thus, Rhes promotes the biogenesis of TNT-like cellular protrusions and facilitates the cell–cell transport of mHTT involving SUMO-mediated mechanisms.
🔬 Techniques
🔭 Microscopes
🧬 Organisms
💻 Software
✨ Fluorophores
🧪 Sample Preparation
🔬 Cell Lines
🏭 Microscope Brands
🧪 Reagent Suppliers
📷 Detectors
💻 Software Details
💾 Data Repositories
🏛️ Research Organizations (ROR)
Affiliated research institutions:
📋 Methods
Cell culture and chemicals
Mouse normal striatal neuronal cells (STHdh Q7/Q7 ) or HD mutants (STHdh Q111/Q111 ; Trettel et al., 2000 ) were cultured in growth medium containing Dulbecco’s modified Eagle’s medium (Thermo Fisher Scientific) with 10% FBS and 1% penicillin-streptomycin, as described in our previous works ( Subramaniam et al., 2009 ; Pryor et al., 2014 ; Shahani et al., 2016 ).
Primary neuron culture
Animals were cared for in accordance with the guidelines set forth by the National Institutes of Health regarding the proper treatment and use of laboratory animals and with the approval of Institutional Animal Care and Use Committee of The Scripps Research Institute. Striata of postnatal day 1 C57BL/6 mice were removed and digested at 37°C for 15 min in a final concentration of 0.25% papain and resuspended in neuronal plating media (Neurobasal-A media; Thermo Fisher Scientific), with 5% FBS, 0.5 mM glutamax, and 1% penicillin-streptomycin. Tissues were dissociated by trituration with a pipette. Further, cells were plated in 35-mm glass-bottom dishes (D11140H; Matsunami) coated with 100 µg/ml poly-D-lysine at the density of 2 × 10 5 cells per dish. Dishes were maintained in a 37°C, 5% CO 2 incubator. After the cells adhered (1–3 h after plating), plating media were replaced with growth media (Neurobasal-A media, 2% B27, 0.5 mM glutamax, and 1% penicillin-streptomycin). Antibodies, chemicals, and treatments of cells Huntingtin mouse monoclonal antibody (MAB 2166) was purchased from Millipore. GFP (sc-9996) and actin monoclonal antibody (sc-47778) were obtained from Santa Cruz Biotechnology. mTOR (# 2983), SUMO1 (# 4930), and SUMO2/3 (# 4974) antibodies were obtained from Cell Signaling Technologies. Alexa Fluor 568 anti-mouse antibody was purchased from Thermo Fisher Scientific. Cytochalasin D was purchased from Tocris Biosciences (# 1233). For the actin polymerization inhibition experiment, cytochalasin D (2 µg/ml) was added for 8 h to the cells after 40 h of the transfection of indicated DNA. Mitotracker (M7511) was purchased from Thermo Fisher Scientific. For mitochondrial staining, mitotracker was dissolved in DMSO and used at 200 nM concentration. Mitotracker was added for 30 min after 48 h of Rhes transfection; cells were washed with D-PBS and fixed with 1% PFA. Vybrant DiD cell-labeling solution was purchased from Thermo Fisher Scientific (V22887) and used as per the manufacturer’s recommendations. Plasmids and transfection For GFP-Rhes and GFP-Rhes domains, we amplified their respective cDNA from pCMV-Myc-Rhes ( Subramaniam et al., 2009 ) and cloned it in EGFP-C1 vector. These cDNA were amplified using specific primers and then subcloned at BspEI and Sal1 restriction sites. GFP-Rhes mutants were generated by site-directed mutagenesis. mCherry N171 18Q, mCherry N171 89Q, mCherry poly 72Q, and mHTT N171 K/R mutant cDNA were amplified using the PCR-based method. Further, these cDNA were subcloned in the mCherry-C1 vector at BspEI and BamHI restriction sites. GFP-Atxn3 84Q was obtained from Addgene (22123). It was subcloned in mCherry-C1 vector using SalI and MluI restriction enzymes and confirmed by DNA sequencing. The following plasmids were obtained from Addgene ( Table 2 ). Striatal neuronal cells seeded in 35-mm glass-bottom dishes or other plates were transfected 24 h later with cDNA constructs using PolyFect (Qiagen) as per the manufacturer’s instructions. Primary neurons were transfected with Lipofectamine 2000 (Invitrogen) in the ratio of 1:2 (DNA:Lipofectamine). For a 10-cm dish, we transfected ∼8 µg of DNA, and for 35-mm dishes, ranging from 1 to 2 µg total DNA. Table 2. Plasmids used in this study obtained from Addgene Plasmids Provided by Addgene ID GFP-RhoA Channing Der (The University of North Carolina, Chapel Hill, NC) 23224 mCherry-alpha-tubulin Gia Voeltz (University of Colorado Boulder, Boulder, CO) 49149 mCherry-actin 7 Michael Davidson (The Florida state University, Tallahassee, FL) 54966 pEGFP-C3-Exo70 Channing Der (The University of North Carolina, Chapel Hill, NC) 53761 Rab5a-pmCherryC1 Choursistein Merrifield (Institut de biologie integrative de la cellule, Gif-sur-Yvette, France) 27679 BiP-mCherry Erik Snapp (Janelia Research Campus, Ashburn, VA) 62233 mCherry-peroxisome-2 Michael Davidson (The Florida state University, Tallahassee, FL) 54520 mCherry-Golgi-7 Michael Davidson (The Florida state University, Tallahassee, FL) 55052 mCherry-Lysosomes-20 Michael Davidson (The Florida state University, Tallahassee, FL) 55073 mApple-Fibrillarin-7 Michael Davidson (The Florida state University, Tallahassee, FL) 54900 pEGFP-C1-Ataxin3Q84 Henry Paulson (University of Michigan health system, Ann Arbor, MI) 22123 mCherry-MAPTau-C-10 Michael Davidson (The Florida state University, Tallahassee, FL) 55077 mCherry-Farnesyl 5 Michael Davidson (The Florida state University, Tallahassee, FL) 55045 peYFP-C1-mTOR Jie Chen and Taekjip Ha (University of Illinois, Chicago, IL) 73384 pmCherry-vinculin Chinten James Lim (University of British coloumbia, Vancouver, Canada) 80024 Flow cytometry We used different FACS strategies to address Rhes-induced TNT like processes and mHTT transportation. Each of them is discussed here briefly. In Fig. 3, A–D , striatal neuronal cells were transfected with GFP, GFP-RhoA, GFP-Rhes, or mCherry cDNA constructs in a 10-cm dish. After 48 h, cells were trypsinized and resuspended in FACS buffer (25 mM Hepes, 10 U/ml DNase, 5 mM EDTA, and 2% FBS in Ca 2+ /Mg 2+ -free D-PBS). Cells were filtered through a 40-µm nylon filter and sorted in a BD Biosciences FACSAria sorter. After sorting, cells were co-cultured in 12-well plates in equal ratios (1:1) for 24 h. Further cells were trypsinized and washed three times with D-PBS and analyzed by flow cytometry (BD Biosciences; LSR Fortessa cell analyzer). Each experiment was performed three times, and 10,000–20,000 cells were counted for each sample. Data were compensated with single color controls and plotted using FlowJo software. In Fig. 3, F and G , FACS-sorted GFP-Rhes or mCherry alone–expressing cells were plated together or on 0.4-µm filters (Nunc) placed on top of FACS-sorted mCherry-expressing cells that prevent cell–cell contact. After co-culture for 24 h, the filters were removed, and cells were analyzed by flow cytometry as described above. The indicated FACS-sorted cells in Fig. 3 H were co-cultured for 12 h and then treated with vehicle or cytochalasin D (2 µg/ml) for another 12 h. In Fig. 4, H and I , striatal neuronal cells were transfected with GFP-Rhes or indicated mutants/domains or mCherry construct in 10-cm dishes (one dish for GFP-tagged protein and four dishes for mCherry). After 48 h, cells were FACS-sorted and co-cultured. After 24 h, cells were analyzed by flow cytometry as described above. In Fig. 5, B–G , Striatal neuronal cells were transfected with BFP-C1 plasmid (8 µg) in six 10-cm dishes at day 0. At day 1, a different set of striatal neuronal cells was transfected with a GFP-Rhes WT or GFP-Rhes 171–266 or GFP-Rhes C263S plasmid (8 µg) in two 10-cm dishes for each. At day 2, the cells transfected with BFP-C1 (48-h transfection) were sorted to get a BFP + pure population (acceptor cells) based on blue fluorescence. BFP + cells were seeded in 12-well plates for 24 h. At day 3, Rhes WT or GFP-Rhes 171–266 or GFP-Rhes C263S–expressing cells (48-h transfection) were incubated with DiD dye according to the manufacturer’s recommendations for 1 h and sorted as a double-positive population (donor cells) using GFP and an Alexa Fluor 633 laser and co-cultured with already seeded BFP + cells for 24 h. After that, cells were analyzed by FACS or confocal imaging as described above. Data were presented as a BFP + population that was gated and analyzed for migration of GFP/mCherry-tagged proteins. In Fig. 7, A–E , striatal neuronal cells were transfected with BFP-C1 plasmid (8 µg) in six 10-cm dishes at day 0. At day 1, a different set of striatal neuronal cells was cotransfected with a combination of GFP + mCherry wtHTT/mHTT or GFP-Rhes + mCherry wtHTT/mHTT (4 µg each) in two 10-cm dishes for each. At day 2, the cells transfected with BFP-C1 (48 h transfection) were sorted to get a BFP + pure population (acceptor cells) based on blue fluorescence. BFP + cells were seeded in 12-well plates for 24 h. At day 3, cotransfected cells (GFP + mCherry wtHTT/mHTT or GFP-Rhes + mCherry wtHTT/mHTT) were sorted (48 h transfection) as a double-positive population (donor cells) and co-cultured with already seeded BFP + cells for 24 h. After that, cells were analyzed by FACS as described above. Data were presented as a BFP + population that was gated and analyzed for migration of GFP/mCherry-tagged proteins. A similar strategy was used for other co-culture experiments. Similarly, in the experiment shown in Fig. 8, A–C , FACS-sorted GFP-Rhes and mCherry-mHtt double-positive cells were plated on 0.4-µm filters (Nunc) placed on top of FACS-sorted BFP-expressing cells that prevent cell–cell contact. After co-culture for 24 h, the filters were removed and the BFP-expressing cells were analyzed by flow cytometry as described above.
Show full methods section
Cell culture and chemicals
Mouse normal striatal neuronal cells (STHdh Q7/Q7 ) or HD mutants (STHdh Q111/Q111 ; Trettel et al., 2000 ) were cultured in growth medium containing Dulbecco’s modified Eagle’s medium (Thermo Fisher Scientific) with 10% FBS and 1% penicillin-streptomycin, as described in our previous works ( Subramaniam et al., 2009 ; Pryor et al., 2014 ; Shahani et al., 2016 ).
Primary neuron culture
Animals were cared for in accordance with the guidelines set forth by the National Institutes of Health regarding the proper treatment and use of laboratory animals and with the approval of Institutional Animal Care and Use Committee of The Scripps Research Institute. Striata of postnatal day 1 C57BL/6 mice were removed and digested at 37°C for 15 min in a final concentration of 0.25% papain and resuspended in neuronal plating media (Neurobasal-A media; Thermo Fisher Scientific), with 5% FBS, 0.5 mM glutamax, and 1% penicillin-streptomycin. Tissues were dissociated by trituration with a pipette. Further, cells were plated in 35-mm glass-bottom dishes (D11140H; Matsunami) coated with 100 µg/ml poly-D-lysine at the density of 2 × 10 5 cells per dish. Dishes were maintained in a 37°C, 5% CO 2 incubator. After the cells adhered (1–3 h after plating), plating media were replaced with growth media (Neurobasal-A media, 2% B27, 0.5 mM glutamax, and 1% penicillin-streptomycin). Antibodies, chemicals, and treatments of cells Huntingtin mouse monoclonal antibody (MAB 2166) was purchased from Millipore. GFP (sc-9996) and actin monoclonal antibody (sc-47778) were obtained from Santa Cruz Biotechnology. mTOR (# 2983), SUMO1 (# 4930), and SUMO2/3 (# 4974) antibodies were obtained from Cell Signaling Technologies. Alexa Fluor 568 anti-mouse antibody was purchased from Thermo Fisher Scientific. Cytochalasin D was purchased from Tocris Biosciences (# 1233). For the actin polymerization inhibition experiment, cytochalasin D (2 µg/ml) was added for 8 h to the cells after 40 h of the transfection of indicated DNA. Mitotracker (M7511) was purchased from Thermo Fisher Scientific. For mitochondrial staining, mitotracker was dissolved in DMSO and used at 200 nM concentration. Mitotracker was added for 30 min after 48 h of Rhes transfection; cells were washed with D-PBS and fixed with 1% PFA. Vybrant DiD cell-labeling solution was purchased from Thermo Fisher Scientific (V22887) and used as per the manufacturer’s recommendations. Plasmids and transfection For GFP-Rhes and GFP-Rhes domains, we amplified their respective cDNA from pCMV-Myc-Rhes ( Subramaniam et al., 2009 ) and cloned it in EGFP-C1 vector. These cDNA were amplified using specific primers and then subcloned at BspEI and Sal1 restriction sites. GFP-Rhes mutants were generated by site-directed mutagenesis. mCherry N171 18Q, mCherry N171 89Q, mCherry poly 72Q, and mHTT N171 K/R mutant cDNA were amplified using the PCR-based method. Further, these cDNA were subcloned in the mCherry-C1 vector at BspEI and BamHI restriction sites. GFP-Atxn3 84Q was obtained from Addgene (22123). It was subcloned in mCherry-C1 vector using SalI and MluI restriction enzymes and confirmed by DNA sequencing. The following plasmids were obtained from Addgene ( Table 2 ). Striatal neuronal cells seeded in 35-mm glass-bottom dishes or other plates were transfected 24 h later with cDNA constructs using PolyFect (Qiagen) as per the manufacturer’s instructions. Primary neurons were transfected with Lipofectamine 2000 (Invitrogen) in the ratio of 1:2 (DNA:Lipofectamine). For a 10-cm dish, we transfected ∼8 µg of DNA, and for 35-mm dishes, ranging from 1 to 2 µg total DNA. Table 2. Plasmids used in this study obtained from Addgene Plasmids Provided by Addgene ID GFP-RhoA Channing Der (The University of North Carolina, Chapel Hill, NC) 23224 mCherry-alpha-tubulin Gia Voeltz (University of Colorado Boulder, Boulder, CO) 49149 mCherry-actin 7 Michael Davidson (The Florida state University, Tallahassee, FL) 54966 pEGFP-C3-Exo70 Channing Der (The University of North Carolina, Chapel Hill, NC) 53761 Rab5a-pmCherryC1 Choursistein Merrifield (Institut de biologie integrative de la cellule, Gif-sur-Yvette, France) 27679 BiP-mCherry Erik Snapp (Janelia Research Campus, Ashburn, VA) 62233 mCherry-peroxisome-2 Michael Davidson (The Florida state University, Tallahassee, FL) 54520 mCherry-Golgi-7 Michael Davidson (The Florida state University, Tallahassee, FL) 55052 mCherry-Lysosomes-20 Michael Davidson (The Florida state University, Tallahassee, FL) 55073 mApple-Fibrillarin-7 Michael Davidson (The Florida state University, Tallahassee, FL) 54900 pEGFP-C1-Ataxin3Q84 Henry Paulson (University of Michigan health system, Ann Arbor, MI) 22123 mCherry-MAPTau-C-10 Michael Davidson (The Florida state University, Tallahassee, FL) 55077 mCherry-Farnesyl 5 Michael Davidson (The Florida state University, Tallahassee, FL) 55045 peYFP-C1-mTOR Jie Chen and Taekjip Ha (University of Illinois, Chicago, IL) 73384 pmCherry-vinculin Chinten James Lim (University of British coloumbia, Vancouver, Canada) 80024 Flow cytometry We used different FACS strategies to address Rhes-induced TNT like processes and mHTT transportation. Each of them is discussed here briefly. In Fig. 3, A–D , striatal neuronal cells were transfected with GFP, GFP-RhoA, GFP-Rhes, or mCherry cDNA constructs in a 10-cm dish. After 48 h, cells were trypsinized and resuspended in FACS buffer (25 mM Hepes, 10 U/ml DNase, 5 mM EDTA, and 2% FBS in Ca 2+ /Mg 2+ -free D-PBS). Cells were filtered through a 40-µm nylon filter and sorted in a BD Biosciences FACSAria sorter. After sorting, cells were co-cultured in 12-well plates in equal ratios (1:1) for 24 h. Further cells were trypsinized and washed three times with D-PBS and analyzed by flow cytometry (BD Biosciences; LSR Fortessa cell analyzer). Each experiment was performed three times, and 10,000–20,000 cells were counted for each sample. Data were compensated with single color controls and plotted using FlowJo software. In Fig. 3, F and G , FACS-sorted GFP-Rhes or mCherry alone–expressing cells were plated together or on 0.4-µm filters (Nunc) placed on top of FACS-sorted mCherry-expressing cells that prevent cell–cell contact. After co-culture for 24 h, the filters were removed, and cells were analyzed by flow cytometry as described above. The indicated FACS-sorted cells in Fig. 3 H were co-cultured for 12 h and then treated with vehicle or cytochalasin D (2 µg/ml) for another 12 h. In Fig. 4, H and I , striatal neuronal cells were transfected with GFP-Rhes or indicated mutants/domains or mCherry construct in 10-cm dishes (one dish for GFP-tagged protein and four dishes for mCherry). After 48 h, cells were FACS-sorted and co-cultured. After 24 h, cells were analyzed by flow cytometry as described above. In Fig. 5, B–G , Striatal neuronal cells were transfected with BFP-C1 plasmid (8 µg) in six 10-cm dishes at day 0. At day 1, a different set of striatal neuronal cells was transfected with a GFP-Rhes WT or GFP-Rhes 171–266 or GFP-Rhes C263S plasmid (8 µg) in two 10-cm dishes for each. At day 2, the cells transfected with BFP-C1 (48-h transfection) were sorted to get a BFP + pure population (acceptor cells) based on blue fluorescence. BFP + cells were seeded in 12-well plates for 24 h. At day 3, Rhes WT or GFP-Rhes 171–266 or GFP-Rhes C263S–expressing cells (48-h transfection) were incubated with DiD dye according to the manufacturer’s recommendations for 1 h and sorted as a double-positive population (donor cells) using GFP and an Alexa Fluor 633 laser and co-cultured with already seeded BFP + cells for 24 h. After that, cells were analyzed by FACS or confocal imaging as described above. Data were presented as a BFP + population that was gated and analyzed for migration of GFP/mCherry-tagged proteins. In Fig. 7, A–E , striatal neuronal cells were transfected with BFP-C1 plasmid (8 µg) in six 10-cm dishes at day 0. At day 1, a different set of striatal neuronal cells was cotransfected with a combination of GFP + mCherry wtHTT/mHTT or GFP-Rhes + mCherry wtHTT/mHTT (4 µg each) in two 10-cm dishes for each. At day 2, the cells transfected with BFP-C1 (48 h transfection) were sorted to get a BFP + pure population (acceptor cells) based on blue fluorescence. BFP + cells were seeded in 12-well plates for 24 h. At day 3, cotransfected cells (GFP + mCherry wtHTT/mHTT or GFP-Rhes + mCherry wtHTT/mHTT) were sorted (48 h transfection) as a double-positive population (donor cells) and co-cultured with already seeded BFP + cells for 24 h. After that, cells were analyzed by FACS as described above. Data were presented as a BFP + population that was gated and analyzed for migration of GFP/mCherry-tagged proteins. A similar strategy was used for other co-culture experiments. Similarly, in the experiment shown in Fig. 8, A–C , FACS-sorted GFP-Rhes and mCherry-mHtt double-positive cells were plated on 0.4-µm filters (Nunc) placed on top of FACS-sorted BFP-expressing cells that prevent cell–cell contact. After co-culture for 24 h, the filters were removed and the BFP-expressing cells were analyzed by flow cytometry as described above.
Immunofluorescence
At the indicated times after transfection, cells were washed in D-PBS and fixed for 5 min in 1% PFA (Electron Microscopy Sciences). Note, 4% PFA or prolonged incubation with PFA disrupts highly fragile TNT-like processes. The cells were permeabilized with 0.1% Triton X-100 and labeled with mouse anti-Huntingtin antibody (1:100 for 18 h at 4°C) or rabbit anti-mTOR antibody (1:400 for 18 h at 4°C). The Alexa Fluor 568 secondary antibodies were used at 1:500 for 1 h at room temperature.
Image processing and TNT-like protrusion quantification
All the fluorescent confocal images were taken in Zeiss 880 microscope using 20× or 63× oil immersion Plan-apochromat objective (1.4 NA). Excitation was via a 405-, 561-, or 633-nm diode-pumped solid-state laser, and the 488-nm line of an argon ion laser. Time-lapse acquisitions were performed using a 63× oil-immersion lens (1.4 NA). Images of striatal neuronal cells used for 3D reconstruction and TNT-like protrusion detection were acquired with an optimal Z-step of 0.27 µm covering the whole cellular volume. Processing was performed with Zen software black/blue edition 2012. 3D analyses and remodeling were done by Zen 2012 black edition software. For protrusion quantification, we counted all cells with filopodia-like structures that were >10 µm in length and
📊 Figures
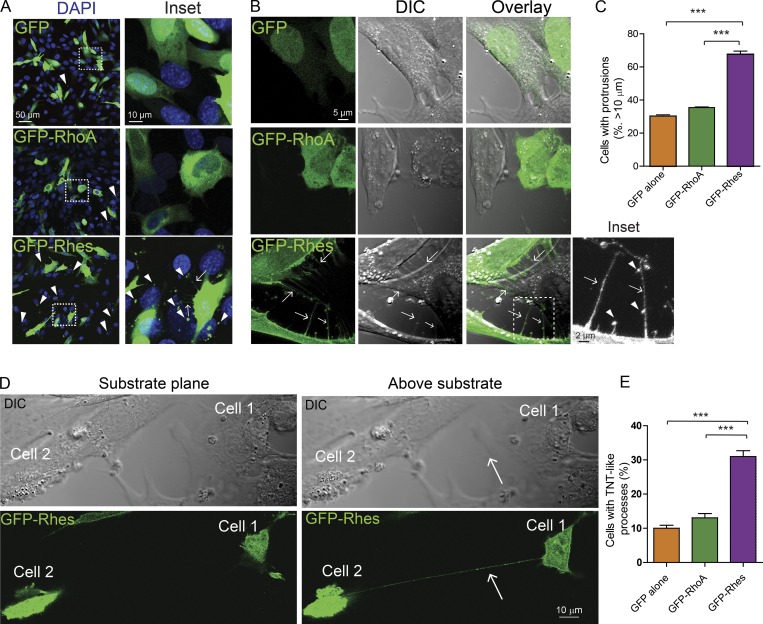
Figure 1.
Rhes promotes filopodia-like cellular protrusions in striatal neuronal cells. (A) Striatal neuronal cells (STHdh Q7/Q7 ) expressing GFP alone or GFP-RhoA or GFP-Rhes. Inset: Arrowheads show GFP puncta...
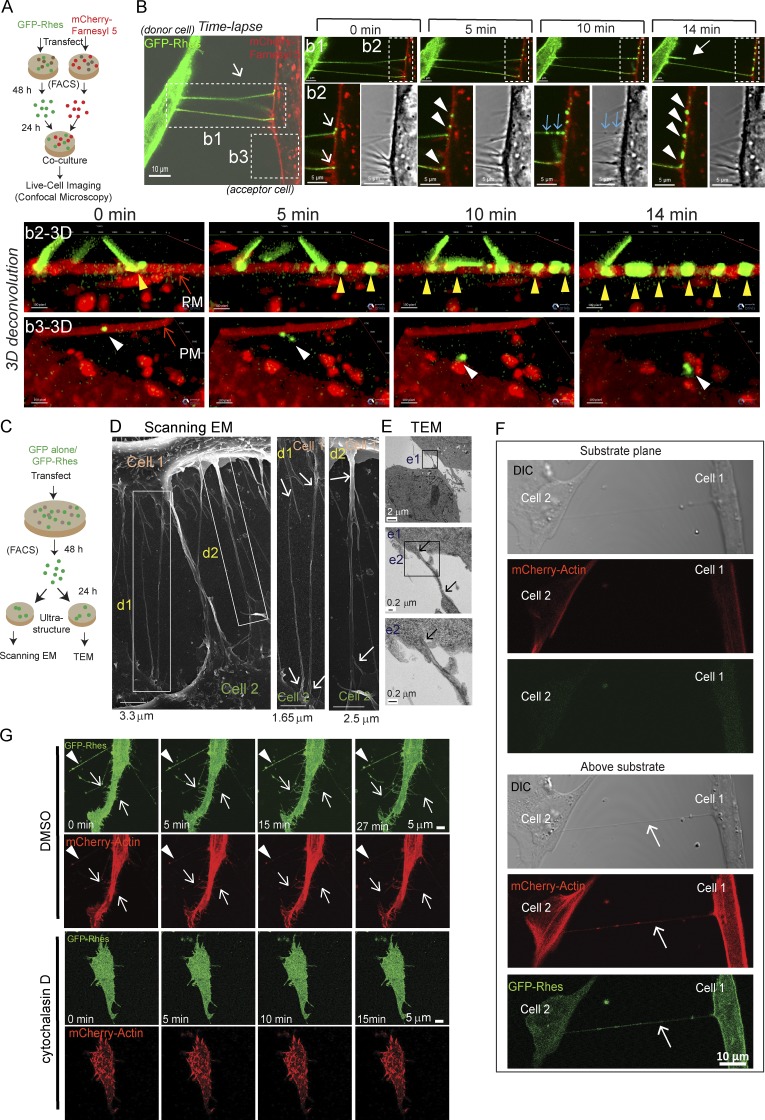
Figure 2.
Rhes-induced filopodia-like protrusions are membranous structures, show u201ckiss and runu201d properties, and are abrogated by actin polymerization inhibitor. (A) Experimental design for B. (B) Live-...
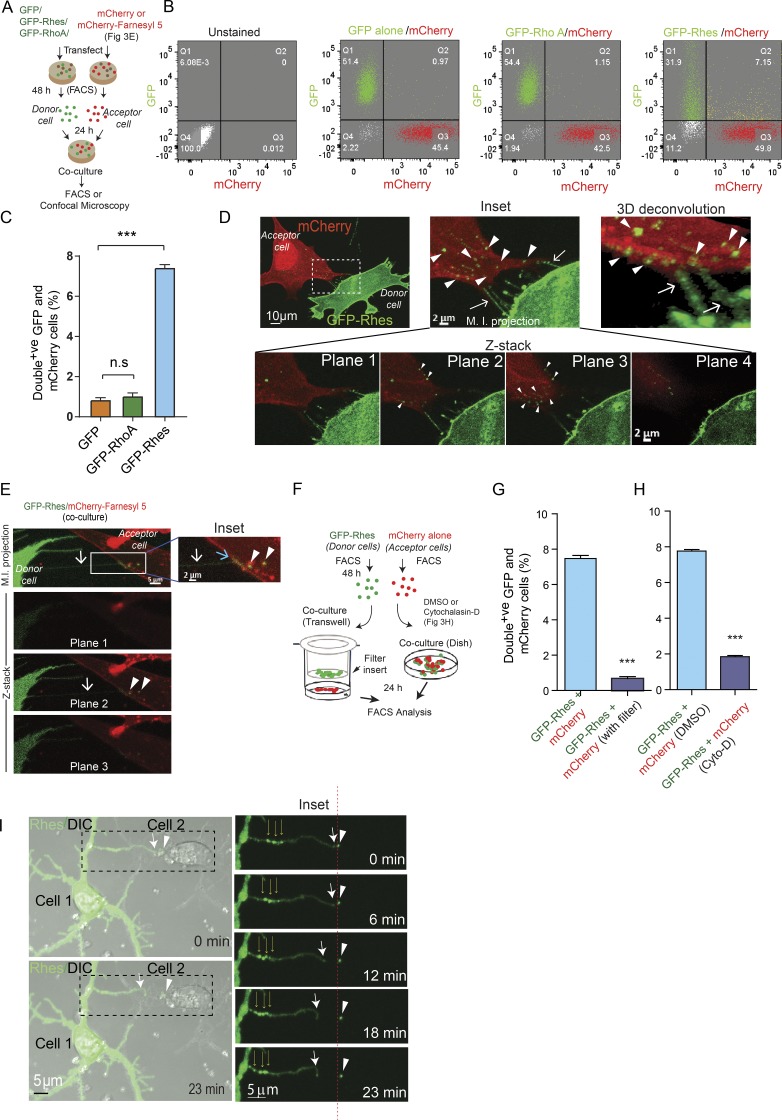
Figure 3.
Rhes is transported to neighboring cells via TNT-like Rhes tunnels. (A) Experimental design for B and C. (B) Representative FACS analysis of co-cultured (20,000 cells) striatal neuronal cells. (C) Bar...
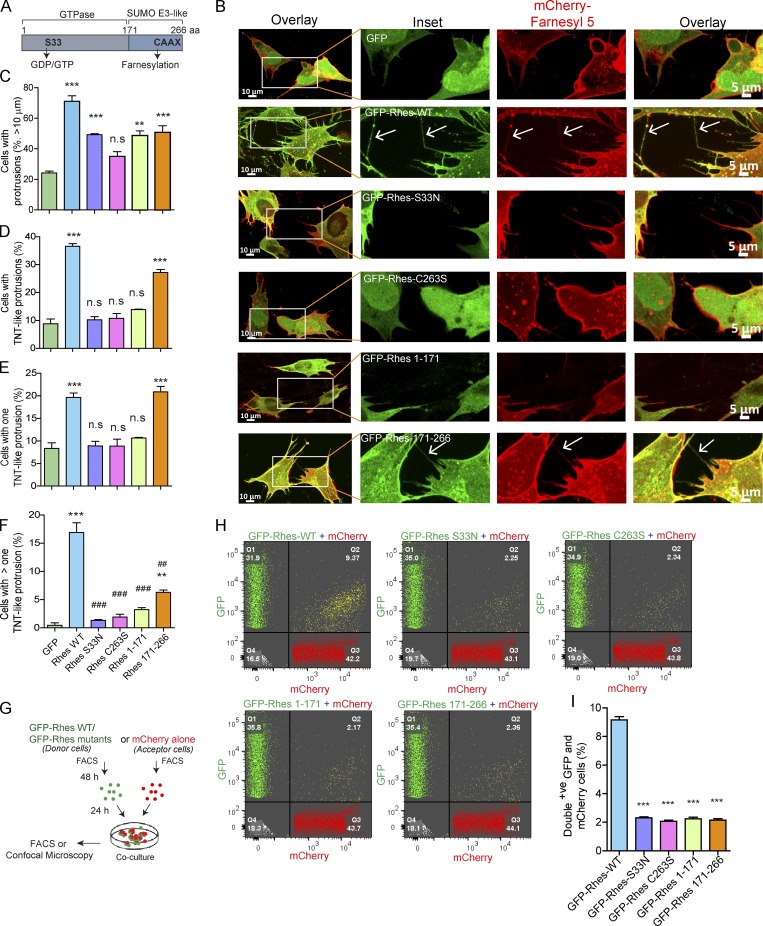
Figure 4.
Rhesu2019s SUMO E3-like domain promotes TNT-like Rhes tunnels, but only a Rhes WT travels efficiently from cell to cell. (A) Diagram of Rhes domains. (B) Representative confocal image of striatal neur...
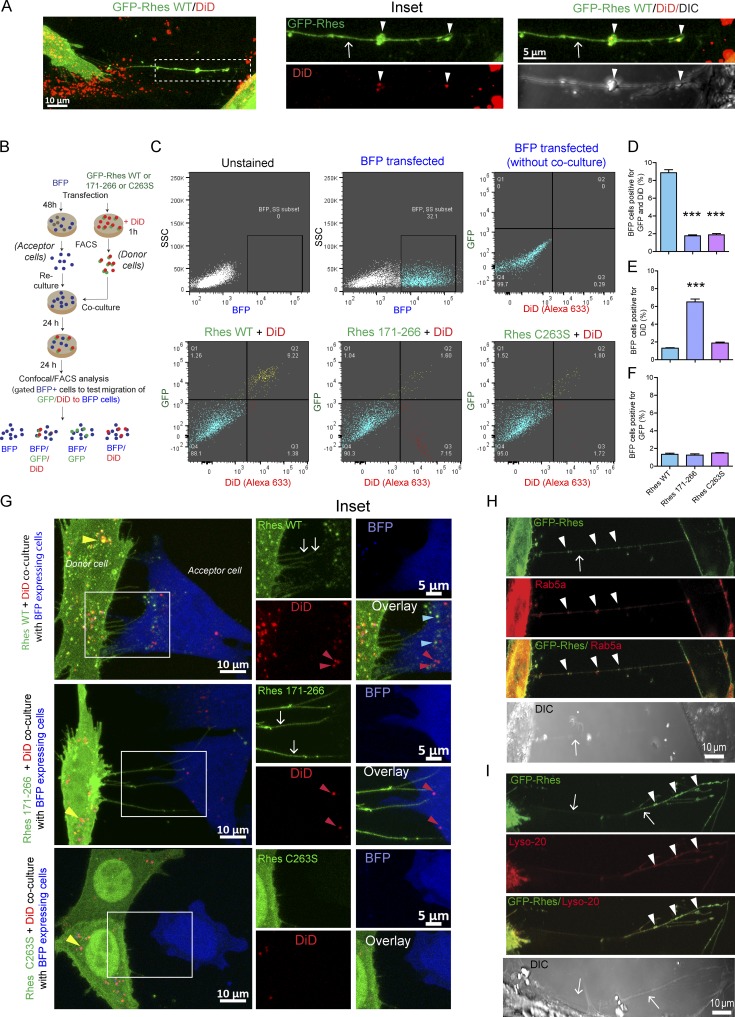
Figure 5.
Rhes-induced TNT-like Rhes tunnels contain DiD-, Rab5a-, or Lyso-20u2013positive vesicles. (A) Representative confocal image of striatal neuronal cells expresing GFP-Rhes and treated with DiD-Red (DiD...
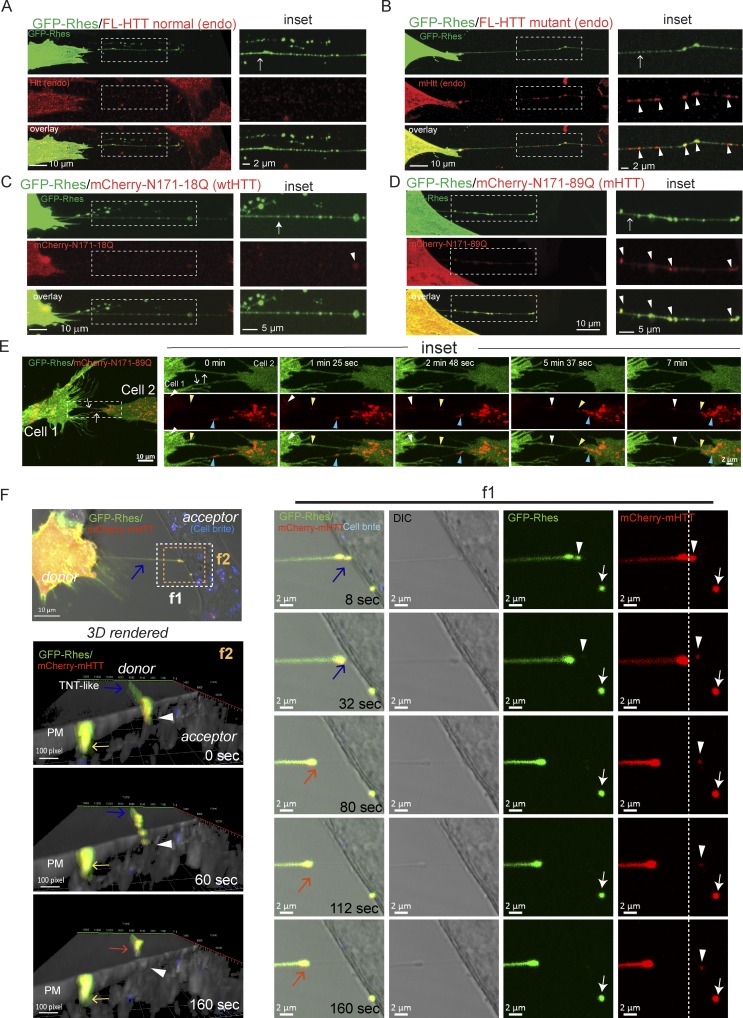
Figure 6.
Rhes promotes cellu2013cell transportation of mHTT via Rhes tunnels. (Au2013D) Representative confocal images of GFP-Rhes in striatal cells (STHdh Q7/Q7 ) or mutant striatal cells (STHdh Q111/Q111 ) w...
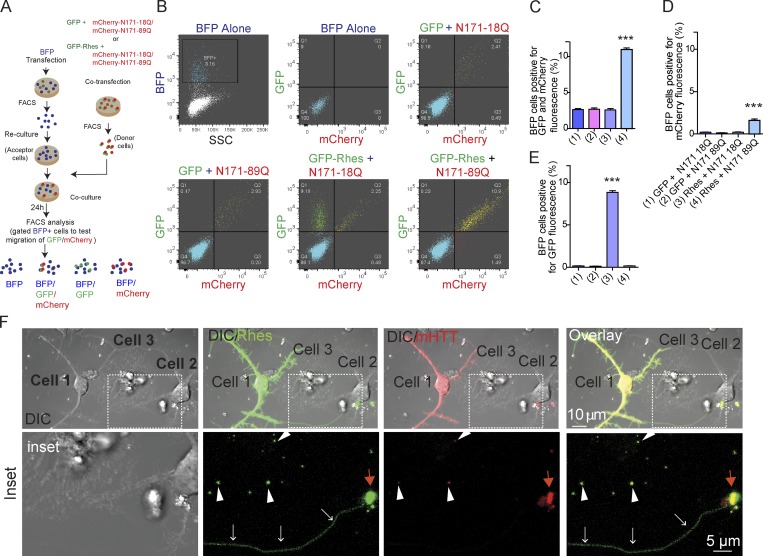
Figure 7.
Rhes efficiently transports mHTT between striatal neuronal cells, and in primary striatal neurons via TNT-like Rhes tunnels. (A) Experimental design for B and C. (B) FACS plot and co-culture of striat...
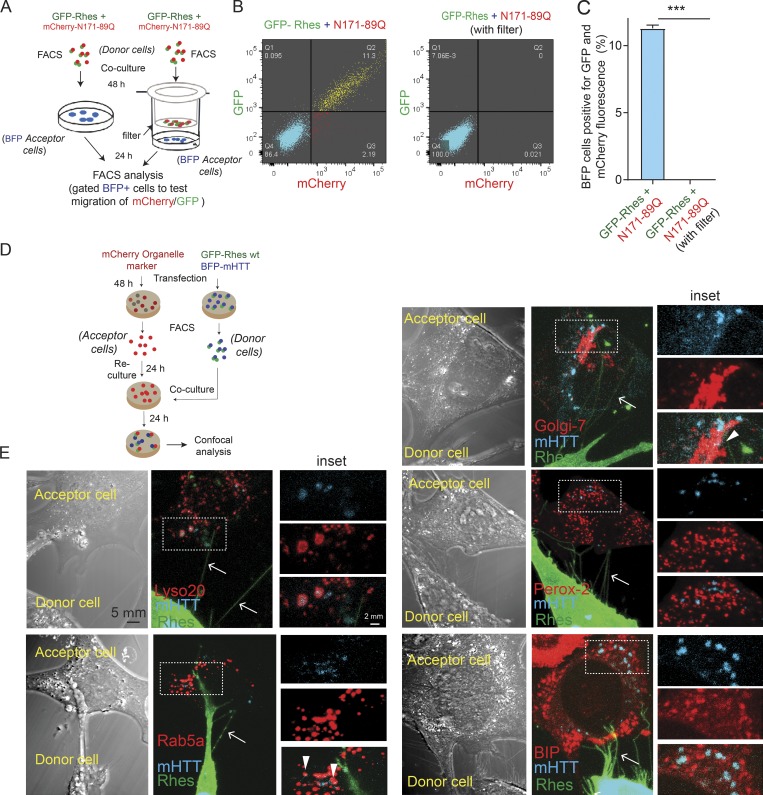
Figure 8.
Rhes requires physical cellu2013cell contact to transport mHTT, which in acceptor cells associates with lysosome and other vesicles. (A) Experimental design for B and C. (B) FACS plot for the indicate...
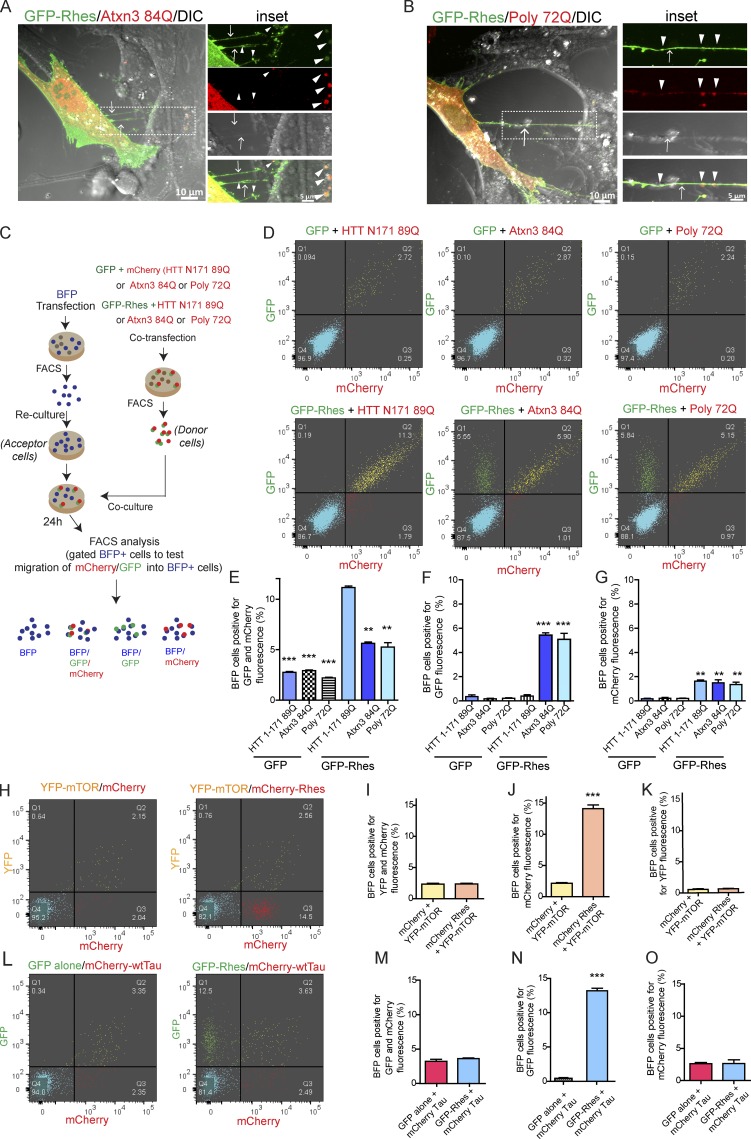
Figure 9.
Rhes transports Ataxin3 and poly 72Q protein but not mTOR or wtTau. (A and B) Representative confocal and DIC images of striatal neuronal cells expressing GFP-Rhes and mCherry-Ataxin 3 (Atxn3 84Q; A) ...
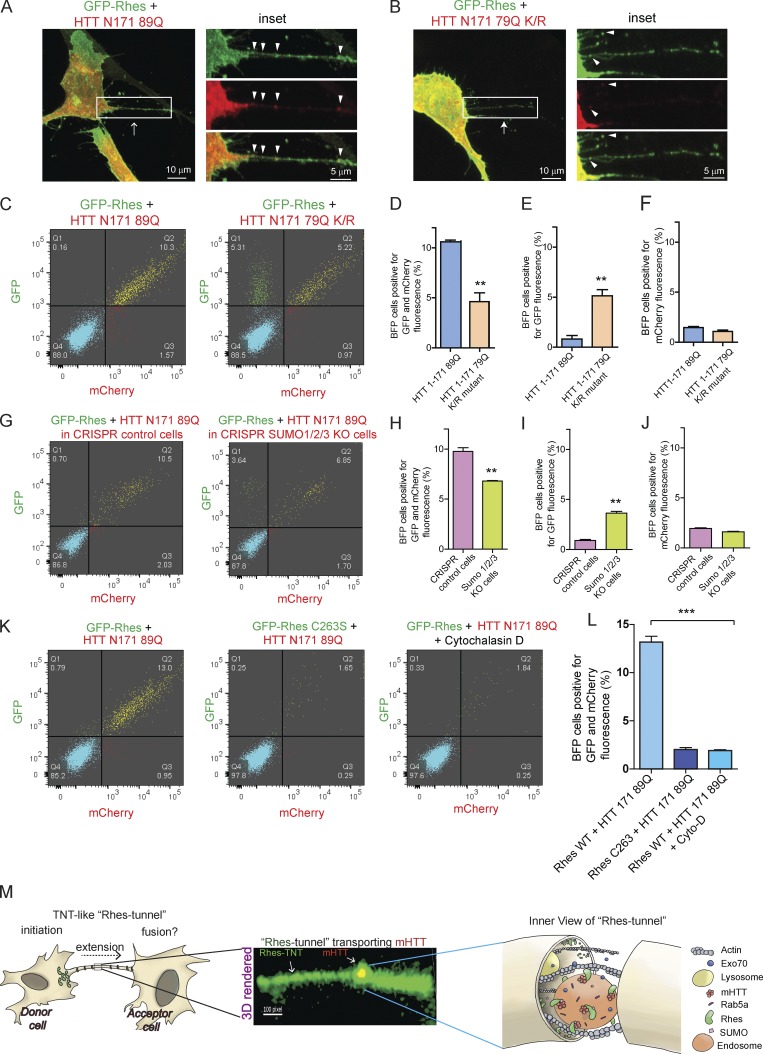
Figure 10.
SUMO participates in Rhes-mediated cellu2013cell transportation of mHTT. (A) Representative confocal images of striatal neuronal cells coexpressing GFP-Rhes and mCherry-HTT N171 89Q, or (B) GFP-Rhes a...
Figure images are served from the NIH/NLM PubMed Central Open Access Subset or Europe PMC; copyright remains with the publishers and authors.
💬 Discussion
0 commentsNo comments yet. Be the first to start a discussion!
Leave a Comment