Abstract
Hoechst conjugates to fluorescent dyes are popular DNA stains for live-cell imaging, but the relationship between their structure and performance remains elusive. This study of carboxyrhodamine-Hoechst 33258 conjugates reveals that a minimal change in the attachment point of the dye has dramatic effects on the properties of the final probe. All tested 6'-carboxyl dye-containing probes exhibited dual-mode binding to DNA and formed a dimmer complex at high DNA concentrations. The 5'-carboxyl dye-containing probes exhibited single-mode binding to DNA which translated into increased brightness and lower cytotoxicity. Up to 10-fold brighter nuclear staining by the newly developed probes allowed acquisition of stimulated emission depletion (STED) nanoscopy images of outstanding quality in living and fixed cells. Therefore we were able to estimate a diameter of ∼155 nm of the heterochromatin exclusion zones in the nuclear pore region in living cells and intact chicken erythrocytes and to localize telomeres relative to heterochromatin in living U-2 OS cells. Employing the highly efficient probes for two-color STED allowed visualization of DNA and tubulin structures in intact nucleated erythrocytes - a system where imaging is greatly hampered by high haemoglobin absorbance.
🔬 Techniques
🔭 Microscopes
🧬 Organisms
✨ Fluorophores
🧪 Sample Preparation
🔬 Cell Lines
🏭 Microscope Brands
🧪 Reagent Suppliers
📷 Detectors
🔎 Objectives
💻 Software Details
💾 Data Repositories
🏛️ Research Organizations (ROR)
Affiliated research institutions:
📋 Methods
Estimation of absorbance and fluorescence increase upon
SDS or hpDNA addition Fluorescence increase of the probes upon SDS or hpDNA addition was measured by preparing 2 μM probe solution in PBS buffer (Lonza, Cat. No. BE17-516F) with or without 0.1% SDS (Acros Organics). The samples prepared in 3 ml glass bottles with caps were incubated at room temperature for 2 h before measurements. The fluorescence increase of Hoechst-based probes binding to hpDNA was estimated using the following procedure: the probe from 1 mM DMSO stock solution was diluted to the final concentration of 2 μM in PBS buffer containing 30 μM of hpDNA (5′-CGCGAATTCGCGTTTTCGCGAATTCGCG-3′). Absorption and fluorescence were measured on a multiwell plate reader Spark® 20M (Tecan) in glass bottom 96-well plates (MatTek, Cat. No. PBK96G-1.5-5-F) at room temperature (25 °C). Absorption of solutions was recorded from 320 nm to 850 nm with a wavelength step size of 1 nm. The background absorption of the glass bottom plate was measured in wells containing only buffer and subtracted from the spectra of the samples. The fluorescence emission of the free dyes or final probes was recorded from 520 nm to 850 nm (for TMR, 495 nm exc., bandwidth 15 nm), 560 nm to 850 nm (for 580CP, 530 nm exc., bandwidth 15 nm), 600 nm to 850 nm (for 610CP, 570 nm exc., bandwidth 15 nm), and 620 nm to 850 nm (for SiR/GeR, 595 nm exc., bandwidth 15 nm) with a 5 nm emission bandwidth and 2 nm step size. All samples were prepared in technical triplicates, which was repeated three times as three independent experiments performed on different days.
Show full methods section
Estimation of absorbance and fluorescence increase upon
SDS or hpDNA addition Fluorescence increase of the probes upon SDS or hpDNA addition was measured by preparing 2 μM probe solution in PBS buffer (Lonza, Cat. No. BE17-516F) with or without 0.1% SDS (Acros Organics). The samples prepared in 3 ml glass bottles with caps were incubated at room temperature for 2 h before measurements. The fluorescence increase of Hoechst-based probes binding to hpDNA was estimated using the following procedure: the probe from 1 mM DMSO stock solution was diluted to the final concentration of 2 μM in PBS buffer containing 30 μM of hpDNA (5′-CGCGAATTCGCGTTTTCGCGAATTCGCG-3′). Absorption and fluorescence were measured on a multiwell plate reader Spark® 20M (Tecan) in glass bottom 96-well plates (MatTek, Cat. No. PBK96G-1.5-5-F) at room temperature (25 °C). Absorption of solutions was recorded from 320 nm to 850 nm with a wavelength step size of 1 nm. The background absorption of the glass bottom plate was measured in wells containing only buffer and subtracted from the spectra of the samples. The fluorescence emission of the free dyes or final probes was recorded from 520 nm to 850 nm (for TMR, 495 nm exc., bandwidth 15 nm), 560 nm to 850 nm (for 580CP, 530 nm exc., bandwidth 15 nm), 600 nm to 850 nm (for 610CP, 570 nm exc., bandwidth 15 nm), and 620 nm to 850 nm (for SiR/GeR, 595 nm exc., bandwidth 15 nm) with a 5 nm emission bandwidth and 2 nm step size. All samples were prepared in technical triplicates, which was repeated three times as three independent experiments performed on different days.
Determination of quantum yields and lifetimes
The fluorescence quantum yields (absolute values) were obtained with a Quantaurus-QY absolute PL quantum yield spectrometer (model C11347-12, Hamamatsu) according to the manufacturer's instructions. Fluorescence lifetimes were measured with a Quantaurus-Tau fluorescence lifetime spectrometer (model C11367-32, Hamamatsu) according to the manufacturer's instructions. All measurements were performed in air-saturated PBS buffer containing 2 μM probe and 30 μM hpDNA after incubation for 2 h at room temperature.
Determination of K d
K d measurements were performed by titrating Hoechst or its derivatives in PBS (Lonza) with increasing concentrations of the 28 bp hpDNA in a 96-well plate and measuring the increase in fluorescence on a plate reader after 1 h incubation at room temperature. Hoechst 33342, TMR, 580CP, 610CP, GeR and SiR dyes were excited at 360 nm, 540 nm, 570 nm, 570 nm, 640 nm and 640 nm while recording emission at 480 nm, 580 nm, 610 nm, 640 nm, 670 nm and 670 nm respectively. The excitation and emission bandwidths were 10 nm for SiR/GeR and 15 nm for all other dyes. The K d values were determined by plotting the emission signal vs. hpDNA concentration and fitting the curve in GraphPad Prism 6 to the “Two site-binding + offset” function: 1 where A 1 and A 2 – fluorescence change after probe binding to the 1st and 2nd site respectively, X – target hpDNA concentration, K d1 and K d2 – dissociation constant of the probe from the 1st and 2nd site respectively, and offset – background fluorescence signal or “Single site binding” function: 2 where F min – fluorescence of the probe without the target, F max – fluorescence of the probe at the saturating concentration, p – probe concentration, X – target hpDNA concentration, and K d – dissociation constant of the probe. All measurements performed 3 times on different days, each time technical triplicates were measured. STED microscope with a 775 nm depletion laser All confocal and STED images were acquired on an Abberior STED 775 QUAD scanning microscope (Abberior Instruments GmbH, Germany) equipped with 561 nm and 640 nm 40 MHz pulsed excitation lasers, a pulsed 775 nm 40 MHz STED laser, and an UPlanSApo 100×/1.40 Oil objective. The following detection windows were used: TMR/Cy3 channel 615/20 nm and Cy5 channel 685/70 nm. The voxel size was 15–30 nm in the xy plane and 150 nm in the z -axis for STED images acquired using this setup. The pixel size was 50–150 nm in the xy plane for confocal images acquired using this setup. Laser powers were optimized for each sample. Molecular docking The DNA-Hoechst 33258 complex structure was downloaded from the PDB database (PDB ID: 8BNA ). 11 Only DNA molecules were used for the docking experiments. Ligands were drawn using ChemDraw Professional 15.1 and prepared for docking with AutoDock Tools version 1.5.6 ( ref. 12 ). The docking simulation was performed using Vina Autodock version 1.1.2 ( ref. 13 ). Twenty binding modes were generated starting from random configurations of ligands that had fully flexible torsional degrees of freedom.
Image analysis
The methods used for the image analysis are described in the ESI. †
Supplementary Material Supplementary information Click here for additional data file. Supplementary movie Click here for additional data file. Supplementary movie Click here for additional data file.
📊 Figures

Scheme 1
Synthesis of positional isomers of heteroatom substituted rhodamineu2013Hoechst conjugates.
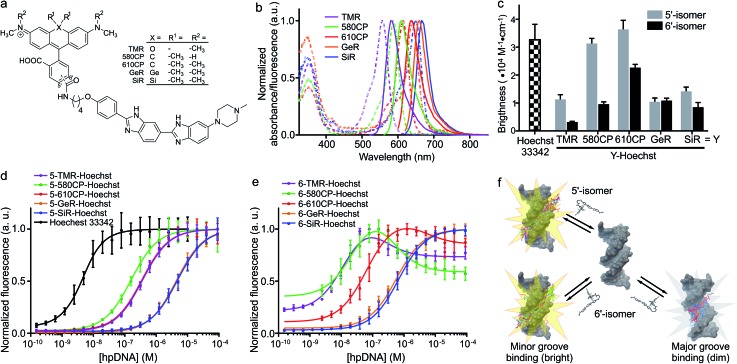
Fig. 1
Spectral and binding characteristics of Hoechst-based probes. (a) Structures of the Hoechst derivatives analyzed in this work. (b) Absorption (dashed line) and emission (solid line) spectra of dyes used for the generation of the DNA probes. (c) Brightness of Hoechst 33342 and its derivatives after binding to specific DNA. Measurements performed in PBS containing 2 u03bcM probe and 30 u03bcM hairpin DNA (hpDNA). (d) Titration of 4 nM Hoechst 33342 and 10 nM Hoechst 5u2032-regioisomer conjugates with hpDNA. The data points are fitted to a single site binding equation. (e) Titration of 10 nM Hoechst 6u2032-regioisomer conjugates with hpDNA. 5-GeR-Hoechst and 6-SiR-Hoechst data points are fitted to a single site binding equation. In contrast, 6-TMR-Hoechst , 6-580CP-Hoechst and 6-610CP-Hoechst data points can be fitted to the two site-binding equation. All data points are presented as mean u00b1 s.d, N u2265 3. (f) Proposed model of rhodamineu2013Hoechst conjugate interaction with the target DNA. Minor groove binding results in a brighter complex compared to major groove binding. The docking results show 19 conformations of 610CP-Hoechst: all 5u2032-regioisomer conformers are positioned in the minor groove, 3 out of 19 6u2032-regioisomer conformers are positioned in the major groove. Docking models were built using the DNA structure taken from PDB ID: ; 8BNA .
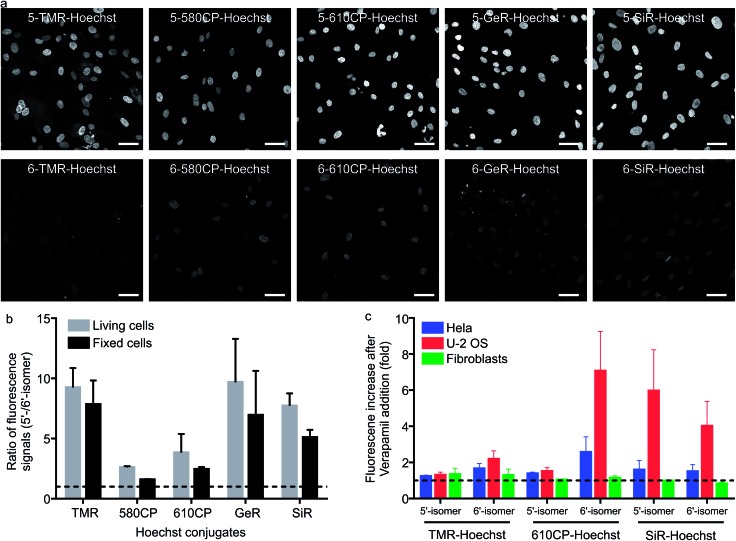
Fig. 2
Performance of 5u2032-regioisomer and 6u2032-regioisomer probes. (a) Representative confocal images of human fibroblasts stained with 1 u03bcM Hoechst derivatives for 1 h at 37 u00b0C in DMEM growth medium. Cells were washed with HBSS and imaged in DMEM. Scale bars: 50 u03bcm. (b) Quantification of the nuclear staining signal. Nuclei were automatically segmented and the signal of each staining was calculated by subtracting the mean fluorescence signal in the nucleus region from the narrow cytoplasmic area surrounding it. The median of the ratio of the fluorescence signal is presented. The dashed line indicates a ratio equal to 1. Bars show mean with the s.d. of three independent biological replicates; u226550 cells per replicate. (c) Effect of efflux pump inhibition on nuclei staining. Cells were incubated with a mixture of 1 u03bcM DNA probes and 10 u03bcM verapamil in DMEM for 1 h at 37 u00b0C, washed with HBSS, imaged in DMEM and the nuclear staining signal quantified. The dashed line indicates a ratio equal to 1. Bars show mean with the s.d. of three independent biological replicates; u226550 cells per replicate.
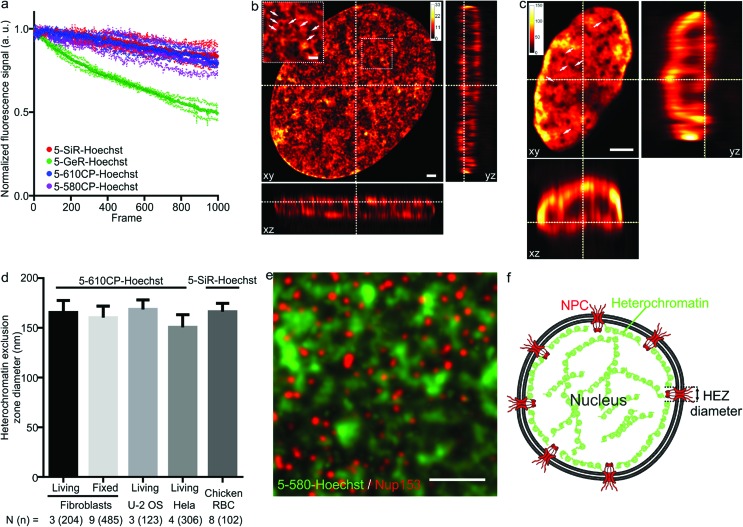
Fig. 3
STED nanoscopy images of nuclei in living cells. (a) Photostability of the indicated Hoechst derivatives under STED imaging conditions measured on the nuclei of living cells stained with corresponding 1 u03bcM DNA stain in DMEM growth medium at 37 u00b0C for 1 h. Data presented as mean (large circles) with the s.d. (small circles), N = 3 nuclei. (b) xy , xz and yz slices of a deconvolved STED z -stack of a living fibroblast stained with 1 u03bcM 5-610CP-Hoechst in DMEM growth medium. The sample was washed once before imaging. Arrows indicate heterochromatin exclusion zones (HEZs). Scale bar: 1 u03bcm in the large image and 0.5 u03bcm in the inset. (c) xy , xz and yz slices of a deconvolved STED z -stack of an intact chicken red blood cell (RBC), stained with 1 u03bcM 5-SiR-Hoechst in RBC buffer. The sample was imaged without washing. Arrows indicate HEZs. Scale bar: 1 u03bcm. (d) Comparison of the estimated HEZ diameters (see Materials and Methods) in the indicated cell types stained with 5-610CP-Hoechst or 5-SiR-Hoechst . See ESI u2020 for details about the estimation of HEZ diameters. Data presented as mean with the s.d., N and n indicate the number of analyzed cells and zones, respectively. (e) Two-color STED nanoscopy of 5-580CP-Hoechst stained and mouse anti-Nup153 antibody. Max intensity projection of 3 STED z -stack planes of a Hela cell nucleus stained with 5-580CP-Hoechst , mouse anti-Nup153 and anti-mouse-Abberior STAR 635. Image was deconvolved with SVI Huygens software. Scale bar: 1 u03bcm. (f) Proposed model of nuclear staining. Hoechst-based probes bind to the AT-rich heterochromatin after entering the nucleus. Heterochromatin is excluded from the location of nuclear pore complex (NPC) forming HEZs visible in the super-resolution microscopy images.
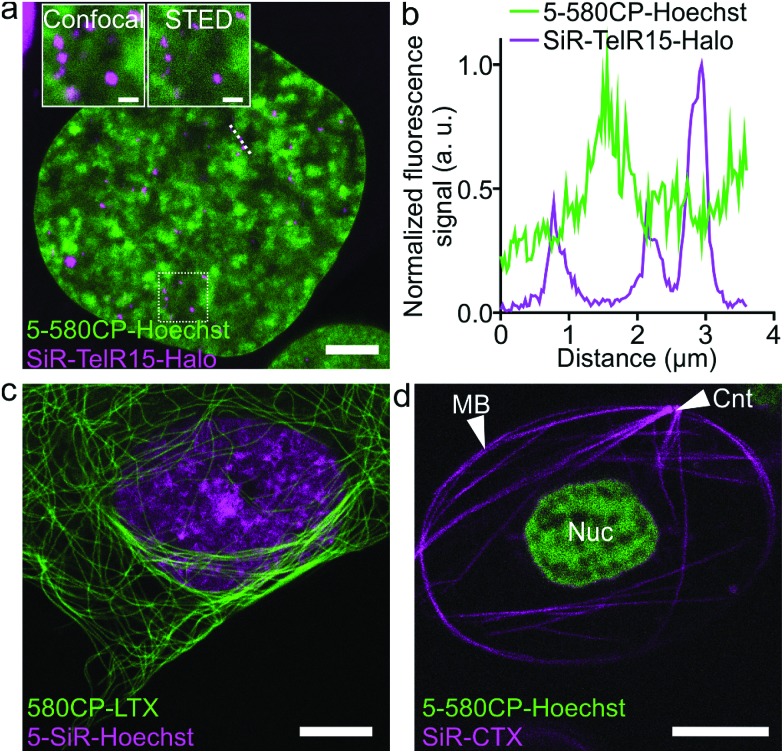
Fig. 4
Two-color STED nanoscopy images of living cells. (a) Two-color STED image of U-2 OS cells expressing TelR15-Halo stained with 1 u03bcM 5-580CP-Hoechst and 1 u03bcM SiR-Halo for 1 h at 37 u00b0C in DMEM growth medium. The inset shows the zoom-in image of the region within a white rectangle. Scale bars: 5 u03bcm in the large field of view and 1 u03bcm in the inset. (b) Profile of fluorescence signals measured along the dotted line depicted in (a). TelR15-Halo and 5-580CP-Hoechst signals are anti-correlating. (c) Two-color image of human fibroblasts stained with 1 u03bcM 580CP-LTX (tubulin probe) and 1 u03bcM 5-SiR-Hoechst for 1 h at 37 u00b0C in the complete DMEM growth medium. Scale bar: 5 u03bcm. (d) Two-color image of a Xenopus laevis erythrocyte stained with 1 u03bcM 5-580CP-Hoechst and 1 u03bcM SiR-CTX (tubulin probe) for 1 h at RT in RBC buffer. Note: CNT indicates the centrosome, MB u2013 marginal band, and Nuc u2013 nucleus. No washing steps were applied before imaging in RBC buffer. Scale bar: 5 u03bcm.
Figure images are served from the NIH/NLM PubMed Central Open Access Subset or Europe PMC; copyright remains with the publishers and authors.
💬 Discussion
0 commentsNo comments yet. Be the first to start a discussion!
Leave a Comment