Abstract
Sequence-specific pausing by RNA polymerase (RNAP) during transcription plays crucial and diverse roles in gene expression. In bacteria, RNA structures are thought to fold within the RNA exit channel of the RNAP and can increase pause lifetimes significantly. The biophysical mechanism of pausing is uncertain. We used single-particle cryo-EM to determine structures of paused complexes, including a 3.8-Å structure of an RNA hairpin-stabilized, paused RNAP that coordinates RNA folding in the his operon attenuation control region of E. coli. The structures revealed a half-translocated pause state (RNA post-translocated, DNA pre-translocated) that can explain transcriptional pausing and a global conformational change of RNAP that allosterically inhibits trigger loop folding and can explain pause hairpin action. Pause hairpin interactions with the RNAP RNA exit channel suggest how RNAP guides the formation of nascent RNA structures.
🔬 Techniques
🔭 Microscopes
🧬 Organisms
💻 Software
✨ Fluorophores
🧪 Sample Preparation
🔬 Cell Lines
🏭 Microscope Brands
🧪 Reagent Suppliers
📷 Detectors
💻 Software Details
💾 Data Repositories
🏛️ Research Organizations (ROR)
Affiliated research institutions:
📋 Methods
CONTACT FOR REAGENT AND RESOURCE SHARING R. Landick, landick@bact.wisc.edu METHODS DETAILS RNAP expression and purification for Cryo-EM Eco RNAP lacking the αCTDs was prepared as described previously ( Twist et al., 2011 ). Glycerol was added to the purified RNAP to 15% (v/v), and the sample was aliquoted and flash-frozen in liquid nitrogen. The aliquots were stored at −80 °C until use. his PEC preparation for Cryo-EM Synthetic DNA and RNA oligonucleotides were obtained from Integrated DNA Technologies (Coralville, IA). The his PEC RNA was gel-purified before use. The nucleic acids for RNA hairpin-stabilized pause ECs ( his PECs) were dissolved in RNase-free water (Ambion/ThermoFisher Scientific, Waltham, MA) at 0.2–1 mM. Template DNA and RNA were annealed at a 1:1 ratio in a thermocycler (95 °C for 2 min, 75 °C for 2 min, 45 °C for 5 min, followed by a steady cooling to 25 °C at 1 °C/min). The annealed template RNA-DNA hybrid was stored at −80 °C until use. Purified Eco RNAP was buffer-exchanged over a Superose 6 INCREASE (GE Healthcare Life Sciences) column into 20 mM Tris-HCl, pH 8.0, 150 mM potassium glutamate, 5 mM MgCl 2 , 5 mM DTT. The eluted protein was mixed with template RNA-DNA hybrid at a molar ratio of 1:1.3 and incubated for 15 min at room temperature. Non-template DNA and additional 5 mM MgCl 2 was added and incubated for 10 min. The complex was concentrated by centrifugal filtration (EMD Millipore, Billerica, MA) to 4.0–5.5 mg RNAP/ml concentration before grid preparation.
Show full methods section
CONTACT FOR REAGENT AND RESOURCE SHARING R. Landick, landick@bact.wisc.edu METHODS DETAILS RNAP expression and purification for Cryo-EM Eco RNAP lacking the αCTDs was prepared as described previously ( Twist et al., 2011 ). Glycerol was added to the purified RNAP to 15% (v/v), and the sample was aliquoted and flash-frozen in liquid nitrogen. The aliquots were stored at −80 °C until use. his PEC preparation for Cryo-EM Synthetic DNA and RNA oligonucleotides were obtained from Integrated DNA Technologies (Coralville, IA). The his PEC RNA was gel-purified before use. The nucleic acids for RNA hairpin-stabilized pause ECs ( his PECs) were dissolved in RNase-free water (Ambion/ThermoFisher Scientific, Waltham, MA) at 0.2–1 mM. Template DNA and RNA were annealed at a 1:1 ratio in a thermocycler (95 °C for 2 min, 75 °C for 2 min, 45 °C for 5 min, followed by a steady cooling to 25 °C at 1 °C/min). The annealed template RNA-DNA hybrid was stored at −80 °C until use. Purified Eco RNAP was buffer-exchanged over a Superose 6 INCREASE (GE Healthcare Life Sciences) column into 20 mM Tris-HCl, pH 8.0, 150 mM potassium glutamate, 5 mM MgCl 2 , 5 mM DTT. The eluted protein was mixed with template RNA-DNA hybrid at a molar ratio of 1:1.3 and incubated for 15 min at room temperature. Non-template DNA and additional 5 mM MgCl 2 was added and incubated for 10 min. The complex was concentrated by centrifugal filtration (EMD Millipore, Billerica, MA) to 4.0–5.5 mg RNAP/ml concentration before grid preparation.
Cryo-EM grid preparation
Before freezing, CHAPSO was added to 8 mM final concentration to the samples. C-flat (Protochips, Morrisville, NC) CF-1.2/1.3 400 mesh gold grids were glow-charged for 15 s prior to the application of 3.5 µl of the complex sample and then plunge-frozen in liquid ethane using a Vitrobot mark IV (FEI, Hillsboro, OR) with 100% chamber humidity at 22 °C.
Cryo-EM data acquisition and processing
The grids were imaged using a 300 keV Titan Krios (FEI) equipped with a K2 Summit direct electron detector (Gatan, Pleasanton, CA). Images were recorded with Serial EM ( Mastronarde, 2005 ) in super-resolution counting mode with a super resolution pixel size of 0.515 Å and a defocus range of 0.8 to 2.4 µm. Data were collected with a dose of 8 electrons/physical pixel/s (1.03 Å pixel size at the specimen). Images were recorded with a 10 s exposure and 0.2 s subframes (50 total frames) to give a total dose of 75.4 electrons/Å 2 . Dose fractionated subframes were 2 × 2 binned (giving a pixel size of 1.03 Å), aligned and summed using Unblur ( Grant and Grigorieff, 2015 ). The contrast transfer function was estimated for each summed image using CTFFIND4 ( Rohou and Grigorieff, 2015 ). From the summed images, particles were automatically picked in Gautomatch (Zhang, unpublished; see Key Resource Table ), manually inspected, and then individually aligned using direct-detector-align_lmbfgs software ( Rubinstein and Brubaker, 2015 ). The aligned particles were subjected to 2D classification in RELION specifying 100 classes ( Scheres, 2012 ), and poorly populated classes were removed, resulting in 369,000 particles. These particles were 3D autorefined in RELION using a map of Eco elongation complex (EMD-8585; Kang et al., 2017 ), low-pass filtered to 60 Å resolution as an initial 3D template. With this initial model, 3D classifications were performed without alignment. Among the 3D classes, bad classes were excluded, and the rest were combined and subjected to second 3D classification without alignment. From this classification, the best-resolved class was 3D autorefined with solvent flattening, and post-processed in RELION. To resolve heterogeneity around RNA hairpin stem in RNA exit channel, focused 3D classification on the RNA hairpin and the surrounding helices was performed ( Figure S2F ). A soft map that excluded the PH and nearby protein regions was generated in Chimera and RELION. The mask was used to make a subtracted particle stack in RELION with the filtered map generated in the initial autorefinement. The subtracted particles were 3D classified into six classes without alignment, and one class lacked PH density. The original (unmasked) particles in this class were autorefined and post-processed in RELION, yielding the final reconstruction at 5.5 Å resolution ( his PEC-minus-PH). Local resolution calculation was performed using blocres ( Cardone et al., 2013 ). Model building, refinement and validation To build initial models, Eco core enzyme (PDB ID 4LJZ with σ 70 removed; Bae et al., 2013 ) and nucleic acids (PDB ID 6ALF; Kang et al., 2017 ) were fitted into the electron density maps using Chimera ( Pettersen et al., 2004 ). These initial models were real-space refined against the working half map using Phenix ( Adams et al., 2010 ). In the refinement, domains in the core and nucleic acids were rigid-body refined, then subsequently refined with secondary structure restraints. At the end of refinement, Fourier shell correlations (FSC) were calculated between the refined model and the half map used for refinement (work), the other half map (free), and the full map to assess over-fitting ( Figure S2E ). RNAP expression and purification for in vitro biochemical experiments Wild-type and variant RNAPs were overexpressed from plasmids ( Key Resources Table ). Eco RNAP lacking the αCTDs was prepared as described previously ( Kohler et al., 2017 ). pRM843 and mutant derivatives are T7 RNAP-based overexpression plasmids containing Eco rpoA, rpoZ, rpoB and rpoC and yields core RNAP with a His 10 tag on the N terminus of β and protein kinase A (PKA) and a strep tag on the C terminus of β′. RNAPs were purified from Eco BLR λDE3 cells transformed with the appropriate plasmids as previously described ( Hein et al., 2014 ). Briefly, after lysis and PEI precipitation and extraction, protein was precipitated with ammonium sulfate. After re-suspension, the protein solution was applied to a HisTrap column, washed, and eluted with a gradient of increasing imidazole concentration. Protein-containing fractions were pooled and dialyzed into 100 mM Tris-HCl, pH 7.9, 150 mM NaCl, 0.1 mM EDTA, and 5 mM β-mercaptoethanol for 4 h at 4 °C, and then loaded onto a StrepTactin column. After washing, the protein was step-eluted with the same buffer containing 2.5 mM D-desthiobiotin. Fractions with RNAP were identified, pooled, and loaded onto a HiTrap Heparin HP column. After elution, the protein was dialyzed into RNAP storage buffer (20 mM Tris-HCl, pH 8.0, 250 mM NaCl, 20 µM ZnCl 2 , 1 mM MgCl 2 , 0.1 mM EDTA, 1 mM DTT, and 20% glycerol) and stored as aliquots at −80 °C until use. In vitro transcription assays Nucleic acid scaffolds used to reconstitute RNA hairpin-stabilized pause ECs ( his PECs) were assembled in 20 mM Tris-HCl, pH 8.0, 150 potassium glutamate, 5 mM MgCl 2 , and 5 mM DTT in a thermocycler, as described for the cryo-EM scaffold preparation. Oligonucleotides for these experiments ( Key Resources Table ) were obtained from Integrated DNA Technologies (Coralville, IA) and gel-purified before use. The scaffolds contained 5 µM RNA and 10 µM template DNA. RNAs containing the hairpin were 5′-labeled prior to scaffold assembly, in a T4 PNK-catalyzed reaction with [γ- 32 P]ATP. The his PECs were formed by incubating 1.5 µM RNAP (wild-type or αCTD RNAP as appropriate) with 0.5 µM (based on RNA concentration) scaffold for 15 min at room temperature, followed by an additional 10 min at room temperature in the presence of 2.5 µM non-template DNA. These reconstitution conditions were designed to mirror those used during cryo-EM sample preparation. CHAPSO (final concentration 8 mM, as in cryo-EM buffer) and heparin (final 0.1 mg/ml) were added to the reconstituted complexes, followed by incubation for 3 min at 37 °C. The ECs formed 1-nt upstream of the pause (C28) were then walked to the pause (U29) in a reaction with 100 µM UTP for 3 min at 37 °C. Kinetics of his PEC escape from the pause was measured by reacting his PECs with 10 µM GTP and 100 µM ATP at 37 °C. Reaction samples were removed at various time points and quenched with an equal volume of 2× urea stop buffer (8 M urea, 50 mM EDTA, 90 mM Tris-borate buffer, pH 8.3, 0.02% each bromophenol blue and xylene cyanol). All active PECs were chased out of the pause with 1 mM GTP for 5 min at 37 °C. RNAs in each quenched reaction sample were separated on a 15% urea-PAGE gel. The gel was exposed to a PhosphorImager screen, and the screen was scanned using Typhoon PhosphorImager software and quantified in ImageQuant ( Figure 1B ). The fraction of RNA at the position of the pause over time was fitted to a single-exponential in KaleidaGraph, to extract pause efficiencies (amplitude) and rate constants of pause escape for each RNAP ( Figure S1A–F ). We observed that the his PEC escaped the pause site 10 times slower than the ePEC ( Figure S1A ); that CHAPSO modestly reduced pause lifetime (by a factor of ~2; Figure S1B ); that neither the cryoEM scaffold nor the deletion of αCTD altered pause lifetimes ( Figure S1C ); that his PECs formed by nucleotide addition (C28→U29; Figure S1D ) were kinetically indistinguishable from those formed by direct reconstitution (U29, Figure S1C ; see also Kyzer et al., 2007 ); and that a 1-nt extension of the spacer between the PH and the RNA-DNA hybrid increased pause lifetime (~2-fold, Figure S1E ). Cys Triplet Reporter (CTR) assays ( Figures 5C and 5D ) Nucleic-acid scaffolds used to reconstitute his PEC or ECs for Cys triplet reporter cross-linking assays were assembled on purified DNA and RNA oligonucleotides as described previously ( Hein et al., 2014 ; Kyzer et al., 2007 ). Briefly, 10 µM RNA, 12 µM template DNA, and 15 µM non-template DNA (Resource Table) were annealed in reconstitution buffer (RB; 20 mM Tris-HCl, pH 7.9, 20 mM NaCl, and 0.1 mM EDTA). To assemble complexes, scaffold (2 µM) was mixed with limiting CTR RNAP (1 µM; CTR RNAP: β′1045iC 258iC, β843C) in transcription buffer (50 mM Tris-HCl, pH 7.9, 20 mM NaCl, 10 mM MgCl 2 , 0.1 mM EDTA, 5% glycerol, and 2.5 µg of acetylated bovine serum albumin/ml) and added to mixtures of cystamine and DTT to generate redox potentials that ranged from −0.314 to −0.424. Complexes were incubated for 60 min at room temperature and then were quenched with the addition of iodoacetamide to 15 mM. The formation of cysteine-pair cross-links was then evaluated by non-reducing SDS-PAGE (4–15% gradient Phastgel; GE) as described previously ( Nayak et al., 2013 ). Gels were stained with Coomassie Blue and imaged with a CCD camera. The fraction cross-linked was quantified with ImageJ software. The experimental error was determined as the standard deviation of measurements from three or more independent replicates. Cys-pair RNAP pause assays ( Figure 5E ) Nucleic-acid scaffold used to reconstitute elemental paused ECs (ePECs; minus-PH) for Cys-pair crosslinking experiments was assembled as previously described ( Hein et al., 2014 ). Briefly, PAGE-purified G17 RNA (2 nt upstream of the pause site, 10 µM), template DNA (15 µM), and non-template DNA (20 µM) were annealed in reconstitution buffer (RB; 10 mM Tris-HCl, pH 7.9, 40 mM KCl, and 5 mM MgCl 2 ). The sequences of the nucleic acids and their corresponding stock numbers are listed in the Key Resources Table . The G17 ePECs containing limiting Cys-pair reporter RNAP (1 µM) were reconstituted on this scaffold (4 µM, based on RNA concentration) in Elongation Buffer (EB; 25 mM HEPES-KOH, pH 8.0, 130 mM KCl, 5 mM MgCl 2 , 1 mM dithiothreitol, DTT, 0.15 mM EDTA, 5% glycerol, and 25 µg of acetylated bovine serum albumin/ml), for 15 min at 37 °C. Wild-type RNAP was tested as a control side-by-side with Cys-pair reporter RNAPs. Crosslinking of 1 µM ePECs was performed in the presence of 1 mM cystamine as the oxidant and 0.8 mM DTT, for 15 min at 37 °C. An aliquot of the crosslinking reaction was quenched with 15 mM iodoacetamide (final concentration) and analyzed by non-reducing SDS-PAGE for the formation of the crosslink. PAGE separation of the crosslinked from non-crosslinked β-β′ RNAP subunits was performed on an 8% Bolt Bis-Tris gel (ThermoFisher Scientific), at 200 V for 1 hour. The gel was Coomassie-stained, destained, and visualized with a CCD camera to quantify the fraction of the RNAP with a disulfide bond crosslink. The remaining crosslinked ePECs were diluted to 0.2 µM with EB (without DTT, for crosslinked samples) and incubated with heparin (0.1 mg/ml final) for 3 min at 37 °C. The ePECs were then radiolabeled by incorporation of trace [α- 32 P]CMP and 2 µM unlabeled CMP for 1 min at 37 °C, and walked to the position of the pause, U19, in the reaction with 100 µM UTP for an additional 3 min at 37 °C. The resulting U19 complexes were incubated without and with 1 µM 8mer antisense RNA (asRNA), to form an RNA-duplex mimic of the his PEC hairpin. PECs were assayed for pause-escape kinetics by addition of 10 µM GTP in EB (without DTT, for crosslinked samples) at 37 °C. Reaction samples were removed at various time points and quenched with an equal volume of 2× urea stop buffer. All active PECs were chased out of the pause with 500 µM GTP for 5 min at 37 °C. RNAs in each quenched reaction. RNAs in each quenched reaction sample were separated on a 15% urea-PAGE gel. The gel was visualized and quantified as described for in vitro transcription assays.
QUANTIFICATION AND STATISTICAL ANALYSIS
To measure pausing kinetics ( Figures 1C , 5E , and S1 ), RNAs were quantified after electrophoretic separation in polyacrylamide gels using a Typhoon PhosphorImager and ImageQuant software (GE Healthcare Life Sciences). Mean values and standard deviations from at least three independent experiments were calculated to create plots of RNA levels versus time, unless otherwise noted in the figure legends. The resulting data were used to calculate pause lifetimes, where reported, by non-linear regression of data from each experiment, and then reported as the mean and standard deviation of the calculated lifetimes. Measurements of disulfide crosslinking ( Figure 5C and 5D ) were obtained from Coomassie Blue R-stained polyacrylamide gels using a Protein Simple CCD camera and software, and then quantified using Imagequant. Mean values and standard deviations from at least three independent experiments were calculated to create plots of crosslink levels versus redox potential. The local resolution of the cryo-EM maps was estimated using blocres ( Cardone et al., 2013 ) with the following parameters: ( his PEC, Figures 1D and S2G–I : box size 15, verbose 7, cutoff 0.5; his PEC-minus-PH, Figure 7A : box size 22, verbose 7, cutoff 0.5). The quantification and statistical analyses for model refinement and validation were integral parts of the software algorithms used [MolProbity: ( Chen et al., 2010 ); PHENIX: ( Adams et al., 2010 )].
DATA AND SOFTWARE AVAILABILITY
The cryoEM density maps have been deposited in the EM Data Bank with accession codes EMD-7002 ( his PEC) and EMD-7103 ( his PEC-minus-PH). Atomic coordinates have been deposited in the Protein Data Bank with accession codes 6ASX ( his PEC) and 6BJS ( his PEC-minus-PH).
METHODS DETAILS RNAP expression and purification for Cryo-EM Eco RNAP lacking the αCTDs was prepared as described previously ( Twist et al., 2011 ). Glycerol was added to the purified RNAP to 15% (v/v), and the sample was aliquoted and flash-frozen in liquid nitrogen. The aliquots were stored at −80 °C until use. his PEC preparation for Cryo-EM Synthetic DNA and RNA oligonucleotides were obtained from Integrated DNA Technologies (Coralville, IA). The his PEC RNA was gel-purified before use. The nucleic acids for RNA hairpin-stabilized pause ECs ( his PECs) were dissolved in RNase-free water (Ambion/ThermoFisher Scientific, Waltham, MA) at 0.2–1 mM. Template DNA and RNA were annealed at a 1:1 ratio in a thermocycler (95 °C for 2 min, 75 °C for 2 min, 45 °C for 5 min, followed by a steady cooling to 25 °C at 1 °C/min). The annealed template RNA-DNA hybrid was stored at −80 °C until use. Purified Eco RNAP was buffer-exchanged over a Superose 6 INCREASE (GE Healthcare Life Sciences) column into 20 mM Tris-HCl, pH 8.0, 150 mM potassium glutamate, 5 mM MgCl 2 , 5 mM DTT. The eluted protein was mixed with template RNA-DNA hybrid at a molar ratio of 1:1.3 and incubated for 15 min at room temperature. Non-template DNA and additional 5 mM MgCl 2 was added and incubated for 10 min. The complex was concentrated by centrifugal filtration (EMD Millipore, Billerica, MA) to 4.0–5.5 mg RNAP/ml concentration before grid preparation.
Cryo-EM grid preparation
Before freezing, CHAPSO was added to 8 mM final concentration to the samples. C-flat (Protochips, Morrisville, NC) CF-1.2/1.3 400 mesh gold grids were glow-charged for 15 s prior to the application of 3.5 µl of the complex sample and then plunge-frozen in liquid ethane using a Vitrobot mark IV (FEI, Hillsboro, OR) with 100% chamber humidity at 22 °C.
Cryo-EM data acquisition and processing
The grids were imaged using a 300 keV Titan Krios (FEI) equipped with a K2 Summit direct electron detector (Gatan, Pleasanton, CA). Images were recorded with Serial EM ( Mastronarde, 2005 ) in super-resolution counting mode with a super resolution pixel size of 0.515 Å and a defocus range of 0.8 to 2.4 µm. Data were collected with a dose of 8 electrons/physical pixel/s (1.03 Å pixel size at the specimen). Images were recorded with a 10 s exposure and 0.2 s subframes (50 total frames) to give a total dose of 75.4 electrons/Å 2 . Dose fractionated subframes were 2 × 2 binned (giving a pixel size of 1.03 Å), aligned and summed using Unblur ( Grant and Grigorieff, 2015 ). The contrast transfer function was estimated for each summed image using CTFFIND4 ( Rohou and Grigorieff, 2015 ). From the summed images, particles were automatically picked in Gautomatch (Zhang, unpublished; see Key Resource Table ), manually inspected, and then individually aligned using direct-detector-align_lmbfgs software ( Rubinstein and Brubaker, 2015 ). The aligned particles were subjected to 2D classification in RELION specifying 100 classes ( Scheres, 2012 ), and poorly populated classes were removed, resulting in 369,000 particles. These particles were 3D autorefined in RELION using a map of Eco elongation complex (EMD-8585; Kang et al., 2017 ), low-pass filtered to 60 Å resolution as an initial 3D template. With this initial model, 3D classifications were performed without alignment. Among the 3D classes, bad classes were excluded, and the rest were combined and subjected to second 3D classification without alignment. From this classification, the best-resolved class was 3D autorefined with solvent flattening, and post-processed in RELION. To resolve heterogeneity around RNA hairpin stem in RNA exit channel, focused 3D classification on the RNA hairpin and the surrounding helices was performed ( Figure S2F ). A soft map that excluded the PH and nearby protein regions was generated in Chimera and RELION. The mask was used to make a subtracted particle stack in RELION with the filtered map generated in the initial autorefinement. The subtracted particles were 3D classified into six classes without alignment, and one class lacked PH density. The original (unmasked) particles in this class were autorefined and post-processed in RELION, yielding the final reconstruction at 5.5 Å resolution ( his PEC-minus-PH). Local resolution calculation was performed using blocres ( Cardone et al., 2013 ). Model building, refinement and validation To build initial models, Eco core enzyme (PDB ID 4LJZ with σ 70 removed; Bae et al., 2013 ) and nucleic acids (PDB ID 6ALF; Kang et al., 2017 ) were fitted into the electron density maps using Chimera ( Pettersen et al., 2004 ). These initial models were real-space refined against the working half map using Phenix ( Adams et al., 2010 ). In the refinement, domains in the core and nucleic acids were rigid-body refined, then subsequently refined with secondary structure restraints. At the end of refinement, Fourier shell correlations (FSC) were calculated between the refined model and the half map used for refinement (work), the other half map (free), and the full map to assess over-fitting ( Figure S2E ). RNAP expression and purification for in vitro biochemical experiments Wild-type and variant RNAPs were overexpressed from plasmids ( Key Resources Table ). Eco RNAP lacking the αCTDs was prepared as described previously ( Kohler et al., 2017 ). pRM843 and mutant derivatives are T7 RNAP-based overexpression plasmids containing Eco rpoA, rpoZ, rpoB and rpoC and yields core RNAP with a His 10 tag on the N terminus of β and protein kinase A (PKA) and a strep tag on the C terminus of β′. RNAPs were purified from Eco BLR λDE3 cells transformed with the appropriate plasmids as previously described ( Hein et al., 2014 ). Briefly, after lysis and PEI precipitation and extraction, protein was precipitated with ammonium sulfate. After re-suspension, the protein solution was applied to a HisTrap column, washed, and eluted with a gradient of increasing imidazole concentration. Protein-containing fractions were pooled and dialyzed into 100 mM Tris-HCl, pH 7.9, 150 mM NaCl, 0.1 mM EDTA, and 5 mM β-mercaptoethanol for 4 h at 4 °C, and then loaded onto a StrepTactin column. After washing, the protein was step-eluted with the same buffer containing 2.5 mM D-desthiobiotin. Fractions with RNAP were identified, pooled, and loaded onto a HiTrap Heparin HP column. After elution, the protein was dialyzed into RNAP storage buffer (20 mM Tris-HCl, pH 8.0, 250 mM NaCl, 20 µM ZnCl 2 , 1 mM MgCl 2 , 0.1 mM EDTA, 1 mM DTT, and 20% glycerol) and stored as aliquots at −80 °C until use. In vitro transcription assays Nucleic acid scaffolds used to reconstitute RNA hairpin-stabilized pause ECs ( his PECs) were assembled in 20 mM Tris-HCl, pH 8.0, 150 potassium glutamate, 5 mM MgCl 2 , and 5 mM DTT in a thermocycler, as described for the cryo-EM scaffold preparation. Oligonucleotides for these experiments ( Key Resources Table ) were obtained from Integrated DNA Technologies (Coralville, IA) and gel-purified before use. The scaffolds contained 5 µM RNA and 10 µM template DNA. RNAs containing the hairpin were 5′-labeled prior to scaffold assembly, in a T4 PNK-catalyzed reaction with [γ- 32 P]ATP. The his PECs were formed by incubating 1.5 µM RNAP (wild-type or αCTD RNAP as appropriate) with 0.5 µM (based on RNA concentration) scaffold for 15 min at room temperature, followed by an additional 10 min at room temperature in the presence of 2.5 µM non-template DNA. These reconstitution conditions were designed to mirror those used during cryo-EM sample preparation. CHAPSO (final concentration 8 mM, as in cryo-EM buffer) and heparin (final 0.1 mg/ml) were added to the reconstituted complexes, followed by incubation for 3 min at 37 °C. The ECs formed 1-nt upstream of the pause (C28) were then walked to the pause (U29) in a reaction with 100 µM UTP for 3 min at 37 °C. Kinetics of his PEC escape from the pause was measured by reacting his PECs with 10 µM GTP and 100 µM ATP at 37 °C. Reaction samples were removed at various time points and quenched with an equal volume of 2× urea stop buffer (8 M urea, 50 mM EDTA, 90 mM Tris-borate buffer, pH 8.3, 0.02% each bromophenol blue and xylene cyanol). All active PECs were chased out of the pause with 1 mM GTP for 5 min at 37 °C. RNAs in each quenched reaction sample were separated on a 15% urea-PAGE gel. The gel was exposed to a PhosphorImager screen, and the screen was scanned using Typhoon PhosphorImager software and quantified in ImageQuant ( Figure 1B ). The fraction of RNA at the position of the pause over time was fitted to a single-exponential in KaleidaGraph, to extract pause efficiencies (amplitude) and rate constants of pause escape for each RNAP ( Figure S1A–F ). We observed that the his PEC escaped the pause site 10 times slower than the ePEC ( Figure S1A ); that CHAPSO modestly reduced pause lifetime (by a factor of ~2; Figure S1B ); that neither the cryoEM scaffold nor the deletion of αCTD altered pause lifetimes ( Figure S1C ); that his PECs formed by nucleotide addition (C28→U29; Figure S1D ) were kinetically indistinguishable from those formed by direct reconstitution (U29, Figure S1C ; see also Kyzer et al., 2007 ); and that a 1-nt extension of the spacer between the PH and the RNA-DNA hybrid increased pause lifetime (~2-fold, Figure S1E ). Cys Triplet Reporter (CTR) assays ( Figures 5C and 5D ) Nucleic-acid scaffolds used to reconstitute his PEC or ECs for Cys triplet reporter cross-linking assays were assembled on purified DNA and RNA oligonucleotides as described previously ( Hein et al., 2014 ; Kyzer et al., 2007 ). Briefly, 10 µM RNA, 12 µM template DNA, and 15 µM non-template DNA (Resource Table) were annealed in reconstitution buffer (RB; 20 mM Tris-HCl, pH 7.9, 20 mM NaCl, and 0.1 mM EDTA). To assemble complexes, scaffold (2 µM) was mixed with limiting CTR RNAP (1 µM; CTR RNAP: β′1045iC 258iC, β843C) in transcription buffer (50 mM Tris-HCl, pH 7.9, 20 mM NaCl, 10 mM MgCl 2 , 0.1 mM EDTA, 5% glycerol, and 2.5 µg of acetylated bovine serum albumin/ml) and added to mixtures of cystamine and DTT to generate redox potentials that ranged from −0.314 to −0.424. Complexes were incubated for 60 min at room temperature and then were quenched with the addition of iodoacetamide to 15 mM. The formation of cysteine-pair cross-links was then evaluated by non-reducing SDS-PAGE (4–15% gradient Phastgel; GE) as described previously ( Nayak et al., 2013 ). Gels were stained with Coomassie Blue and imaged with a CCD camera. The fraction cross-linked was quantified with ImageJ software. The experimental error was determined as the standard deviation of measurements from three or more independent replicates. Cys-pair RNAP pause assays ( Figure 5E ) Nucleic-acid scaffold used to reconstitute elemental paused ECs (ePECs; minus-PH) for Cys-pair crosslinking experiments was assembled as previously described ( Hein et al., 2014 ). Briefly, PAGE-purified G17 RNA (2 nt upstream of the pause site, 10 µM), template DNA (15 µM), and non-template DNA (20 µM) were annealed in reconstitution buffer (RB; 10 mM Tris-HCl, pH 7.9, 40 mM KCl, and 5 mM MgCl 2 ). The sequences of the nucleic acids and their corresponding stock numbers are listed in the Key Resources Table . The G17 ePECs containing limiting Cys-pair reporter RNAP (1 µM) were reconstituted on this scaffold (4 µM, based on RNA concentration) in Elongation Buffer (EB; 25 mM HEPES-KOH, pH 8.0, 130 mM KCl, 5 mM MgCl 2 , 1 mM dithiothreitol, DTT, 0.15 mM EDTA, 5% glycerol, and 25 µg of acetylated bovine serum albumin/ml), for 15 min at 37 °C. Wild-type RNAP was tested as a control side-by-side with Cys-pair reporter RNAPs. Crosslinking of 1 µM ePECs was performed in the presence of 1 mM cystamine as the oxidant and 0.8 mM DTT, for 15 min at 37 °C. An aliquot of the crosslinking reaction was quenched with 15 mM iodoacetamide (final concentration) and analyzed by non-reducing SDS-PAGE for the formation of the crosslink. PAGE separation of the crosslinked from non-crosslinked β-β′ RNAP subunits was performed on an 8% Bolt Bis-Tris gel (ThermoFisher Scientific), at 200 V for 1 hour. The gel was Coomassie-stained, destained, and visualized with a CCD camera to quantify the fraction of the RNAP with a disulfide bond crosslink. The remaining crosslinked ePECs were diluted to 0.2 µM with EB (without DTT, for crosslinked samples) and incubated with heparin (0.1 mg/ml final) for 3 min at 37 °C. The ePECs were then radiolabeled by incorporation of trace [α- 32 P]CMP and 2 µM unlabeled CMP for 1 min at 37 °C, and walked to the position of the pause, U19, in the reaction with 100 µM UTP for an additional 3 min at 37 °C. The resulting U19 complexes were incubated without and with 1 µM 8mer antisense RNA (asRNA), to form an RNA-duplex mimic of the his PEC hairpin. PECs were assayed for pause-escape kinetics by addition of 10 µM GTP in EB (without DTT, for crosslinked samples) at 37 °C. Reaction samples were removed at various time points and quenched with an equal volume of 2× urea stop buffer. All active PECs were chased out of the pause with 500 µM GTP for 5 min at 37 °C. RNAs in each quenched reaction. RNAs in each quenched reaction sample were separated on a 15% urea-PAGE gel. The gel was visualized and quantified as described for in vitro transcription assays.
Supplementary Material 1 2 Movie S1. Conformational changes in the RNA exit channel and swivel module of RNAP: his PEC versus EC. Related to Figure 3 In the first part of the movie, the RNA exit channel is widened to accommodate the pause RNA hairpin (PDB 6ASX) in comparison to the exit channel in an EC structure (PDB 6ALF). The RNA hairpin loop structure in the his PEC was modeled using MCFold ( http://www.major.iric.ca/MC-Pipeline/ ) because it was disordered in the cryo-EM density map. The RNA hairpin loop is connected to the pause hairpin stem that is positioned as observed in the cryo-EM map. The single-stranded RNA within and outside the EC exit channel is modeled arbitrarily (also disordered in the cryo-EM map). In the second part of the movie, the components of the swivel module (clamp, dock, β′ C-term, shelf, jaw, and SI3) are depicted and the rotation of the swivel module between the conformations observed in the his PEC and EC structures is shown. 3 Movie S2. SI3 movement that normally accompanies trigger loop folding generates steric clash after swivel module rotation in the his PEC. Related to Figure 4 Movement of SI3 ( magenta ) between its position in EC (PDB 6ALF; unfolded trigger loop) and its position in an initiating transcription complex with bound NTP (PDB 4YLN; folded trigger loop) is shown. To aid comparison, sigma factor was removed from the initiating complex and a complete RNA:DNA hybrid was added. The upstream DNA duplex was removed from both models. When the trigger loop (TL) is unfolded in the EC, SI3 is in the OUT position (SI3 is a 188-aa insertion into the TL). When the TL folds into the trigger helices (TH) in the NTP-bound complex, SI3 moves toward the bridge helix into the IN position because the unfolded polypeptide linker segments between the TL and SI3 are shortened due to TH formation. In the his PEC, however, rotation of the swivel module, which includes SI3, repositions SI3 and the shelf in ways that would generate steric clash if SI3 were to shift to the IN position ( yellow stars; upstream DNA was also removed from this his PEC model). The apparent rotation of downstream DNA during swivel rotation is an artifact of the morphing software used to generate the movie; the downstream DNA does not rotate, rather its position shifts slightly during swivel module rotation.
📊 Figures
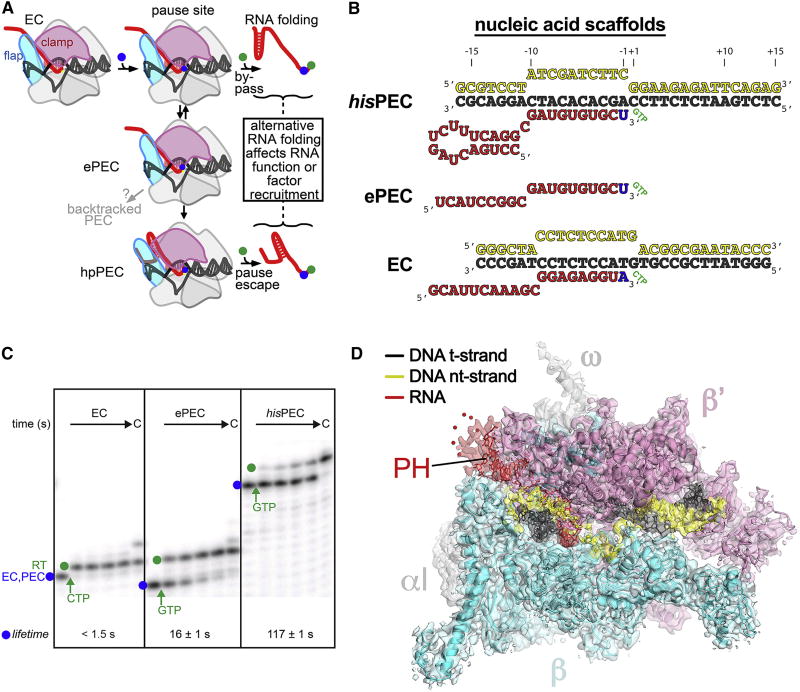
Figure 1
The mechanism of pausing and structure of the his RNA hairpin-stabilized PEC
(A) Schematic illustration of the pause mechanism. Addition of a nucleotide that positions RNAP on a pause sequence (blue dot) permits formation of the offline elemental paused state (ePEC), which can...
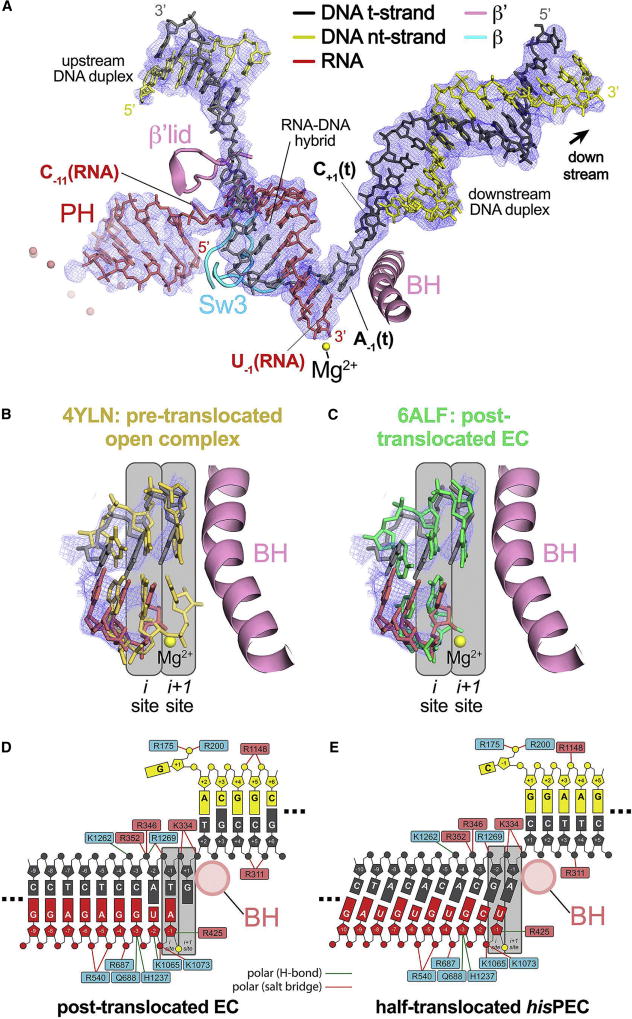
Figure 2
The his PEC is trapped in a half-translocated state unable to load NTP substrate
(A) The 3.8 u00c5 resolution his PEC cryo-EM density map (blue mesh) with the superimposed model of only the his PEC nucleic acids. Shown for reference are key RNAP structural elements (Sw3, lid, BH) ...
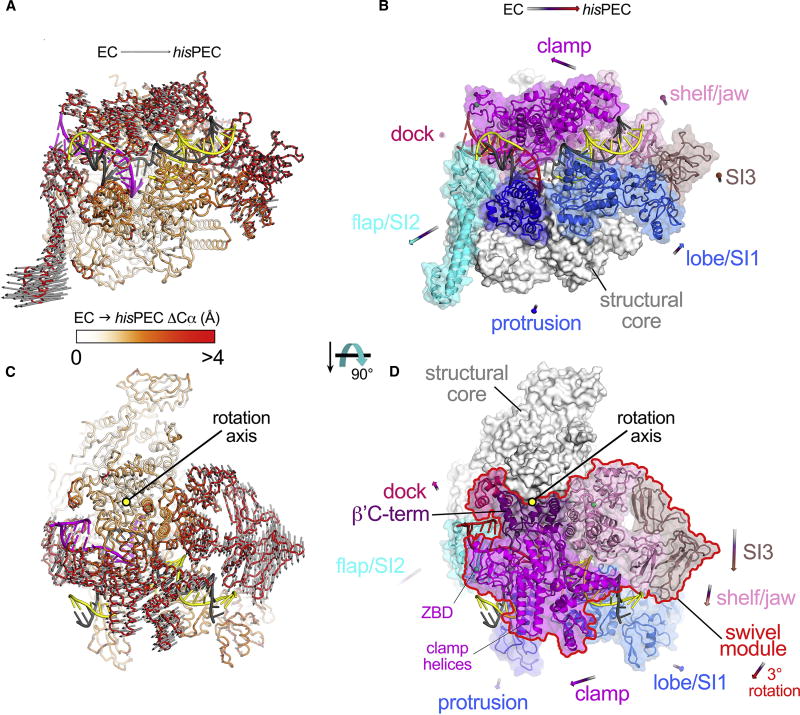
Figure 3
Global RNAP conformational changes: his PEC vs. EC
(A) The his PEC structure is shown as an u03b1-carbon backbone worm. The nucleic acids are shown in cartoon format (t-strand DNA, dark gray; nt-strand DNA, yellow; RNA, magenta). The protein is color-...
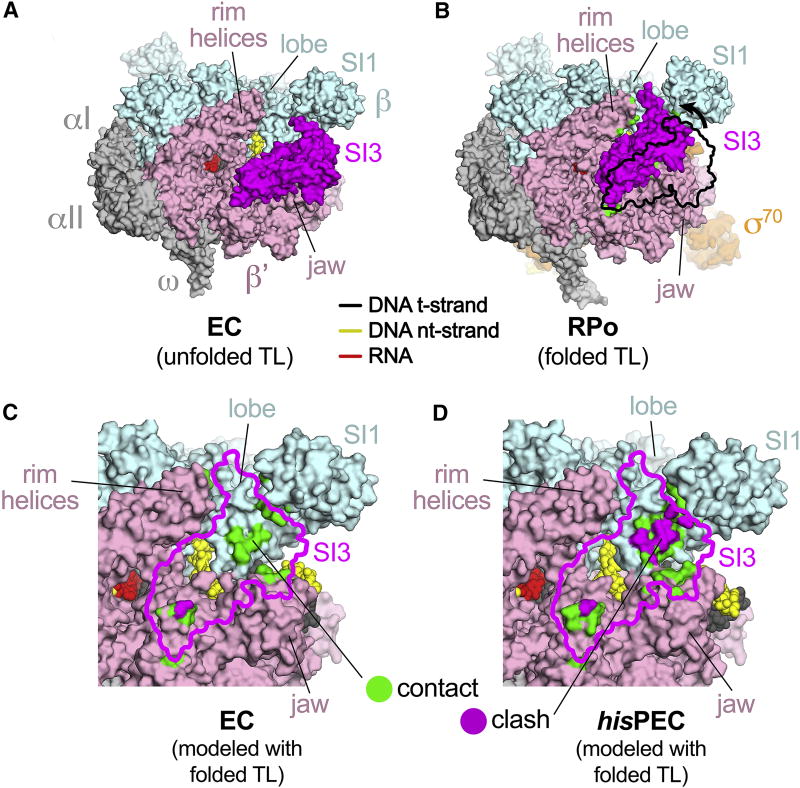
Figure 4
Inhibition of TL folding in the his PEC
(A) The Eco EC structure (6ALF; Kang et al., 2017 ), in which the TL is unfolded, is shown as a molecular surface color-coded as labeled. The nucleic acids are shown in CPK format and color-coded as s...
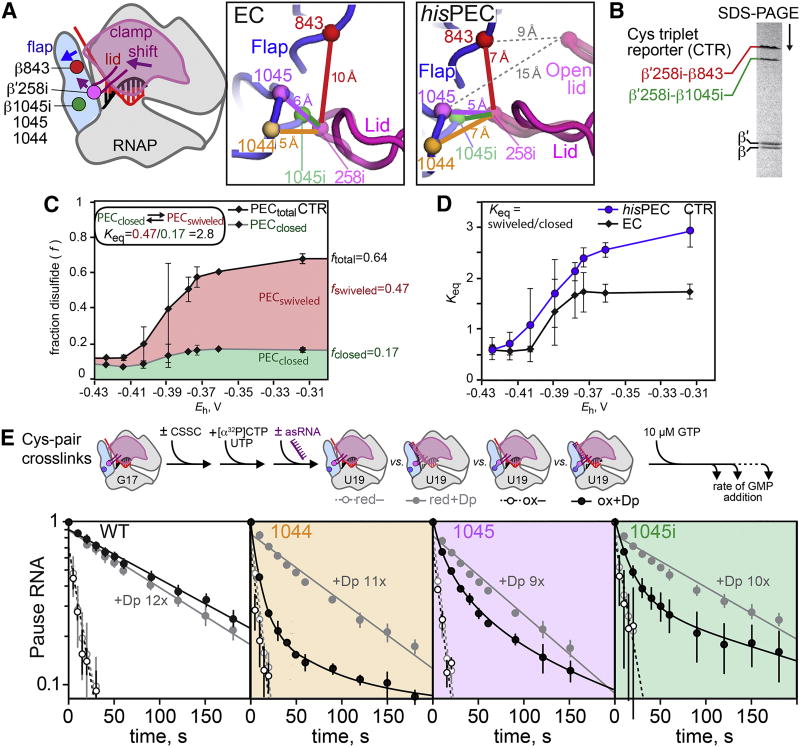
Figure 5
The PH induced modest clamp swiveling to increase pause lifetime
(A) Disulfides used to probe changes in clamp position in the his PEC shown on an EC cartoon, the EC exit channel (6ALF), and the his PEC exit channel (6ASX). A single Cys insertion between u03b2u2032...
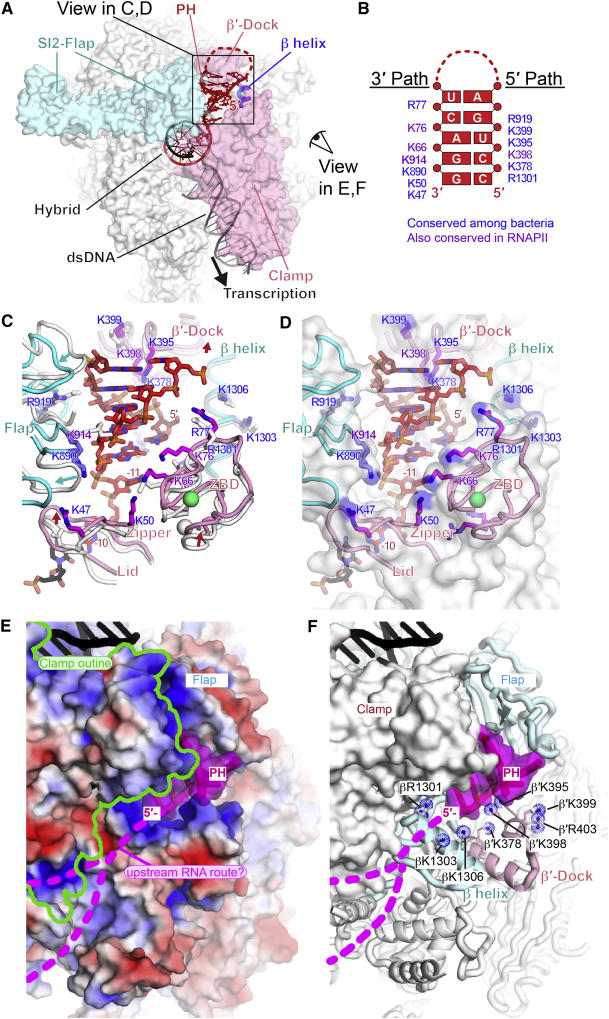
Figure 6
his PH-RNAP exit channel interaction
(A) Interactions of PH in RNA exit channel. Flap, u03b2u2032-dock, u03b2 helix, and clamp cradle the PH. Views in panels C-F are indicated. (B) Map of side chains that form 3u2032 and 5u2032 paths com...
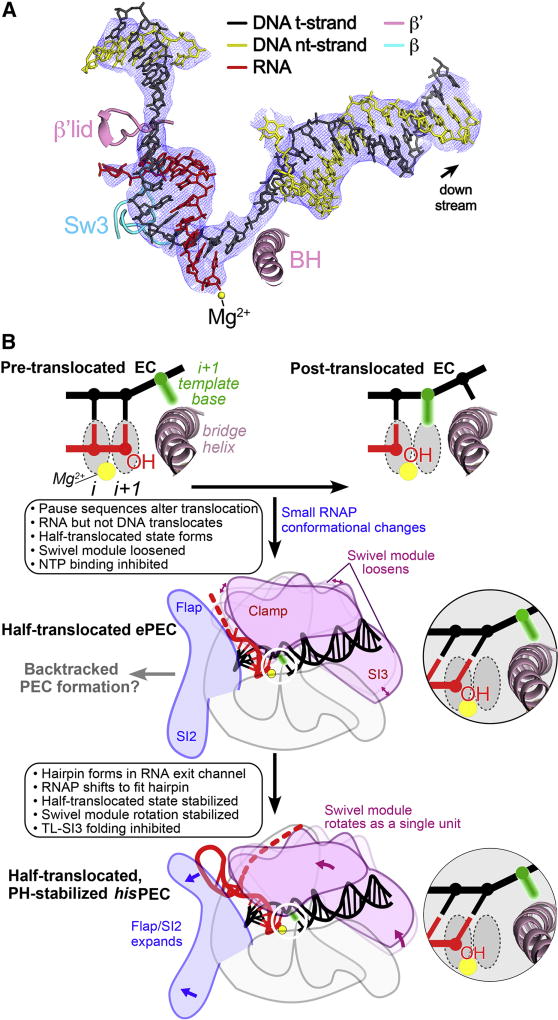
Figure 7
The half-translocated state arises in a PH-minus PEC
(A) Shown is the 5.5 u00c5 resolution (4.3 u00c5 resolution around the active site and RNA-DNA hybrid) cryo-EM density map (blue mesh) with the superimposed model of the his PEC-minus-PH nucleic acids...
Figure images are served from the NIH/NLM PubMed Central Open Access Subset or Europe PMC; copyright remains with the publishers and authors.
💬 Discussion
0 commentsNo comments yet. Be the first to start a discussion!
Leave a Comment