Abstract
AbstractNanoscale correlation of structural information acquisition with specific-molecule identification provides new insight for studying rare subcellular events. To achieve this correlation, scanning electron microscopy has been combined with super-resolution fluorescent microscopy, despite its destructivity when acquiring biological structure information. Here we propose time-efficient non-invasive microsphere-based scanning superlens microscopy that enables the large-area observation of live-cell morphology or sub-membrane structures with sub-diffraction-limited resolution and is demonstrated by observing biological and non-biological objects. This microscopy operates in both non-invasive and contact modes with ∼200 times the acquisition efficiency of atomic force microscopy, which is achieved by replacing the point of an atomic force microscope tip with an imaging area of microspheres and stitching the areas recorded during scanning, enabling sub-diffraction-limited resolution. Our method marks a possible path to non-invasive cell imaging and simultaneous tracking of specific molecules with nanoscale resolution, facilitating the study of subcellular events over a total cell period.
🔬 Techniques
💻 Software
✨ Fluorophores
🧪 Sample Preparation
🔬 Cell Lines
🏭 Microscope Brands
🧪 Reagent Suppliers
💻 Software Details
🏛️ Research Organizations (ROR)
Affiliated research institutions:
📋 Methods
Microsphere-based SSUM system and imaging equipment The BaTiO 3 microspheres (supplied by Cospheric) were attached to the cantilever using an ultraviolet curable glue (NOA63, Edmund Optics) as shown in Fig. 1c,d . Different illumination conditions were achieved by adjusting the two stops in the Köhler illumination system (Thorlabs). A high-speed scientific complementary metal oxide semiconductor camera (PCO. Edge 5.5) was used to record the images. Illumination was provided by an intensity-controllable light source (C-HGFI, Nikon, Japan), and the peak illumination wavelength of the system was set to ∼550 nm by the optical components for white-light imaging. A × 50 objective (Nikon TU Plan EPI ELWD) and a × 100 objective (Nikon LU Plan EPI ELWD) were used in these experiments. A split photodiode (QP50-6-18U-TO8, First Sensor) and a 635 nm circular beam laser diode module (#83-838, Edmund Optics) were applied in the custom AFM system ( Supplementary Fig. 1 ). Polystyrene ( M w =123 kg mol −1 , M w / M n =1.08, from Alfa Aesar) was dissolved in toluene and spin-coated onto the AgNWs that were dispersed onto silicone substrates. The optical beam profiler used to measure the illumination conditions was made by Thorlabs (BP209-VIS). The SEM images were taken using a Zeiss EVO MA10.
Cell culture and imaging Mouse myoblast cells
(C2C12) and human breast cancer cells (MCF-7) were cultured on common Petri dishes in DMEM or RPMI-1640 containing 10% fetal bovine serum and 1% penicillin–streptomycin at 37 °C (5% CO 2 ) in an incubator (Model 371, Thermo Scientific). The solvent used to fix the cells imaged in this study was 4% paraformaldehyde. For fluorescence microscopy of actin cytoskeleton, the cells were treated with Alexa Fluor 488-phalloidin (A12379, Thermo Fisher Scientific) at a concentration of 0.165 μM according to the process recommended by the supplier. A mercury lamp filtered by a fluorescein isothiocyanate (FITC) emission filter (MDF-FITC, Thorlabs) was used to excite fluorescence. The fluorescent imaging by SSUM ( Fig. 6d and Supplementary Figs 7d and 8d ) was conducted before the white-light imaging to prevent fluorescence quenching.
Show full methods section
Microsphere-based SSUM system and imaging equipment The BaTiO 3 microspheres (supplied by Cospheric) were attached to the cantilever using an ultraviolet curable glue (NOA63, Edmund Optics) as shown in Fig. 1c,d . Different illumination conditions were achieved by adjusting the two stops in the Köhler illumination system (Thorlabs). A high-speed scientific complementary metal oxide semiconductor camera (PCO. Edge 5.5) was used to record the images. Illumination was provided by an intensity-controllable light source (C-HGFI, Nikon, Japan), and the peak illumination wavelength of the system was set to ∼550 nm by the optical components for white-light imaging. A × 50 objective (Nikon TU Plan EPI ELWD) and a × 100 objective (Nikon LU Plan EPI ELWD) were used in these experiments. A split photodiode (QP50-6-18U-TO8, First Sensor) and a 635 nm circular beam laser diode module (#83-838, Edmund Optics) were applied in the custom AFM system ( Supplementary Fig. 1 ). Polystyrene ( M w =123 kg mol −1 , M w / M n =1.08, from Alfa Aesar) was dissolved in toluene and spin-coated onto the AgNWs that were dispersed onto silicone substrates. The optical beam profiler used to measure the illumination conditions was made by Thorlabs (BP209-VIS). The SEM images were taken using a Zeiss EVO MA10.
Cell culture and imaging Mouse myoblast cells
(C2C12) and human breast cancer cells (MCF-7) were cultured on common Petri dishes in DMEM or RPMI-1640 containing 10% fetal bovine serum and 1% penicillin–streptomycin at 37 °C (5% CO 2 ) in an incubator (Model 371, Thermo Scientific). The solvent used to fix the cells imaged in this study was 4% paraformaldehyde. For fluorescence microscopy of actin cytoskeleton, the cells were treated with Alexa Fluor 488-phalloidin (A12379, Thermo Fisher Scientific) at a concentration of 0.165 μM according to the process recommended by the supplier. A mercury lamp filtered by a fluorescein isothiocyanate (FITC) emission filter (MDF-FITC, Thorlabs) was used to excite fluorescence. The fluorescent imaging by SSUM ( Fig. 6d and Supplementary Figs 7d and 8d ) was conducted before the white-light imaging to prevent fluorescence quenching.
Imaging with SSUM
The microsphere-attached AFM probe was mounted on a custom holder. After the common adjustment procedure used in AFM, the sample was moved towards the microsphere using a three-dimensional translation stage during which the AFM feedback was acquired to monitor whether the microsphere touched the sample surface and to adjust the distance between the microsphere and sample. As the distance or force reached a set-point value, the optical microscope was driven by a vertical translation stage with nano-scale resolution (IMS100V, Newport) to acquire the microsphere-generated virtual images. The AFM feedback was open or closed in contact or non-invasive mode. In non-invasive mode, Δ z was precisely adjusted by the PZT scanner (P-733.3CL, Physik Instrumente, Germany), and the sample stage was adjusted to be horizontal to decrease the difference in the distance between the microsphere apex and sample stage. The images were recorded by an external signal that triggered a high-speed camera from a controller ( Supplementary Figs 1a and 16a ) during scanning. The recorded area of the camera could be adjusted before scanning to the proper size to satisfy the overlap (15–20% in our experiments) required for image stitching and to be within the area of the FOV of the microsphere superlenses without apparent aberration, which effectively reduces the data processing time and enables rapid image processing during or after scanning. These recorded images could be directly used in the image stitching procedure without preprocessing. A commercial piece of software (Topostitch, Image Metrology) was used to stitch the acquired image tiles of a CPU, a Blu-ray disc, and the cell shown in Fig. 5b,d , whereas the free ImageJ software with the Stitching plugin 49 based on a phase correlation algorithm 50 was used to stitch the cellular images shown in Figs 5f,h and 6b,d according to the procedures shown in Supplementary Fig. 16c–i . These two software platforms took the recorded image tiles as input and the set overlap percentage. A few layout arrangements were provided for selection to arrange the image tiles in trigger-signal order ( Supplementary Fig. 16a ). Several fusion methods are also provided for selection by ImageJ. We mention both of them here to provide more options for different purposes or applications. There were 1,056 ( Figs 2c , 4b and 5d,h ), 561 ( Fig. 6b,d ), 272 ( Fig. 3d ) and 320 ( Supplementary Fig. 5d ) image tiles used in the image stitching processes. The performances of and time consumed by these two software platforms are compared in Supplementary Fig. 16 and Supplementary Table 1 . The quality of the stitched images can be further improved by selective processing using a band-pass filter algorithm or a recursive bilateral filtering algorithm 51 . Analyses of microsphere imaging properties In this study, the imaging conditions were similar to the constant-height scanning mode (that is, the microsphere was attached to a TESP cantilever, which was fixed to maintain the distance between the microsphere and objective, as shown in Fig. 7a ). Initially, the microsphere superlens was in contact with the Blu-ray disc’s surface (that is, Δ z =0 μm) without pre-stress, which can be achieved by monitoring the position-sensitive device signal of the AFM system. Then, the microscope, including the objective driven by a motorized vertical stage, was adjusted to a position where the virtual images generated by the microsphere superlens could be clearly observed. Before scanning, a pre-stress was applied by moving the PZT towards to the objective; this produced an ∼1 μm-deep pre-deformation at the position, where the microsphere was attached. Then, the Blu-ray disc was carried by the PZT scanner away from the microsphere at different illumination conditions ( Fig. 7b,c ). The virtual images generated by microsphere superlens in the vertical scanning processes were recorded using a high-speed camera (inset of Fig. 7a ).
Data availability
The data sets generated during and/or analysed during the current study are available from the corresponding authors on reasonable request.
Supplementary Material Supplementary Information Supplementary Figures, Supplementary Table, Supplementary Notes and Supplementary References. Supplementary Movie 1 Dynamic scanning of a CPU surface by SSUM. Supplementary Movie 2 Dynamic scanning of a skeletal muscle cell (C2C12) by SSUM.
📊 Figures
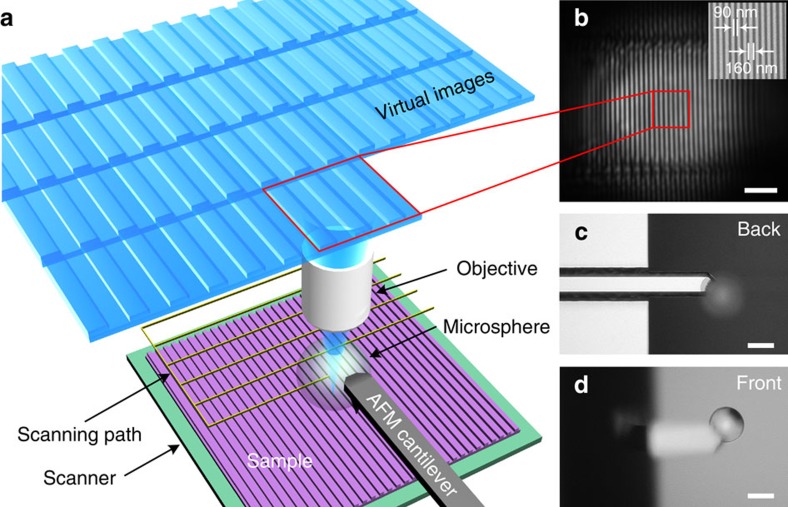
Figure 1
Microsphere-based SSUM.
( a ) Schematic of the construction of a microsphere-based SSUM that integrates a microsphere superlens into an AFM scanning system by attaching the microsphere to an AFM cantilever. The objective pic...
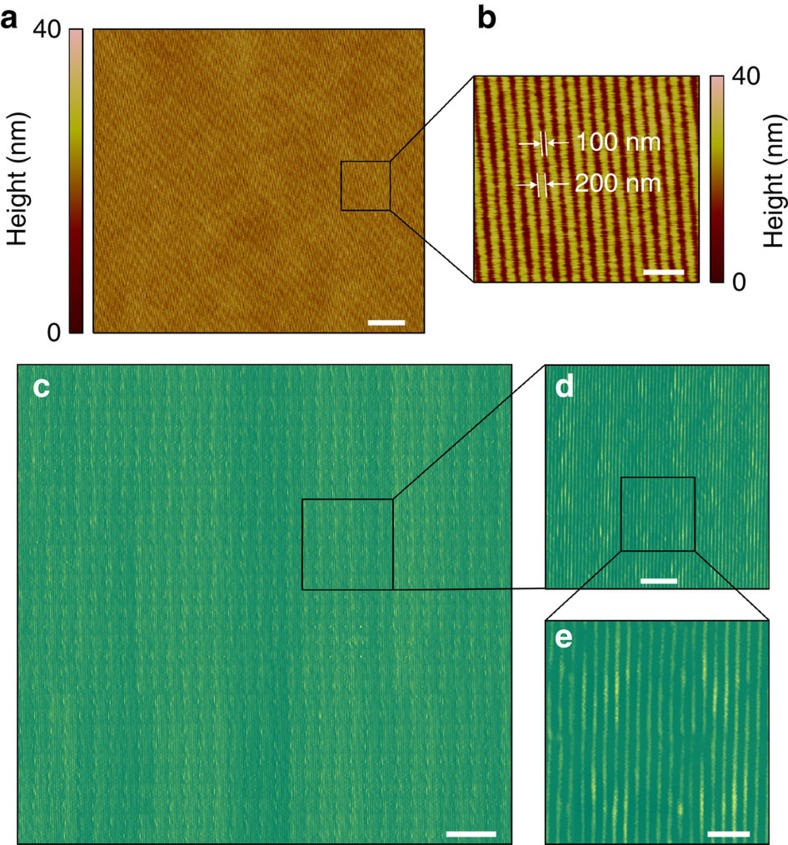
Figure 2
Large-area fast imaging in contact scanning mode.
( a ) AFM scanning image of a Blu-ray disk surface. ( b ) Zoom-in of a . ( c ) Large-area imaging using the SSUM in contact scanning mode. ( d ) Zoom-in of c . ( e ) Zoom-in of d . In this study, a u0...
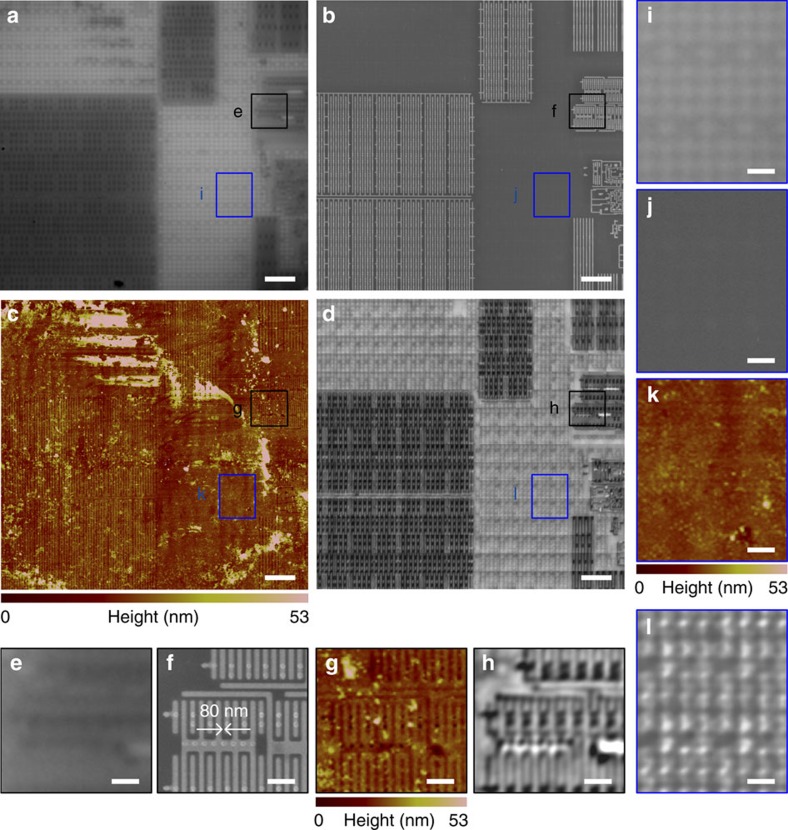
Figure 3
CPU sub-surface structure imaging in constant-height scanning mode.
Comparison of ( a ) a conventional microscope mounted with a u00d7 100 (numerical aperture=0.8) objective, ( b ) SEM, ( c ) AFM and ( d ) the SSUM for the observation of CPU sub-surface structures ben...
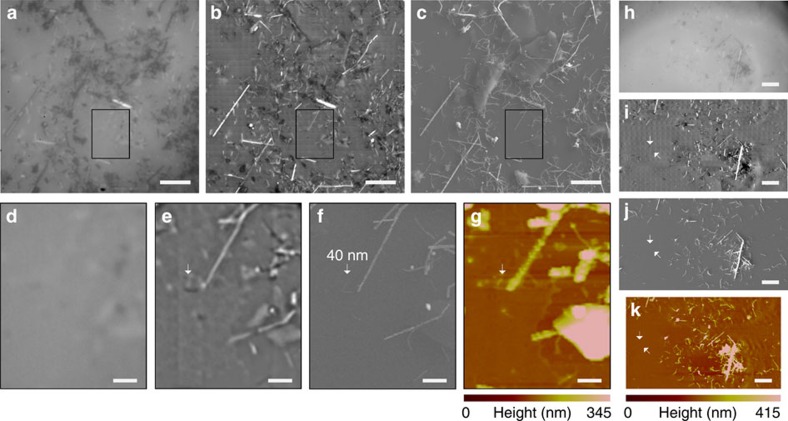
Figure 4
AgNW imaging in constant-height scanning mode.
( a , h ) AgNWs are directly observed using an optical microscope. ( b , i ) AgNWs imaged using a scanning microsphere superlens. A u00d7 100 (numerical aperture=0.8) objective was used in these exper...
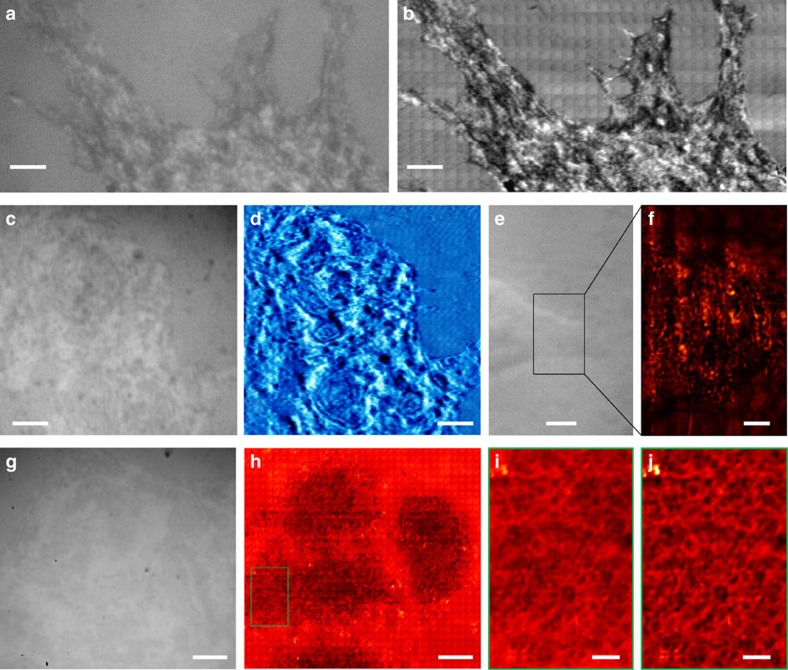
Figure 5
Non-invasive observation of cells in white-light mode.
A C2C12 cell was imaged using ( a ) a traditional optical microscope or ( b ) SSUM. A video recorded while scanning a C2C12 cell is provided as Supplementary Movie 2 . MCF-7 cells were observed ( c , ...
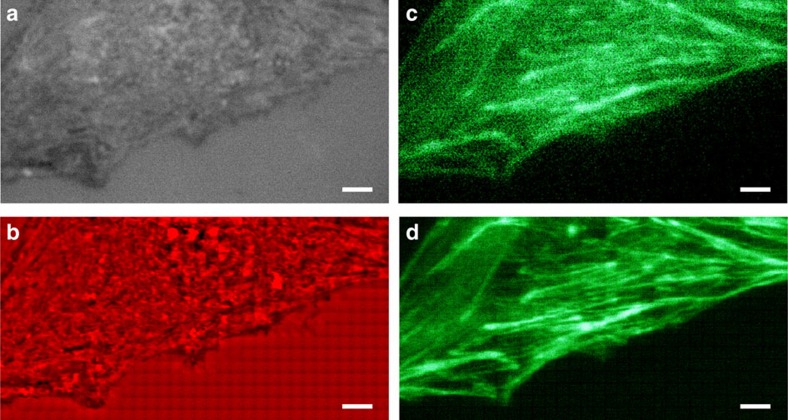
Figure 6
Non-invasive white-light and fluorescence microscopy of a C2C12 cell.
( a , b ) White-light and ( c , d ) fluorescent imaging of a C2C12 cell ( a , c ) without and ( b , d ) with the enhancement of a 56u2009u03bcm-diameter microsphere superlens. A u00d7 100 (numerical a...
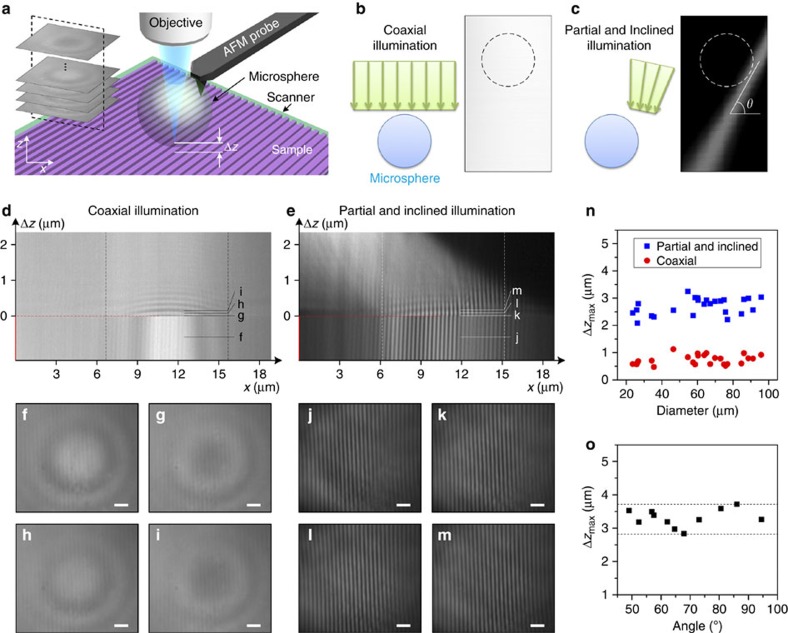
Figure 7
Microsphere imaging properties analyses.
( a ) Schematic showing the experimental set-up used to study the distance (u0394 z ) between the microsphere apex and the samples (Blu-ray disc) on microsphere imaging properties. The inset shows the...
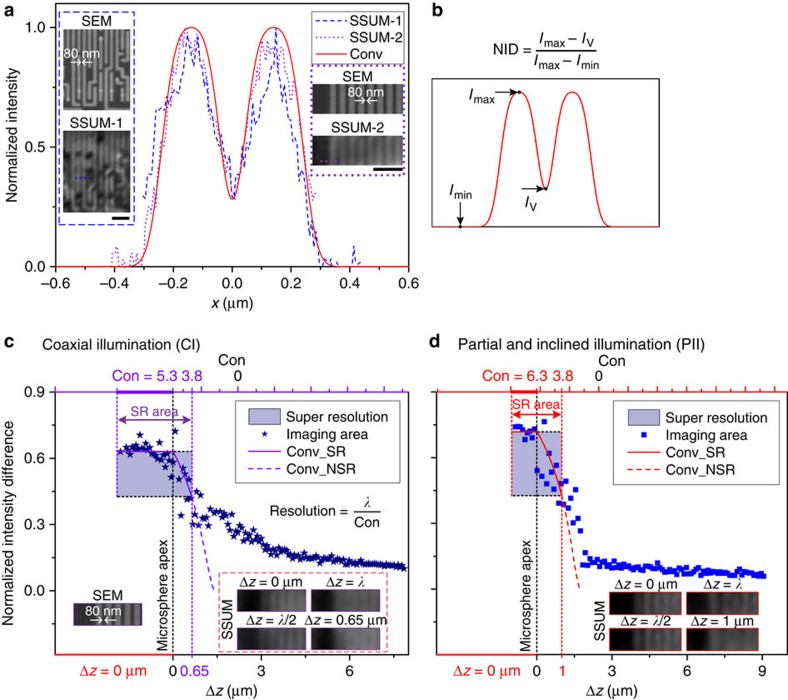
Figure 8
Resolution calibration of SSUM.
( a ) Insets are two sets of SEM images and SSUM results of the structures in the CPU, in which the dashed line (SSUM-1) and dotted line (SSUM-2) are used to estimate the resolution. The solid curve r...
Figure images are served from the NIH/NLM PubMed Central Open Access Subset or Europe PMC; copyright remains with the publishers and authors.
💬 Discussion
0 commentsNo comments yet. Be the first to start a discussion!
Leave a Comment