Abstract
We have investigated sequential exocytosis in beta cells of intact pancreatic islets with the use of two-photon excitation imaging of a polar fluorescent tracer, sulforhodamine B, and a fusion protein comprising enhanced cyan fluorescent protein (ECFP) and the SNARE protein SNAP25 (synaptosome-associated protein of 25 kD) transfected with an adenoviral vector. Sequential exocytosis was found to account for <10% of exocytic events in beta cells stimulated either with glucose under various conditions or by photolysis of a caged-Ca2+ compound. Multigranular exocytosis, in which granule-to-granule fusion occurs before exocytosis, was rarely found. We detected redistribution of ECFP-SNAP25 from the plasma membrane into the membrane of the fused granule occurred in a large proportion (54%) of sequential exocytic events but in only a small fraction (5%) of solitary fusion events. Removal of cholesterol in the plasma membrane by methyl-beta-cyclodextrin facilitated both redistribution of ECFP-SNAP25 and sequential exocytosis by threefold. These observations support the hypothesis that SNAP25 is a plasma membrane factor that is responsible for sequential exocytosis.
🔬 Techniques
💻 Software
✨ Fluorophores
🧪 Sample Preparation
🏭 Microscope Brands
🧪 Reagent Suppliers
💻 Software Details
🏛️ Research Organizations (ROR)
Affiliated research institutions:
📋 Methods
Isolation of mouse pancreatic islets
Pancreatic islets were isolated from 8- to 12-week-old ICR mice by collagenase digestion and were maintained for 1–12 h under a humidified atmosphere of 5% CO 2 at 37°C in DME containing glucose (1.0 mg/ml) and supplemented with 10% FBS, 100 μU/ml penicillin, and 100 mg/ml streptomycin. The islets were transferred with a Pipetman (Gilson) to thin (0.1-mm) glass coverslips (Matsunami-glass) in the recording chamber. The standard external bathing solution (Sol A) contained 150 mM NaCl, 5 mM KCl, 1 mM MgCl 2 , 2 mM CaCl 2 , 10 mM Hepes-NaOH, pH 7.4, and 2.8 mM glucose. Imaging experiments were performed within 20 min after placing an islet in Sol A containing 0.7 mM SRB (Molecular Probes). Forskolin (Sigma-Aldrich) or PMA (Sigma-Aldrich) was initially dissolved in DMSO at 10–50 mM and was subsequently diluted in Sol A. Methyl-β-cyclodextrin (Sigma-Aldrich) was directly dissolved in Sol A.
Two-photon excitation imaging
Two-photon excitation imaging of islets was performed with an inverted microscope (model IX70; Olympus) and a laser-scanning microscope (model FluoView; Olympus) equipped with a water-immersion objective lens (UplanApo60×W/IR; numerical aperture, 1.2). The laser power at the specimen was 3–10 mW, and two-photon excitation was effected at 830 nm, with images acquired every 0.3–2 s. The fluorescence of SRB, of fura-2 and fura-2FF, and of ECFP was measured at 550–650 nm, 400–530 nm, and 400–490 nm, respectively. In ECFP measurement, laser power and photomultiplier voltage were set to 8 W and 500 V, respectively. 12-bit images were color-coded with autumn color codes of FluoView. All experimental procedures were performed under yellow light illumination (FL40S-Y-F; National) to prevent unintended photolysis of the caged-Ca 2+ compound (see the following section). Most experiments were performed at RT (24–25°C), although the temperature of the bathing solution was increased to 33–35°C with a heater (Daia Medical System) in some experiments. Exocytic events were counted in a region of interest (ROI) with an area of 3,000–5,000 μm 2 and were normalized to an area of 2,000 μm 2 . Given that the thickness of the optical section ( T ) in our setup is ∼0.8 μm, the volume of the normalized ROI is 1,600 μm 3 . We expressed the number of events in the normalized ROI as events per cell, given that the volume of individual β cells is ∼1,600 (β cells have a mean diameter of 14.0 μm and constitute 90% of cells in an islet, or one β cell/1,596 μm 3 of an islet). For example, a frequency of 11.2 (or 45) events per cell per minute can also be expressed as 0.018 (or 0.073) events per square micrometer of plasma membrane per minute ( a ). In this example, the mean frequency of events (λ) within 1 min and a distance of
Show full methods section
Isolation of mouse pancreatic islets
Pancreatic islets were isolated from 8- to 12-week-old ICR mice by collagenase digestion and were maintained for 1–12 h under a humidified atmosphere of 5% CO 2 at 37°C in DME containing glucose (1.0 mg/ml) and supplemented with 10% FBS, 100 μU/ml penicillin, and 100 mg/ml streptomycin. The islets were transferred with a Pipetman (Gilson) to thin (0.1-mm) glass coverslips (Matsunami-glass) in the recording chamber. The standard external bathing solution (Sol A) contained 150 mM NaCl, 5 mM KCl, 1 mM MgCl 2 , 2 mM CaCl 2 , 10 mM Hepes-NaOH, pH 7.4, and 2.8 mM glucose. Imaging experiments were performed within 20 min after placing an islet in Sol A containing 0.7 mM SRB (Molecular Probes). Forskolin (Sigma-Aldrich) or PMA (Sigma-Aldrich) was initially dissolved in DMSO at 10–50 mM and was subsequently diluted in Sol A. Methyl-β-cyclodextrin (Sigma-Aldrich) was directly dissolved in Sol A.
Two-photon excitation imaging
Two-photon excitation imaging of islets was performed with an inverted microscope (model IX70; Olympus) and a laser-scanning microscope (model FluoView; Olympus) equipped with a water-immersion objective lens (UplanApo60×W/IR; numerical aperture, 1.2). The laser power at the specimen was 3–10 mW, and two-photon excitation was effected at 830 nm, with images acquired every 0.3–2 s. The fluorescence of SRB, of fura-2 and fura-2FF, and of ECFP was measured at 550–650 nm, 400–530 nm, and 400–490 nm, respectively. In ECFP measurement, laser power and photomultiplier voltage were set to 8 W and 500 V, respectively. 12-bit images were color-coded with autumn color codes of FluoView. All experimental procedures were performed under yellow light illumination (FL40S-Y-F; National) to prevent unintended photolysis of the caged-Ca 2+ compound (see the following section). Most experiments were performed at RT (24–25°C), although the temperature of the bathing solution was increased to 33–35°C with a heater (Daia Medical System) in some experiments. Exocytic events were counted in a region of interest (ROI) with an area of 3,000–5,000 μm 2 and were normalized to an area of 2,000 μm 2 . Given that the thickness of the optical section ( T ) in our setup is ∼0.8 μm, the volume of the normalized ROI is 1,600 μm 3 . We expressed the number of events in the normalized ROI as events per cell, given that the volume of individual β cells is ∼1,600 (β cells have a mean diameter of 14.0 μm and constitute 90% of cells in an islet, or one β cell/1,596 μm 3 of an islet). For example, a frequency of 11.2 (or 45) events per cell per minute can also be expressed as 0.018 (or 0.073) events per square micrometer of plasma membrane per minute ( a ). In this example, the mean frequency of events (λ) within 1 min and a distance of
📊 Figures
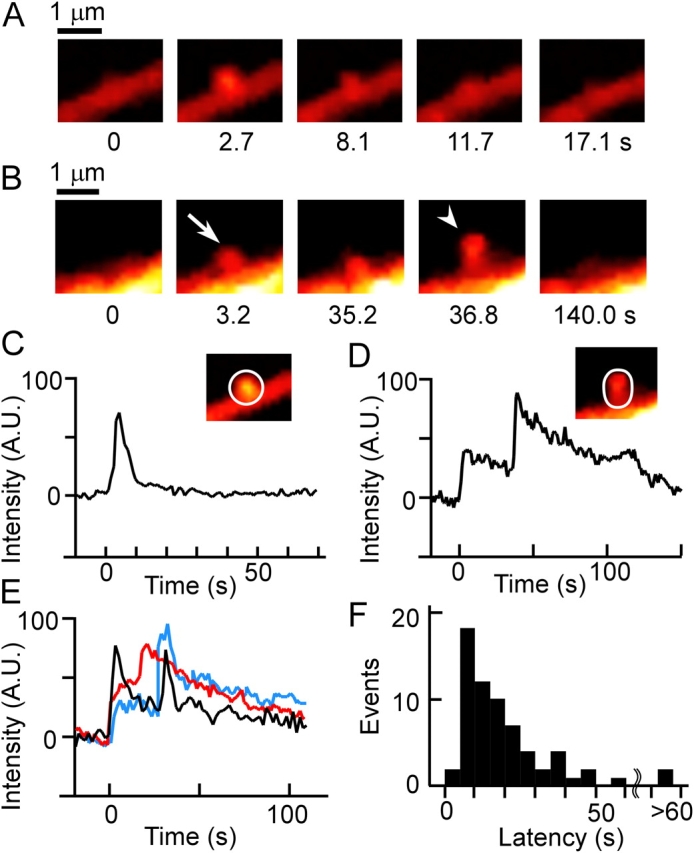
Figure 1.
Insulin exocytic events revealed by two-photon excitation imaging in mouse pancreatic islets. Islets were superfused with a solution containing 0.7 mM SRB and were stimulated by exposure to 20 mM gluc...
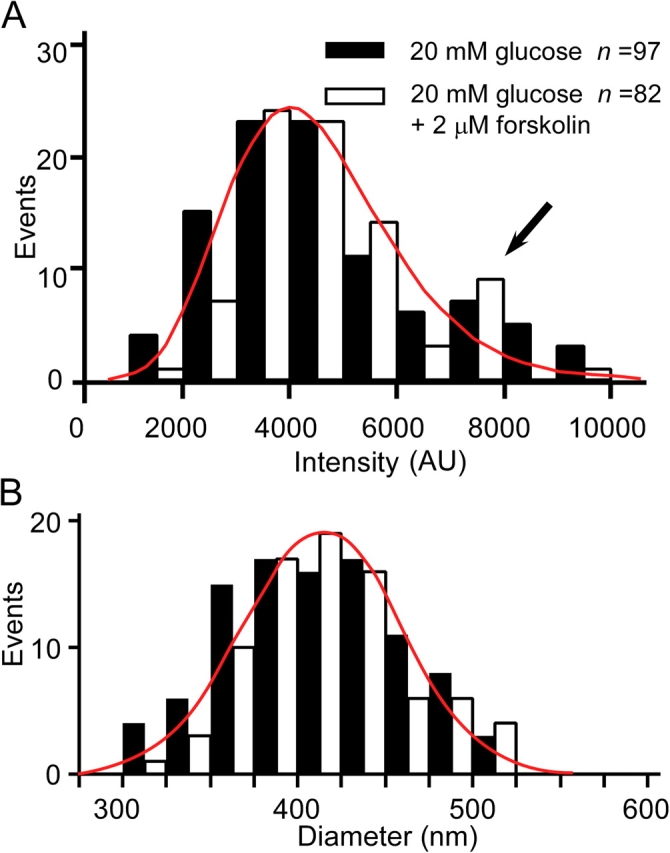
Figure 2.
Distributions of the fluorescence intensity of individual exocytic events and of the diameter of exocytosed granules. (A) Distributions of the increase in fluorescence intensity associated with indivi...
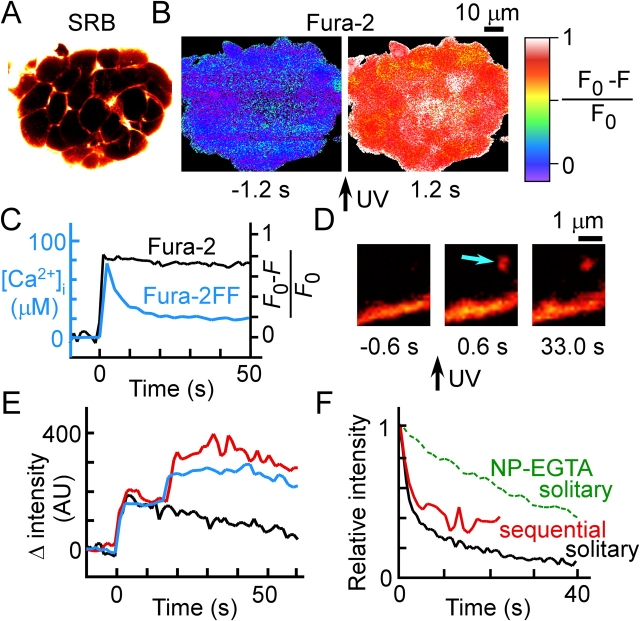
Figure 3.
Exocytic events triggered by photolysis of a caged-Ca 2 + compound. (A) SRB fluorescence image of an islet that had been preloaded with NP-EGTA and fura-2. (B) Fura-2 (Ca 2+ ) images obtained 1.2 s be...
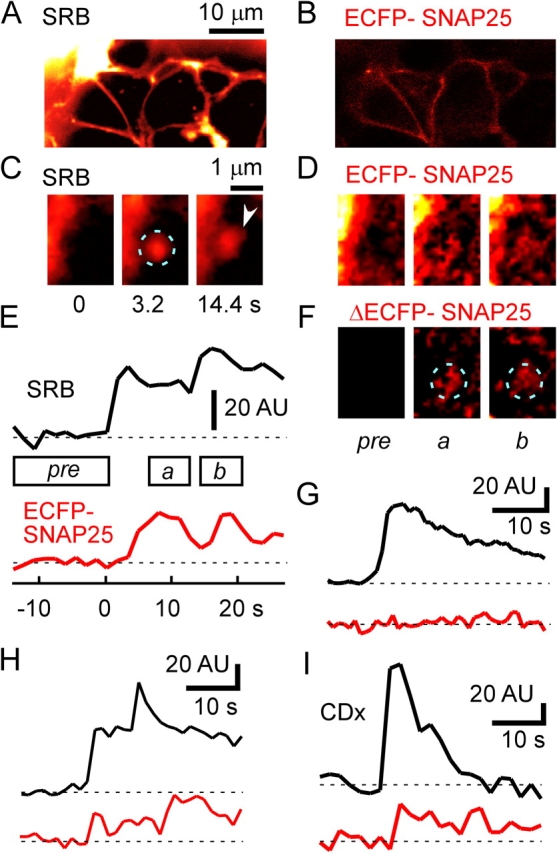
Figure 4.
Redistribution of SNAP25 during sequential exocytosis. SRB (A) and ECFP-SNAP25 (B) fluorescence images of an islet. The islet was transfected with an adenoviral vector encoding ECFP-SNAP25 and immerse...
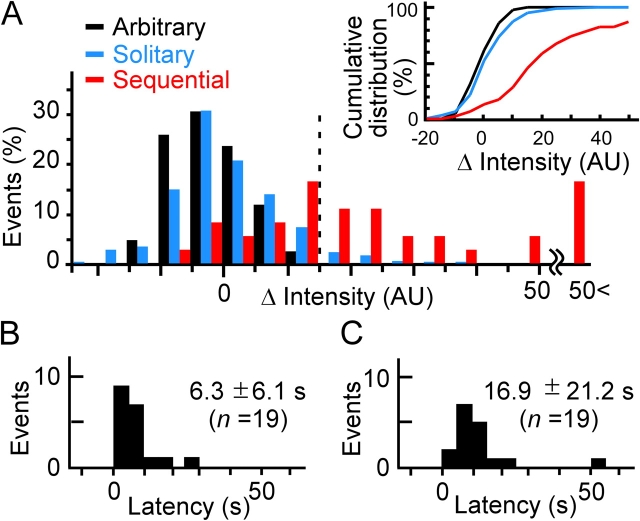
Figure 5.
Amplitudes and latencies of the redistribution of ECFP-SNAP25. (A) Histograms for the maximal increase in fluorescence intensity of ECFP-SNAP25 between 5 and 20 s after primary exocytosis for solitary...
Figure images are served from the NIH/NLM PubMed Central Open Access Subset or Europe PMC; copyright remains with the publishers and authors.
💬 Discussion
0 commentsNo comments yet. Be the first to start a discussion!
Leave a Comment