Abstract
Abstract Although we understand how serotonin receptors function at the single-cell level, what role different serotonin receptors play in regulating brain-wide activity and, in turn, human behavior, remains unknown. Here, we developed transcriptomic–neuroimaging mapping to characterize brain-wide functional signatures associated with specific serotonin receptors: serotonin receptor networks (SRNs). Probing SRNs with optogenetics–functional magnetic resonance imaging (MRI) and pharmacology in mice, we show that activation of dorsal raphe serotonin neurons differentially modulates the amplitude and functional connectivity of different SRNs, showing that receptors’ spatial distributions can confer specificity not only at the local, but also at the brain-wide, network level. In humans, using resting-state functional MRI, SRNs replicate established divisions of serotonin effects on impulsivity and negative biases. These results provide compelling evidence that heterogeneous brain-wide distributions of different serotonin receptor types may underpin behaviorally distinct modes of serotonin regulation. This suggests that serotonin neurons may regulate multiple aspects of human behavior via modulation of large-scale receptor networks.
🔬 Techniques
💻 Software
✨ Fluorophores
🧪 Sample Preparation
🏭 Microscope Brands
💻 Software Details
💻 Code & Software
💾 Data Repositories
🏛️ Research Organizations (ROR)
Affiliated research institutions:
📋 Methods
Mouse neuroimaging Concurrent ofMRI of DRN serotonin neurons in mice
We used concurrent cerebral blood volume ofMRI data previously published by Grandjean et al. 29 . All experiments and manipulations conformed to the guidelines set by the Animal Care Commission of Switzerland and were covered under the authority of animal permit ZH150/11 given to Isabelle M. Mansuy and ZH263/14 belonging to Bechara J. Saab and in accordance with the UK Animals (Scientific Procedures) Act 1986. We used data from the experiments with ofMRI manipulation of ePet-Cre mice expressing ChR2 in DRN serotonin neurons ( n = 8, runs = 63), controls expressing eYFP only ( n = 4, runs = 18) and those ePet-Cre mice treated with fluoxetine before ofMRI ( n = 6, runs = 18). MRI acquisition, data preprocessing and all surgical procedures are described in detail 29 . Briefly, the light-sensitive ion channel ChR2 was expressed in DRN Pet-1 serotonin neurons using a cre-dependent adeno-associated virus (AAV-EF1a-DIO-ChR2-EYFP) injected into the DRN of ePet-cre +/− mice. Light was delivered through an MRI-compatible optical fiber, implanted in the DRN (medial lateral = 0, anterior posterior = −0.6 mm from Lambda, dorsal ventral = 3.3 mm from the skull), 1–2 weeks post viral infection and at least 1 week before ofMRI. As controls, ePet-cre +/− mice underwent the same procedures except that they received a virus lacking ChR2 (AAV-EF1A-DIO-EYFP). fMRI was performed in a 7 T Bruker scanner equipped with a surface coil in mice anesthetized with a mixture of isoflurane (0.5%) and medetomidine (0.1 mg kg −1 bolus followed by a constant infusion of 0.2 mg kg −1 h −1 subcutaneously). Mice were also injected with a paramagnetic iron oxide nanoparticle-based intravascular contrast agent (Endorem, 30 mg kg −1 Fe). Each fMRI run consisted of six cycles of 20 s of blue light stimulation at 20 Hz (pulse width = 5 ms, laser power = 40 mW mm 2 ) followed by 40 s of rest. Functional images were acquired with a spatial resolution of 0.31 × 0.27 × 0.5 mm 3 and a temporal resolution of 2 s using a multi-shot gradient echo echo-planar imaging sequence. Data preprocessing was performed using FSL and Analysis of Functional NeuroImages. Anatomical images from each scan session were used to generate a reference template. Linear and non-linear transformations were then estimated between the anatomical images and the reference template. Functional images were temporally realigned, transformed to match the reference template and smoothed using a 0.45-mm 2 kernel. Time-series were summarized using the Allen Brain Atlas as in ref. 29 and sign inverted. The Allen Institute for Brain Science mouse brain atlas was resampled to 90 regions of interest (ROIs) by merging leaves (for example, cortical layers) by branches (for example, cortical area). The nomenclature, and abbreviations for the brain regions, are in accordance with https://atlas.brain-map.org/ .
Show full methods section
Mouse neuroimaging Concurrent ofMRI of DRN serotonin neurons in mice
We used concurrent cerebral blood volume ofMRI data previously published by Grandjean et al. 29 . All experiments and manipulations conformed to the guidelines set by the Animal Care Commission of Switzerland and were covered under the authority of animal permit ZH150/11 given to Isabelle M. Mansuy and ZH263/14 belonging to Bechara J. Saab and in accordance with the UK Animals (Scientific Procedures) Act 1986. We used data from the experiments with ofMRI manipulation of ePet-Cre mice expressing ChR2 in DRN serotonin neurons ( n = 8, runs = 63), controls expressing eYFP only ( n = 4, runs = 18) and those ePet-Cre mice treated with fluoxetine before ofMRI ( n = 6, runs = 18). MRI acquisition, data preprocessing and all surgical procedures are described in detail 29 . Briefly, the light-sensitive ion channel ChR2 was expressed in DRN Pet-1 serotonin neurons using a cre-dependent adeno-associated virus (AAV-EF1a-DIO-ChR2-EYFP) injected into the DRN of ePet-cre +/− mice. Light was delivered through an MRI-compatible optical fiber, implanted in the DRN (medial lateral = 0, anterior posterior = −0.6 mm from Lambda, dorsal ventral = 3.3 mm from the skull), 1–2 weeks post viral infection and at least 1 week before ofMRI. As controls, ePet-cre +/− mice underwent the same procedures except that they received a virus lacking ChR2 (AAV-EF1A-DIO-EYFP). fMRI was performed in a 7 T Bruker scanner equipped with a surface coil in mice anesthetized with a mixture of isoflurane (0.5%) and medetomidine (0.1 mg kg −1 bolus followed by a constant infusion of 0.2 mg kg −1 h −1 subcutaneously). Mice were also injected with a paramagnetic iron oxide nanoparticle-based intravascular contrast agent (Endorem, 30 mg kg −1 Fe). Each fMRI run consisted of six cycles of 20 s of blue light stimulation at 20 Hz (pulse width = 5 ms, laser power = 40 mW mm 2 ) followed by 40 s of rest. Functional images were acquired with a spatial resolution of 0.31 × 0.27 × 0.5 mm 3 and a temporal resolution of 2 s using a multi-shot gradient echo echo-planar imaging sequence. Data preprocessing was performed using FSL and Analysis of Functional NeuroImages. Anatomical images from each scan session were used to generate a reference template. Linear and non-linear transformations were then estimated between the anatomical images and the reference template. Functional images were temporally realigned, transformed to match the reference template and smoothed using a 0.45-mm 2 kernel. Time-series were summarized using the Allen Brain Atlas as in ref. 29 and sign inverted. The Allen Institute for Brain Science mouse brain atlas was resampled to 90 regions of interest (ROIs) by merging leaves (for example, cortical layers) by branches (for example, cortical area). The nomenclature, and abbreviations for the brain regions, are in accordance with https://atlas.brain-map.org/ .
Transcriptomic–neuroimaging mapping in mice
We used mouse brain-wide gene expression maps of serotonin receptor genes publicly available from the Allen Brain Institute 25 , 26 . Gene maps were summarized using the Allen Mouse Brain Atlas as ref. 29 . Most transcriptomic maps of serotonin receptor genes were available in coronal sections with expression levels across the whole brain ( Htr1a , Htr1b , Htr2c , Htr3a , Htr3b , Htr5b ). Those that were available in sagittal sections with expression levels for one single hemisphere ( Htr1f , Htr2a , Htr4 ) were thus flipped along the x axis and made symmetric. Each serotonin receptor gene map ( Htr1-5 ), representing the raw expression level for each gene across the whole brain, was then log 2 -transformed and Z -scored across brain regions. Then we used FSL DR (a multiple linear regression method; https://fsl.fmrib.ox.ac.uk/fsl/fslwiki/DualRegression ) 27 to combine serotonin receptor gene maps together with individual ofMRI data. Time-courses from DR-stage 1 were standardized before DR-stage 2 (ref. 27 ). This transcriptomic–neuroimaging approach allows to characterize (1) a time-course representing the network amplitude changes in fMRI activity (DR-stage 1), and (2) a functional connectivity map (DR-stage 2), for each animal, for each serotonin receptor gene. We refer to these signatures as SRNs. A graphical representation of this approach can be found in Fig. 1 . To correct SRN amplitude changes to optogenetic stimulation for baseline differences, we subtracted the average SRN activation during the 40 ofMRI volumes before the first stimulation block from the remaining SRN amplitude time-courses (Extended Data Fig. 2a ). We opted for this baseline instead of all the ‘resting’ periods during the stimulation blocks as the elicited SRN amplitude changes are long-lasting way beyond the stimulation phase.
Statistics and reproducibility Permutation inference testing via general linear models
All inference testing on ofMRI DR-stage 1 and stage 2 outputs (network amplitude changes and functional connectivity maps) was carried out using FSL Permutation Analysis of Linear Models (PALM v.119, https://fsl.fmrib.ox.ac.uk/fsl/fslwiki/PALM 61 ). The null distribution was characterized with 1,000 permutations. Statistical significance was established based on family-wise error rate correction (FWE-corr) of P values. When testing inferences on SRN temporal responses to optogenetic stimulation (DR-stage 1) (that is, group comparisons: ChR2 versus control animals), one-dimensional (time) threshold-free cluster enhancement was applied 62 . P values underwent FWE-corr across time, network testing (SRNs) and two-tails inference (‘greater/smaller amplitude change than’). When testing inferences on brain region functional connectivity changes to optogenetic stimulation (DR-stage 2), no cluster enhancement was applied. P values underwent FWE-corr across atlas ROIs, network testing (SRNs) and two-tails inference (‘greater/smaller functional connectivity than’). When testing the effect of fluoxetine, because of the within-subject design, we constrained the permutations to be block-aware, thus allowing permutations only within the same subject across conditions 63 . All statistical significance results are plotted as −log 10 of FWE-corr P and results were deemed significant at FWE-corr P < 0.05. All statistical analyses were carried out in MATLAB 2020. The results of these analyses are shown in Figs. 2 and 3 and Extended Data Figs. 2 and 3 . Specificity to serotonin receptors in response to DRN ofMRI We further established the specificity of the transcriptomic–neuroimaging mapping approach to the serotonin receptors alone. To do this, we characterized SRN fluctuations (DR-stage 1) in response to DRN ofMRI after adjusting for 25 non-serotonin receptor maps belonging to other neurochemical modulators: acetylcholine, 16 Chr genes; dopamine, 4 Drd genes; and noradrenaline, 5 Adr genes. We performed DR-stage 1 whilst accounting for 25 non-serotonin receptors. We refer to this approach as residualized DR-stage 1. This approach allows us to establish the ofMRI fluctuations in serotonin receptors after adjusting for the spatial variance of non-serotonin receptors. In other words, residualized DR-stage 1 shows the ofMRI fluctuations that are unique to each serotonin receptor. The same approach was then applied to the other neurotransmitter receptor maps. These analyses were carried out in MATLAB 2020. The results of these analyses are shown in Extended Data Fig. 2 . To further establish specificity, we also replicated the approach previously implemented by Zerbi et al. 31 . Spearman’s partial correlation was used to relate neurotransmitter receptor maps to DRN ofMRI changes (ChR2 group versus controls). To explicitly assess specificity, receptors belonging to a different neuromodulator family were used as covariates of no interest in different partial correlation analyses. As for Zerbi and colleagues, contributions from receptors within the same neuromodulator families were not regressed out because of their strong intrinsic co-expression. Two-tailed significance was assessed with permutation testing and partial correlations were deemed significant at FWE-corr P < 0.025. These analyses were carried out in MATLAB 2020. The results of these analyses are shown in Extended Data Fig. 2 .
Human neuroimaging rs-fMRI in the HCP
We used resting-state BOLD fMRI data from n = 812 subjects from the HCP, which provides the required ethics and consent needed for study and dissemination, such that no further additional institutional review board approval is required. These are all subjects with complete rs-fMRI data, all healthy adults (aged 22–35 yr, 410 females) scanned on a 3-T Siemens Connectome Skyra. For each subject, four 15-min runs of fMRI time-series data with a temporal resolution of 0.73 s and a spatial resolution of 2-mm isotropic were available. The preprocessing pipeline followed the technique in refs. 64 , 65 , and thus will be described only briefly here. Spatial preprocessing was applied using the procedure described in ref. 66 . We applied structured artefact removal using independent component analysis (ICA) followed by FMRIB’s ICA-based X-noisefier (FIX) from the FSL 67 , which removed more than 99% of the artefactual ICA components in the dataset. We did not use global signal regression. This resulted in 812 subjects, each having 4 rs-fMRI runs of 1,200 time points. Transcriptomic–neuroimaging mapping in humans We used serotonin receptor gene brain maps from the Allen Human Brain Atlas (AHBA) ( Htr1-7 (ref. 26 )). The microarray datasets were processed as described in ref. 68 . Specifically, microarray probes from each of the six donors in the AHBA were initially filtered to retain probes with existing Entrez Gene IDs. The remaining probes were subsequently filtered using the AHBA intensity-based filtering binary indicators, such that the probes for which fewer than 50% of the samples passed the filter were discarded. For every donor, the expression values of multiple probes were then averaged when those probes corresponded to the same gene. These averages were computed in linear space, and the aggregated values were subsequently transformed back to log space using a log 2 transformation. The resulting gene-by-sample expression matrices were annotated such that the samples were mapped to the structure labels of an atlas parcellation. The atlas labels were assigned to samples on the basis of minimal Euclidean distance in Montreal Neurological Institute coordinate space. To do so, we used an atlas containing 152 cortical and subcortical regions, which was generated by merging the Automated Anatomical Labeling (AAL) cortical atlas 69 with the five-atlas subcortical 70 , cerebellum 71 , thalamus and striatum 72 , hippocampus subfields 73 and amygdala 74 atlases from CoBrALab. The expression of every gene was then averaged over multiple samples with common atlas labels. This was done in linear space before converting back to log space with a log 2 transformation. Finally, the structure-wise gene expression values were averaged across the two donors in the AHBA that have bilateral sampling (H0351.2001, H0351.2002), resulting in the final gene-by-region expression matrix. For each of the 812 subjects, separately for each of the four rs-fMRI runs, FSL DR (with variance normalization) was then used to combine (rank-based inverse normalized) brain maps of serotonin receptor genes ( HTR1A , HTR1E , HTR1F , HTR2A , HTR2C , HTR3B , HTR4 , HTR5A , HTR7 ) with rs-fMRI data at the voxel-wise level. (Serotonin receptor genes for the human brain are indicated in capital letters to distinguish from those of the mouse brain.) SRN functional connectivity maps were estimated separately for each rs-fMRI dataset and then averaged across the four runs for each subject, resulting in a single functional connectivity map per SRN per subject. Group-average un-threshold SRN maps are made publicly available in NeuroVault. Although SRN functional connectivity maps are at the voxel-wise level (Fig. 4a ), to ease the subsequent statistical analysis, for each SRN we summarized functional connectivity values based on the modified AAL atlas described above. This resulted in a subject × atlas ROIs × SRNs matrix (812 subjects × 152 ROIs × 9 SRNs) which we fed to the following statistical analysis. Behavioral measures in the HCP We used the restricted behavioral data as provided by the HCP consortium in the CCA. These variables represent a summary of demographic measures present in the HCP sample (full detailed description can be found in ref. 75 ). We then selected a subset of these variables to anchor the results of the brain–behavior covariation analysis and thus to ease results interpretation. These are human mental functions previously implicated in serotonin regulation: delayed reward discounting, affect, personality traits and social behavior (Supplementary Table 1 ).
Statistics and reproducibility Permutation inference testing via CCA
To avoid an overdetermined, rank-deficient CCA solution, and to limit the chances of overfitting, a dimensionality reduction step was performed for both brain imaging and behavioral variables. Using the same approach previously applied in ref. 76 , brain images (SRNs) were reduced using principal component analysis (PCA) into 20 principal components (using the ‘elbow’ rule; variance explained > 60%). To study whether multiple modes of brain–behavior covariation exist, we used CCA as implemented in ref. 77 ( https://github.com/andersonwinkler/PermCCA ). This allowed us to test whether sets of SRNs were significantly related to behavioral phenotypes. Canonical correlations were estimated in a stepwise manner, removing at each iteration the variance already explained by previous modes of population covariation, while dealing with different numbers of variables in both sides. Importantly, this implementation of CCA also performs residualization of confounds of no interest without introducing dependencies among the observations, which would violate the exchangeability assumption 77 . Here, imaging (20 variables) and behavioral (45 variables) measures were adjusted for 17 confounding variables as previously performed by Smith and colleagues 1 ((1) acquisition reconstruction software version; (2) average subject head motion during rs-fMRI; (3) weight; (4) height; (5) systolic and (6) diastolic blood pressure; (7) hemoglobin A 1C ; (8) cube-root of total brain volume; (9) cube-root of total intracranial volume, as well as the squared version of measures 2–9 (the first is binary)). Literature shows that CCA results tend to be stable with a large number of subjects in relation to the number of variables 78 . Statistical significance was tested with 10,000 block-aware permutations respecting HCP family-structure 63 and FWE-corr was applied across all CCA modes. CCA imaging and behavioral cross-loadings were then extracted for all CCA modes deemed significant at FWE-corr P < 0.05. The results of these analyses are shown in Fig. 4 . CCA imaging cross-loadings were calculated for all brain regions and all SRNs (Extended Data Fig. 4a )—these were not estimated at the voxel-wise level to preserve the spatial resolution used for statistical analysis. This resulted in two matrices of CCA cross-loadings, one per significant CCA mode, each with a dimension of 152 brain regions by 9 SRNs. To explain the maximum amount of variance, PCAs (with only one single principal component) were performed separately for each of these matrices. Whilst PCA coefficients represent the involvement of each SRN in the mode of covariation (Extended Data Fig. 4b ), PCA scores capture the brain correlate (Fig. 4c (thresholded) and Extended Data Fig. 4c (unthresholded)) associated with the CCA imaging cross-loadings across SRNs. CCA behavioral cross-loadings were calculated for all 45 non-imaging measures (Fig. 4e (showing only cognitive and affective variables) and Extended Data Fig. 4c (showing all variables)). For those variables with high CCA cross-loadings, boxplots of raw scores are shown in Fig. 4f . Separately for each CCA mode, subjects were ranked based on the CCA subject score. Subjects were then divided into a ‘high scoring’ and a ‘low scoring’ group based on the 50th percentile. Boxplots were created using the function daboxplot for MATLAB ( https://github.com/frank-pk/DataViz ). Reporting summary Further information on research design is available in the Nature Portfolio Reporting Summary linked to this article.
Online content Any methods, additional references, Nature Portfolio reporting summaries, source data, extended data, supplementary information, acknowledgements, peer review information; details of author contributions and competing interests; and statements of data and code availability are available at 10.1038/s41593-022-01213-3.
Supplementary information Supplementary Information Supplementary Table 1. Reporting Summary
Supplementary information The online version contains supplementary material available at 10.1038/s41593-022-01213-3.
📊 Figures
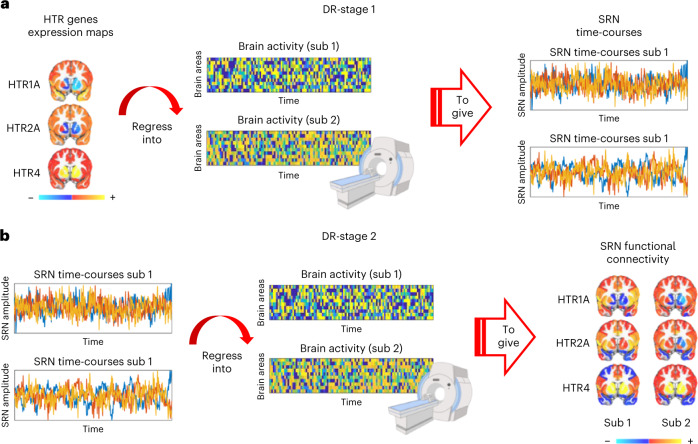
Fig. 1
Mapping functional signatures of brain-wide SRNs.
Gene expression brain maps of serotonin receptor genes are combined with fMRI (both mouse and human) via FSL DR to map temporal and spatial fMRI signatures of different serotonin receptor types. a , D...
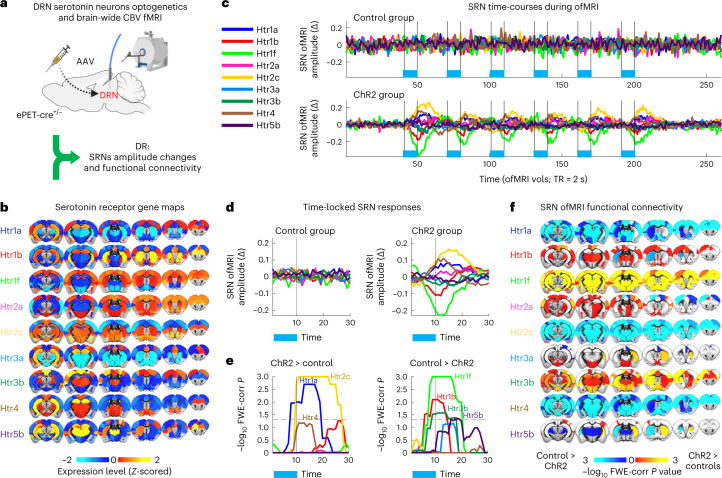
Fig. 2
Activity of DRN serotonin neurons modulates SRNs.
a , Mice were genetically manipulated to express ChR2 in DRN serotonin neurons before ofMRI experiments 29 . b , Transcriptomic maps of serotonin receptor genes from the Allen Brain Institute. The com...
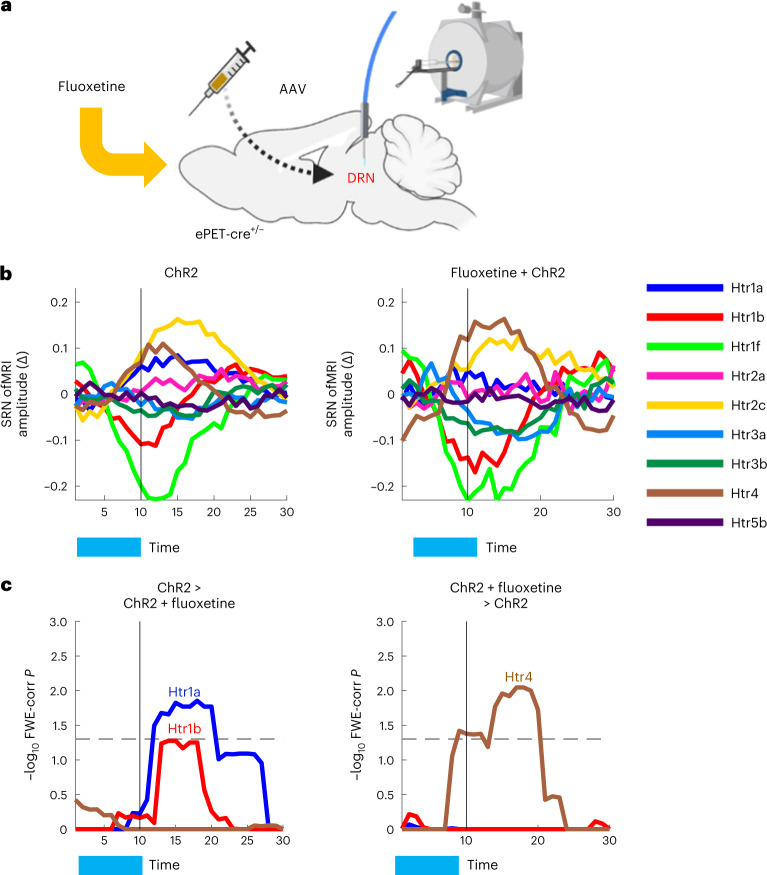
Fig. 3
Fluoxetine manipulation alters neuromodulation in predicted SRNs.
a , ChR2 animals were treated with one pharmacologically significant dose of fluoxetine and then underwent ofMRI. b , Time-locked ofMRI amplitude changes of SRNs in ChR2 animals (left) and in ChR2 ani...
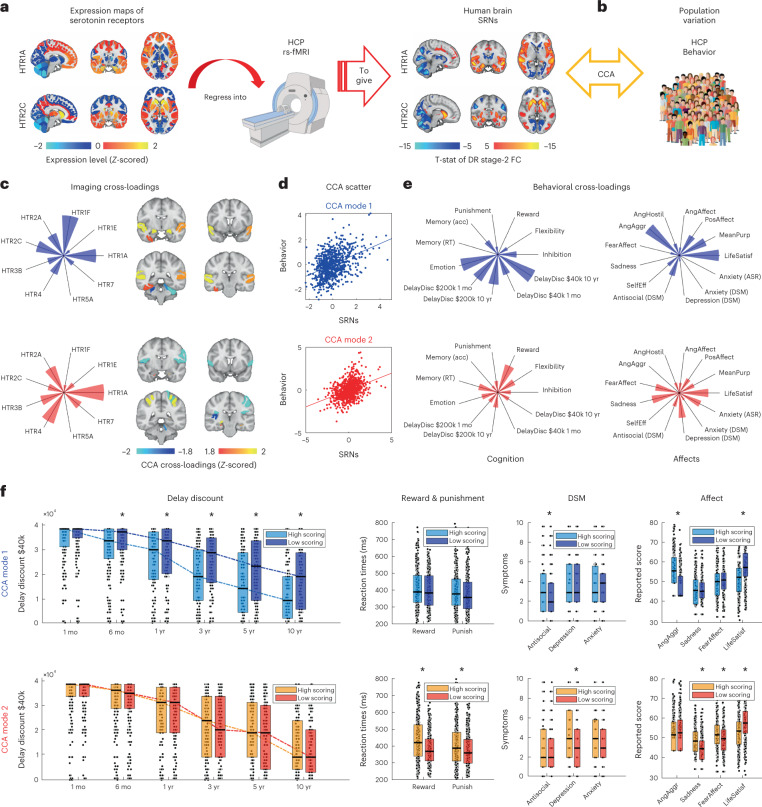
Fig. 4
Human mental processes are organized into independent modes of SRN modulation.
a , FSL DR approach to derive SRNs in the HCP dataset. b , Individual differences in SRNs were tested for covariation with behaviors via CCA. Permutation inference CCA characterized two statistically ...
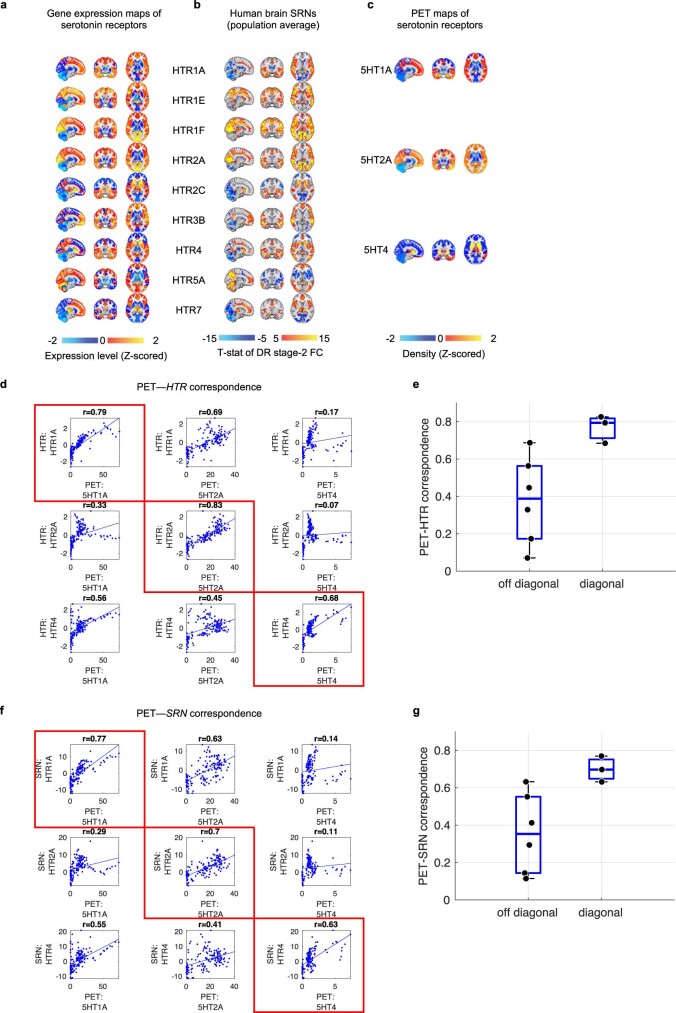
Extended Data Fig. 1
Spatial correspondence between gene expression maps, SRNs, and PET maps.
Related to Fig. 1 . a ) Showing human brain maps (rank-based inverse normalised) of serotonin receptor genes publicly available from the Allen Brain Institute. b ) Showing group-level maps (T-stats) o...
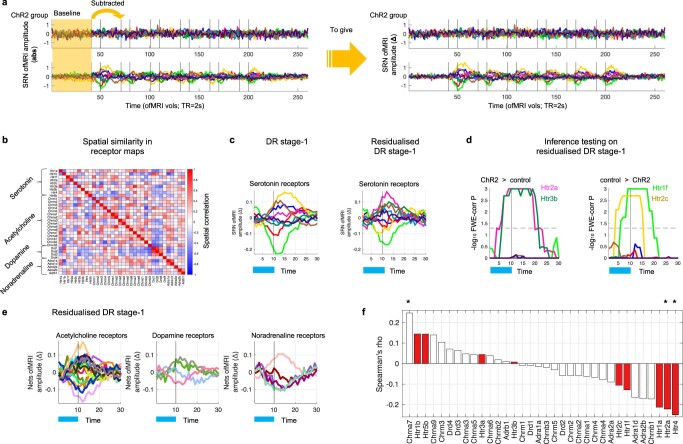
Extended Data Fig. 2
SRNs fluctuations during DRN ofMRI and specificity.
Related to Fig. 2 . a ) Left: Showing SRN fluctuations in absolute (abs) amplitude in response to DRN ofMRI. Yellow area indicates the average SRN absolute (abs) amplitude activity (DR-stage 1 SRN amp...
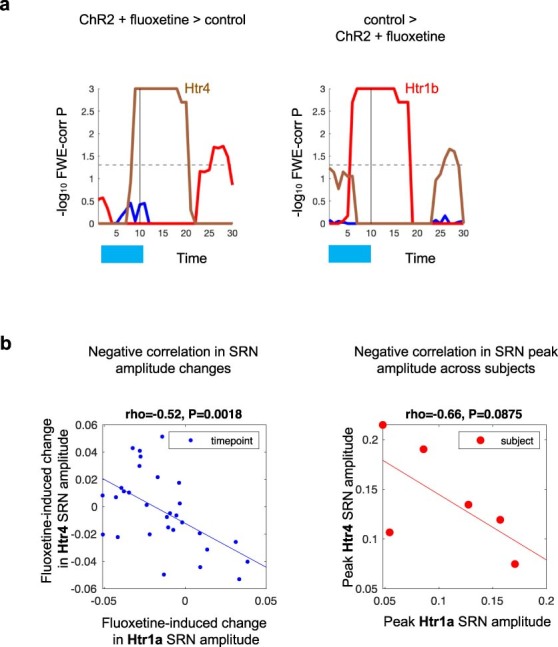
Extended Data Fig. 3
Cross-receptors relationship between Htr1a and Htr4 SRNs.
Related to Fig. 3 . a ) Results from permutation analysis of linear models for group differences between the ChR2 group treated with fluoxetine and the control group in SRN time-locked amplitude chang...
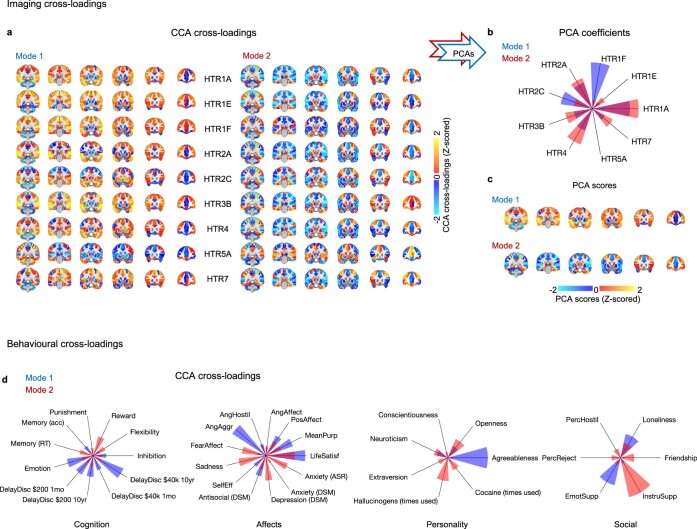
Extended Data Fig. 4
Full set of imaging and behavioural CCA cross-loadings.
Related to Fig. 4 . a ) For each CCA mode, showing non-thresholded brain maps of imaging cross-loadings. As the CCA was carried out on ROI-based SRN functional connectivity values, maps are displayed ...
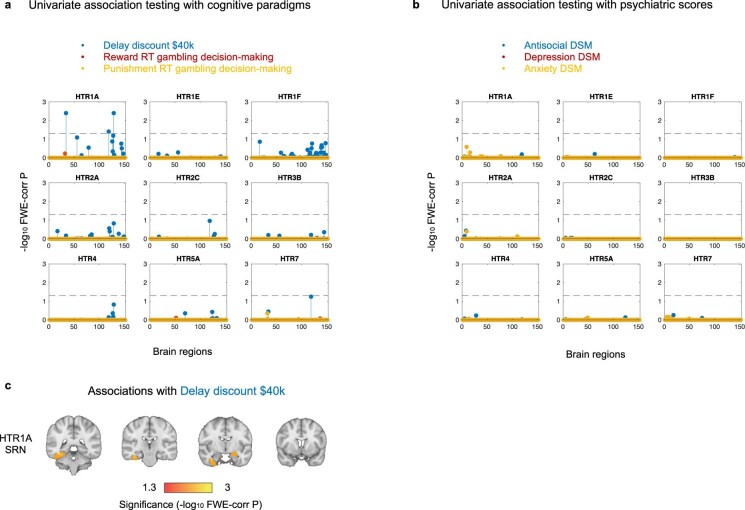
Extended Data Fig. 5
Univariate association testing between single SRNs and mental processes implicated in serotonin function.
Related to Fig. 4 . a ) Significance level of permutation analysis of linear models testing the associations between single SRNs and cognitive processes implicated in serotonin function: delay discoun...
Figure images are served from the NIH/NLM PubMed Central Open Access Subset or Europe PMC; copyright remains with the publishers and authors.
💬 Discussion
0 commentsNo comments yet. Be the first to start a discussion!
Leave a Comment