Abstract
Signal propagation from the cell membrane to a promoter can induce gene expression. To examine signal transmission through sub-cellular compartments and its effect on transcription levels in individual cells within a population, we used the Wnt/β-catenin signaling pathway as a model system. Wnt signaling orchestrates a response through nuclear accumulation of β-catenin in the cell population. However, quantitative live-cell measurements in individual cells showed variability in nuclear β-catenin accumulation, which could occur in two waves, followed by slow clearance. Nuclear accumulation dynamics were initially rapid, cell cycle independent and differed substantially from LiCl stimulation, presumed to mimic Wnt signaling. β-catenin levels increased simultaneously at adherens junctions and the centrosome, and a membrane-centrosome transport system was revealed. Correlating β-catenin nuclear dynamics to cyclin D1 transcriptional activation showed that the nuclear accumulation rate of change of the signaling factor, and not actual protein levels, correlated with the transcriptional output of the pathway.
🔬 Techniques
💻 Software
✨ Fluorophores
🧪 Sample Preparation
🔬 Cell Lines
🏭 Microscope Brands
🧪 Reagent Suppliers
📷 Detectors
🎨 Filters
💻 Software Details
📋 Protocols
💾 Data Repositories
🏛️ Research Organizations (ROR)
Affiliated research institutions:
📋 Methods
Cells and transfections HEK293 Flp-in CCND1-MS2 cells ( Yunger et al., 2010 ) were maintained in Dulbecco’s modified Eagle’s medium (DMEM, Biological Industries, Israel) containing 10% FBS (HyClone Laboratories, Logan, UT) and hygromycin selection (100 µg/ml; Sigma, Israel). Stable expression of MS2-GFP was obtained by co-transfection of the cells with MS2-GFP (10 µg) and puromycin resistance (300 ng) plasmids using calcium phosphate transfection, and selection with puromycin (1 μg/ml; Invivogen, San Diego, CA) and hygromycin (100 µg/ml). Stable expression of YFP-β-catenin ( Krieghoff et al., 2006 ) (10 µg) was performed by calcium phosphate transfection, and selection with neomycin (500 μg/ml; Sigma) and hygromycin (100 µg/ml). Cells with very low expression levels were collected by FACS (FACSAria III, BD Biosciences). Transient expression of YFP-β-catenin was performed using PolyJET (SignaGen, Israel). For generating Wnt3a conditioned medium (CM) and mock CM, L-Wnt-3A and L- mouse fibroblast cells were grown in DMEM and 10% FBS, and CM was prepared according to the American Tissue Culture Collection (ATCC) instructions ( Shibamoto et al., 1998 ). Wnt activation was performed with either Wnt3a-CM or with recombinant human Wnt3a (200 ng/ml; R& D Systems, Minneapolis, MN). Wnt3a-CM or mock-CM were added 1:1 to the volume of the cells medium. Cells were also treated with LiCl (20 mM; Sigma) and MG132 (20 µM; Sigma). The Fucci system (Clontech, Mountain View, CA) was used for cell cycle phase detection. For G1 phase detection, the pRetroX-G1-Red vector (mCherry-hCdt1) was used, and for S/G2/M phase the pRetroX-SG2M-Cyan vector (AmCyan-hGeminin). The Fucci system, being a viral-based system first required the introduction of the mouse ecotropic retroviral receptor on the membrane surface of HEK293 CCND1-MS2 cells expressing YFP-β-catenin. Transient transfection was performed 24 hr prior to infection using PolyJet transfection with the pBABE ecotropic receptor plasmid (Addgene #10687, Cambridge, MA). This step was performed twice for each infection. After mCherry-hCdt1 infection, mCherry positive cells were collected by FACS and maintained in medium containing puromycin (1 μg/ml; Invivogen). Cells were then transfected with the pBABE ecotropic receptor plasmid and 24 hr post-transfection, the cells infected with AmCyan-hGeminin. Positive cells were collected by FACS and maintained in medium containing neomycin (500 μg/ml) and puromycin (1 μg/ml). For infections, HEK293T cells were maintained in DMEM containing 10% FBS and used to package the Fucci retroviruses, which were collected over a period of three days before infecting the ecotropic HEK293 cells.
Show full methods section
Cells and transfections HEK293 Flp-in CCND1-MS2 cells ( Yunger et al., 2010 ) were maintained in Dulbecco’s modified Eagle’s medium (DMEM, Biological Industries, Israel) containing 10% FBS (HyClone Laboratories, Logan, UT) and hygromycin selection (100 µg/ml; Sigma, Israel). Stable expression of MS2-GFP was obtained by co-transfection of the cells with MS2-GFP (10 µg) and puromycin resistance (300 ng) plasmids using calcium phosphate transfection, and selection with puromycin (1 μg/ml; Invivogen, San Diego, CA) and hygromycin (100 µg/ml). Stable expression of YFP-β-catenin ( Krieghoff et al., 2006 ) (10 µg) was performed by calcium phosphate transfection, and selection with neomycin (500 μg/ml; Sigma) and hygromycin (100 µg/ml). Cells with very low expression levels were collected by FACS (FACSAria III, BD Biosciences). Transient expression of YFP-β-catenin was performed using PolyJET (SignaGen, Israel). For generating Wnt3a conditioned medium (CM) and mock CM, L-Wnt-3A and L- mouse fibroblast cells were grown in DMEM and 10% FBS, and CM was prepared according to the American Tissue Culture Collection (ATCC) instructions ( Shibamoto et al., 1998 ). Wnt activation was performed with either Wnt3a-CM or with recombinant human Wnt3a (200 ng/ml; R& D Systems, Minneapolis, MN). Wnt3a-CM or mock-CM were added 1:1 to the volume of the cells medium. Cells were also treated with LiCl (20 mM; Sigma) and MG132 (20 µM; Sigma). The Fucci system (Clontech, Mountain View, CA) was used for cell cycle phase detection. For G1 phase detection, the pRetroX-G1-Red vector (mCherry-hCdt1) was used, and for S/G2/M phase the pRetroX-SG2M-Cyan vector (AmCyan-hGeminin). The Fucci system, being a viral-based system first required the introduction of the mouse ecotropic retroviral receptor on the membrane surface of HEK293 CCND1-MS2 cells expressing YFP-β-catenin. Transient transfection was performed 24 hr prior to infection using PolyJet transfection with the pBABE ecotropic receptor plasmid (Addgene #10687, Cambridge, MA). This step was performed twice for each infection. After mCherry-hCdt1 infection, mCherry positive cells were collected by FACS and maintained in medium containing puromycin (1 μg/ml; Invivogen). Cells were then transfected with the pBABE ecotropic receptor plasmid and 24 hr post-transfection, the cells infected with AmCyan-hGeminin. Positive cells were collected by FACS and maintained in medium containing neomycin (500 μg/ml) and puromycin (1 μg/ml). For infections, HEK293T cells were maintained in DMEM containing 10% FBS and used to package the Fucci retroviruses, which were collected over a period of three days before infecting the ecotropic HEK293 cells.
Western blotting
SDS-PAGE and Western blotting were performed as previously described ( Aizer et al., 2008 ). Primary antibodies used were mouse anti-β-catenin (BD Transduction Laboratories, cat# 610154, San Jose, CA) and rabbit anti-tubulin (Abcam, Cambridge, MA). The secondary antibody was an HRP-conjugated goat anti-rabbit or anti-mouse IgG (Sigma). Immunoreactive bands were detected by the Enhanced Chemiluminescence kit (ECL, PierceThermo scientific, Waltham, MA). Experiments were performed three times. Luciferase assay HEK293 CCND1-MS2 cells were co-transfected with the cyclin D1 promoter −1745CD1LUC Firefly luciefarse construct ( Albanese et al., 1995 ) and either YFP-β-catenin or eYFP-C1 (mock), together with a Renilla luciferase construct using PolyJet transfection. 50 ng of each plasmid were used. A luciferase assay was performed after 24 hr using the Dual-Glo Luciferase assay system (Promega, Madison, WI). After standardization with Renilla luciferase activity, a relative luciferase activity was obtained and the mean and standard deviation from triplicate wells was calculated. Each experiment was performed three times. YFP-β-catenin ( Krieghoff et al., 2006 ) was obtained from Jürgen Behrens (University of Erlangen-Nürnberg).
Flow cytometry
Cells were harvested and DNA quantification was performed using 5 μg/ml DAPI solution (Sigma). The BD FACSAria III cell sorter was used. For quantifying DNA in fixed cells, we used a 405 nm laser for excitation and a 450/40 nm bandpass filter for detection. Data were processed and analyzed using FlowJo software. The average quantification of 3 repeated experiments is presented (mean ± sd).
Immunofluorescence
Cells were grown on coverslips coated by Cell-Tak (BD Biosciences), washed with PBS and fixed for 20 min in 4% PFA. Cells were then permeabilized in 0.5% Triton X-100 for 3 min. After blocking, cells were immunostained for 1 hr with a primary antibody, and after subsequent washes the cells were incubated for 1 hr with secondary fluorescent antibodies. Primary antibodies: mouse anti-β-catenin and rabbit anti-pericentrin (Abcam, cat# ab4448). Secondary antibodies: Alexa488-labeled goat anti-mouse IgG and Alexa594-labeled goat anti-rabbit (Invitrogen, Carlsbad, CA). Nuclei were counterstained with Hoechst 33342 (Sigma) and coverslips were mounted in mounting medium.
Fluorescence in situ hybridization
CCND1-MS2 cells were grown on coverslips coated by Cell-Tak (BD Biosciences) and fixed for 20 min in 4% paraformaldehyde, and overnight with 70% ethanol at 4°C. The next day cells were washed with 1x PBS and treated for 2.5 min with 0.5% Triton X-100. Cells were washed with 1x PBS and incubated for 10 min in 40% formamide (4% SSC; Sigma). Cells were hybridized overnight at 37°C in 40% formamide with a specific fluorescently-labeled Cy3 DNA probe (~10 ng probe, 50 mer). The next day, cells were washed twice with 40% formamide for 15 min and then washed for two hours with 1X PBS. Nuclei were counterstained with Hoechst 33342 and coverslips were mounted in mounting medium. The probe for the MS2 binding site was: CTAGGCAATTAGGTACCTTAGGATCTAATGAACCCGGGAATACTGCAGAC. mRNA quantification 3D stacks (0.2 µm steps, 76 or 51 planes) of the total volume of the cells were collected from fixed CCND1-MS2 cells. The 3D stacks were deconvolved and the specific signals of mRNAs were identified (Imaris, Bitplane). mRNA identification was performed in comparison to deconvolved stacks from cells not containing the MS2 integration, which therefore served as background levels of nonspecific fluorescence. No mRNAs were identified in control cells. The sum of intensity for each mRNA particle and active alleles was measured in the same cells using Imaris, as previously described ( Yunger et al., 2010 , 2013 ). The single mRNA intensities were pooled and the frequent value was calculated. The sum of intensity at the transcription site was divided by the frequent value of a single mRNA. This ratio provided the number of mRNAs associated with the transcription unit from the point of the MS2-region and onwards. As mRNAs should be associated with a polymerase, this number should reflect the maximum number of polymerases engaged with this region. Quantification and counting experiments were applied to experiments performed on different days. Fluorescence microscopy, live-cell imaging and data analysis Wide-field fluorescence images were obtained using the Cell^R system based on an Olympus IX81 fully motorized inverted microscope (60X PlanApo objective, 1.42 NA) fitted with an Orca-AG CCD camera (Hamamatsu) driven by the Cell^R software. Live-cell imaging was carried out using the Cell^R system with rapid wavelength switching. For time-lapse imaging, cells were plated on glass-bottomed tissue culture plates (MatTek, Ashland, MA) coated by Cell-Tak (BD Biosciences) in medium containing 10% FBS at 37°C. The microscope is equipped with an incubator that includes temperature and CO 2 control (Life Imaging Services, Reinach, Switzerland). For long-term imaging, several cell positions were chosen and recorded by a motorized stage (Scan IM, Märzhäuser, Wetzlar-Steindorf, Germany). In these experiments, HEK293 Flp-in CCND1-MS2 expressing MS2-GFP cells were imaged in 3D (26 planes per time point) every 15 min, at 0.26 µm steps for 6 hr. HEK293 Flp-in CCND1-MS2 cells expressing YFP-β-catenin were imaged in 3D (15 planes per time point) at 0.7 µm steps, every 15 min, up to 18 hr. For presentation of the movies, the 4D image sequences were transformed into a time sequence using the maximum or sum projection options or manually selecting the in-focus plane using the ImageJ software. Time-lapse data were collected from single cells in several fields and on several days until reaching an appropriate sample size, and then all single-cell data were pooled and either averaged and presented as plots, or presented as single cell data.
Tracking and data analysis
The intensity of the active transcription sites labeled with MS2-GFP fluorescence in time-lapse movies was corrected for photobleaching using ImageJ, and the 3D movies were transformed to 2D by choosing the in-focus plane in which the intensity of the transcription site is the highest. Movies were manually tracked and the intensity measured for each frame ( Is ). Background from another location in the nucleus ( In ) was subtracted for each frame, and the final intensity was calculated using: I = Is(t) − In(t) and then normalized to the initial intensity. Measuring the intensity of the YFP-β-catenin signal in the subcellular compartments was performed manually using ImageJ, and background was subtracted from all measurements. When YFP-β-catenin levels were low, DIC images that were acquired in parallel were used for nucleus detection. For measurements of centrosome intensity, the intensity of the centrosome in each frame ( Ic) was multiplied by the area occupied by the centrosome ( Ac ): I = Ic(t) *Ac(t) . For membrane intensity, a sum projection of the 3D movies was used. Intensity was normalized either to the initial frame or to the highest intensity measured. The values of the nucleus/cytoplasm (N/C) ratio of YFP-β-catenin were obtained by division of the YFP-β-catenin intensity levels measured. Correlation coefficient values were calculated by comparing the intensity of β-catenin over time between all possible pairs of sub-cellular compartments, from Wnt activation onset. Values of rate of change ( Δ I / Δ t ) in YFP-β-catenin in the sub-cellular compartments over time were obtained by measuring the intensity difference ( Δ I ) between two consecutive time points divided by the time difference ( Δ t ) between the two time points: Δ I Δ t ( t ) n + 1 2 = I ( t ) n + 1 − I ( t ) n t n + 1 − t n FRAP and FLIP FRAP and FLIP experiments were performed using a 3D-FRAP system (Photometrics) built on an Olympus IX81 microscope (636 Plan-Apo, 1.4 NA) equipped with an EM-CCD (Quant-EM, Roper), 491 nm laser, Lambda DG-4 light source (Sutter), XY and Z stages (Prior), and driven by MetaMorph (Molecular Devices). Experiments were performed at 37°C with 5% CO 2 using a live-cell chamber system (Tokai). For each acquisition, YFP-β-catenin was bleached using the 491 nm laser. Six pre-bleach images were acquired. In FRAP, post-bleach images were acquired every 0.8 s for 80 s in the cytoplasm and the nucleus, every 1 s for 2 min in adherens junctions, every 0.4 s for 40 s at the centrosome, and every 1.5 s for 8 min to measure nuclear import and export rates. In FLIP, images were acquired every 1.9 s for 280 s in the cytoplasm and the nucleus. The experiments were analyzed using ImageJ macros previously described ( Aizer et al., 2008 ). Data from at least 10 experiments for each cell line were collected and the averaged FRAP and FLIP measurements were fitted by Matlab with a double exponential model: I ( t ) = α 1 * exp ( − τ 1 * t ) + α 2 * exp ( − τ 2 * t ) + c Where t = 0 is the time immediately after photobleaching. t 0.5 was defined as time where I ( t = t 0.5 ) = I ( t = ∞ ) 2 . Modeling β-catenin dynamics We used a simple model for describing β-catenin concentration ( C ) dynamics in the nucleus based on the data presented in the plot from Figure 2c : d C d t = P ( t ) − α ( t ) C Where α is the time dependent degradation rate, and P is the time dependent production rate. Both rates are allowed to change when t = T : α ( t ) = { α 1 ; f o r t ≤ T α 2 ; f o r t > T P ( t ) = { P 1 ; f o r t ≤ T P 2 ; f o r t > T The solution is: C ( t ) = { [ C ( 0 ) − P 1 α 1 ] ∗ e − α 1 ∗ t + P 1 α 1 ; f o r t ≤ T [ C ( T ) − P 2 α 2 ] ∗ e − α 2 ∗ ( t − T ) + P 2 α 2 ; f o r t > T Where: C ( T ) = [ C ( 0 ) − P 2 α 1 ] * e − α 1 * t + P 2 α 1 We fit the model by minimizing the sum of the squares of the residuals with the function ‘fmincon’ in MATLAB using the ‘active-set’ algorithm.
Statistical analysis
Two tailed t-test was performed in the following experiments: Quantitative FISH, Luciferase assay, the N/C ratio of YFP-β-catenin and live cell analysis. A Mann–Whitney test was performed in FRAP and FLIP experiments ( Supplementary file 1 ).
Additional files 10.7554/eLife.16748.034 Supplementary file 1. Statistical analysis performed in this study. ( a ) The statistical significance p values (t test) at each time point for the percentage of cells showing an active CCND1-MS2 gene (refers to Figure 1b ) between control and Wnt3a-treated cells. ( b-f ) Mann-Whitney test for comparison between two independent FRAP/FLIP experiments. A statistical comparison between all datasets of two individual FRAP/FLIP experiments are depicted in each plot and are illustrated as a single red circle which marks the p-value (y axis) for all intensity values measured for each time point (x axis). The top and bottom dotted lines indicate where p-value equals 0.05. ( b ) Statistically significant difference between the FRAP dynamics of YFP-β-catenin in the nucleus under Wnt3a treatment versus overexpression of YFP-β-catenin that enters the nucleus without signal, and ( c ) between the FRAP and ( d ) FLIP import and export dynamics (refers to Figure 2—figure supplement 1 ). ( e ) No statistically significant difference between YFP-β-catenin at the cell membrane between mock-treated and Wnt3a-treated cells (refers to Figure 5—figure supplement 1 ). ( f ) No statistically significant difference between YFP-β-catenin at the cell membrane between mock-treated and LiCl-treated cells (refers to Figure 5—figure supplement 1 ). DOI: http://dx.doi.org/10.7554/eLife.16748.034
📊 Figures
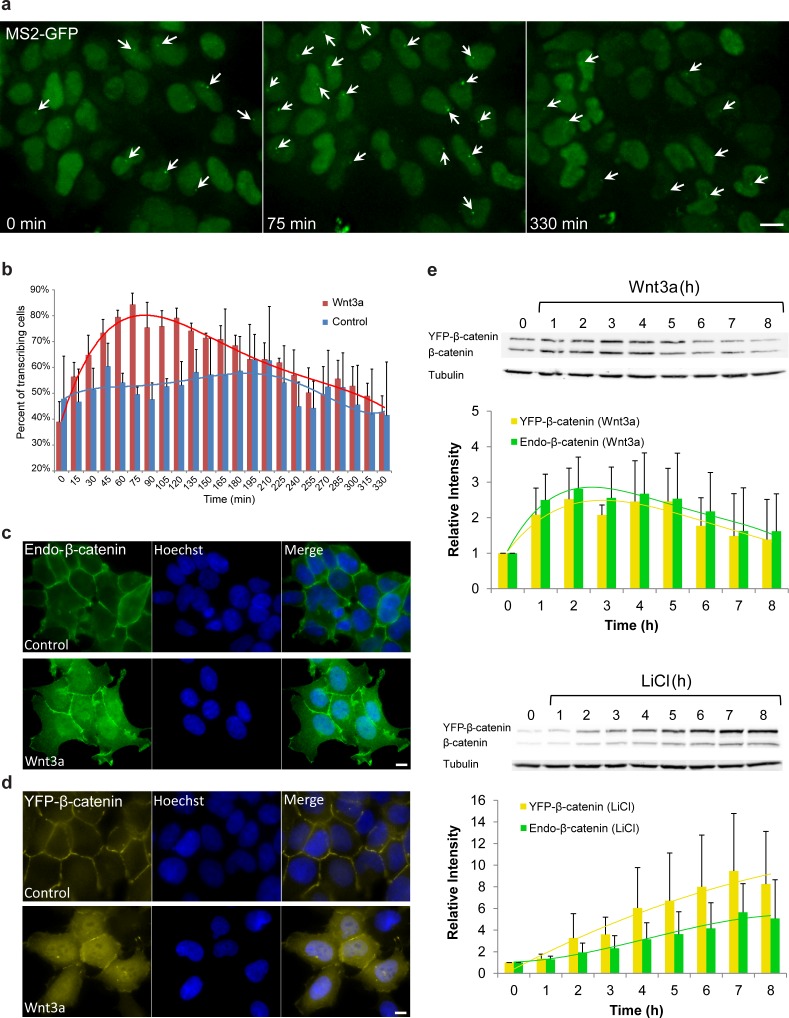
Figure 1.
Cell system for following u03b2-catenin intra-cellular dynamics and CCND1 transcription in single living cells.
( a ) CCND1-MS2 HEK293 cells stably expressing MS2-GFP-CP were treated with Wnt3a and followed for 6 hr (every 15 min). Several frames from Video 1 are presented. The number of cells exhibiting transc...
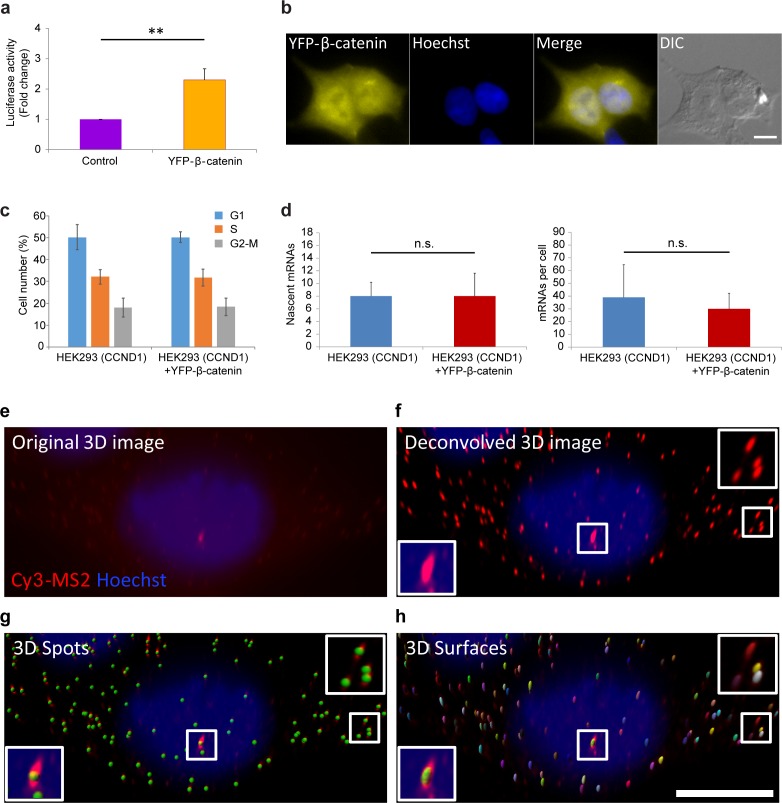
Figure 1u2014figure supplement 1.
Measuring the effect of YFP-u03b2-catenin expression in HEK293 cells.
( a ) Luciferase assay showing the levels of cyclin D1 promoter activation following the transient transfection of YFP-u03b2-catenin into HEK293 cells. p=0.003. ( b ) Overexpression of YFP-u03b2-caten...
Video 1.
Transcriptional activation of CCND1 in response to Wnt3a.
HEK293 CCND1-MS2 cells stably expressing MS2-GFP (green) were treated with Wnt3a. The transcribed CCND1 mRNA on the active gene is seen as a bright green dot. The fluorescent signal on the active gene...
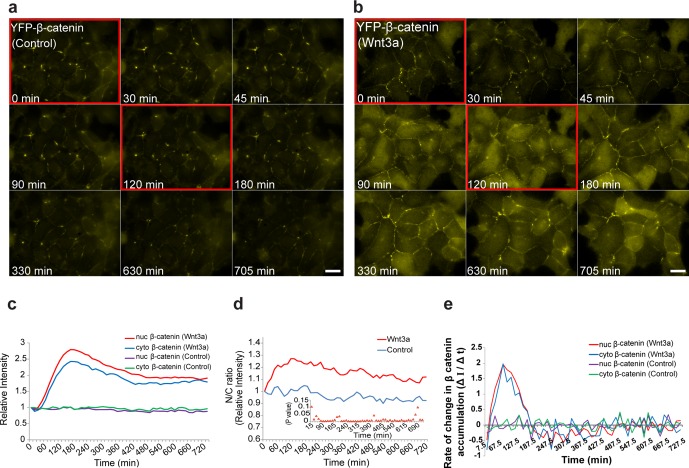
Figure 2.
The dynamics of u03b2-catenin accumulation following Wnt3a activation in cell populations.
Frames from live-cell movies ( Video 2 ) showing YFP-u03b2-catenin dynamics in cells treated with ( a ) mock conditioned medium or ( b ) Wnt3a foru00a012u00a0hr. Red bordered frames compare between th...
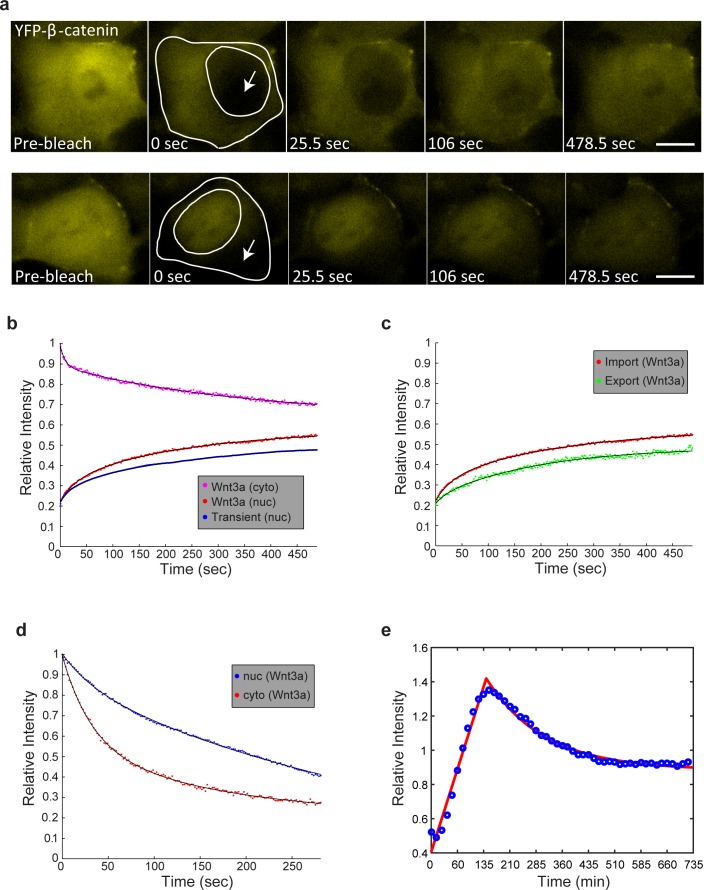
Figure 2u2014figure supplement 1.
FRAP and FLIP measurements of YFP-u03b2-catenin import and export dynamics.
( a ) Frames showing one pre-bleach frame, the bleach of the YFP-u03b2-catenin in the nucleus (top) or cytoplasm (bottom) of a Wnt3a-treated cell (2 hr, arrows point to bleached region), and frames fo...
Video 2.
YFP-u03b2-catenin dynamics at steady state and after Wnt3a activation.
HEK293 CCND1-MS2 cells stably expressing YFP-u03b2-catenin were treated with Wnt3a (top) and showed nuclear and cytoplasmic accumulation of YFP-u03b2-catenin, followed by slow egress. No change in YFP...
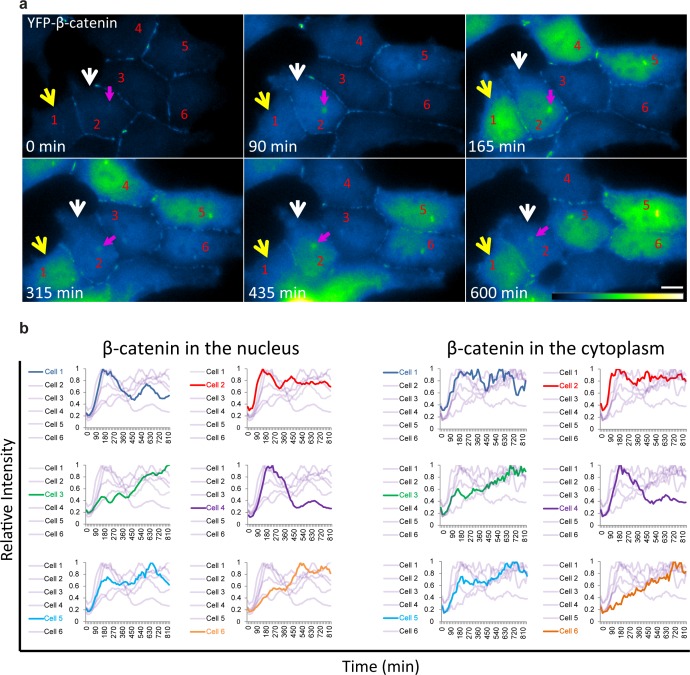
Figure 3.
Variability of u03b2-catenin accumulation dynamics following Wnt3a activation in individual cells.
( a ) Frames from time-lapse Video 3 showing YFP-u03b2-catenin accumulation in a population of cells. The YFP signal is pseudo-coloured using ImageJ u2018Green Fire Blueu2019 look-up table. White and ...
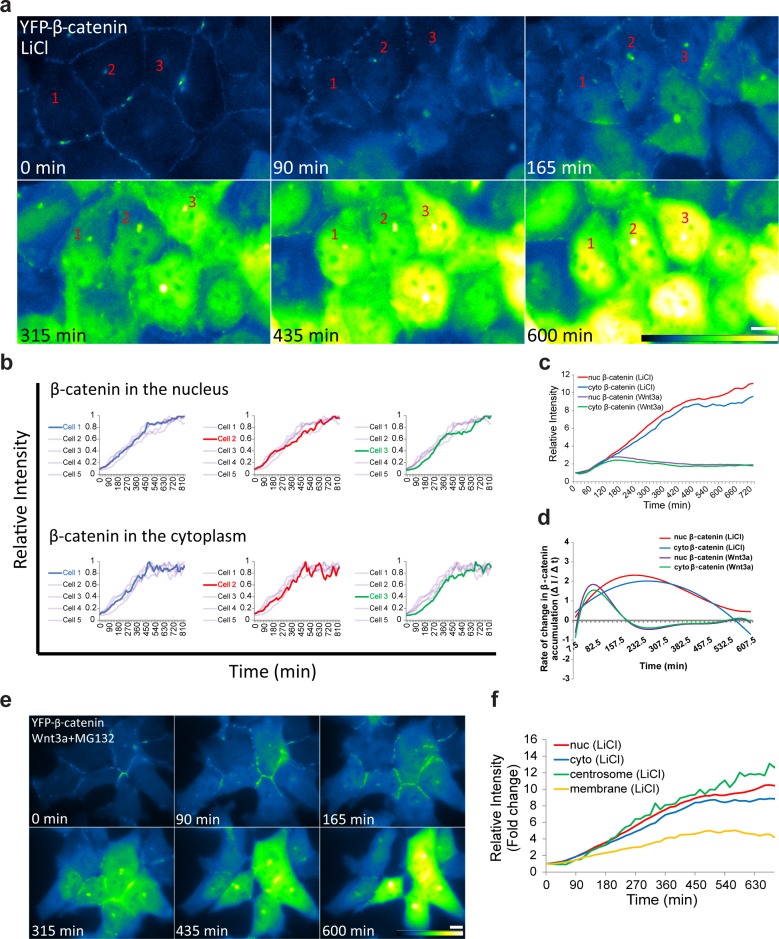
Figure 3u2014figure supplement 1.
u03b2-catenin accumulation dynamics in response to LiCl activation in individual cells.
( a ) Frames from time-lapse Video 4 showing YFP-u03b2-catenin accumulation in a population of cells. The YFP signal is pseudo-colored using the ImageJ u2018Green Fire Blueu2019 look-up table. Baru00a...
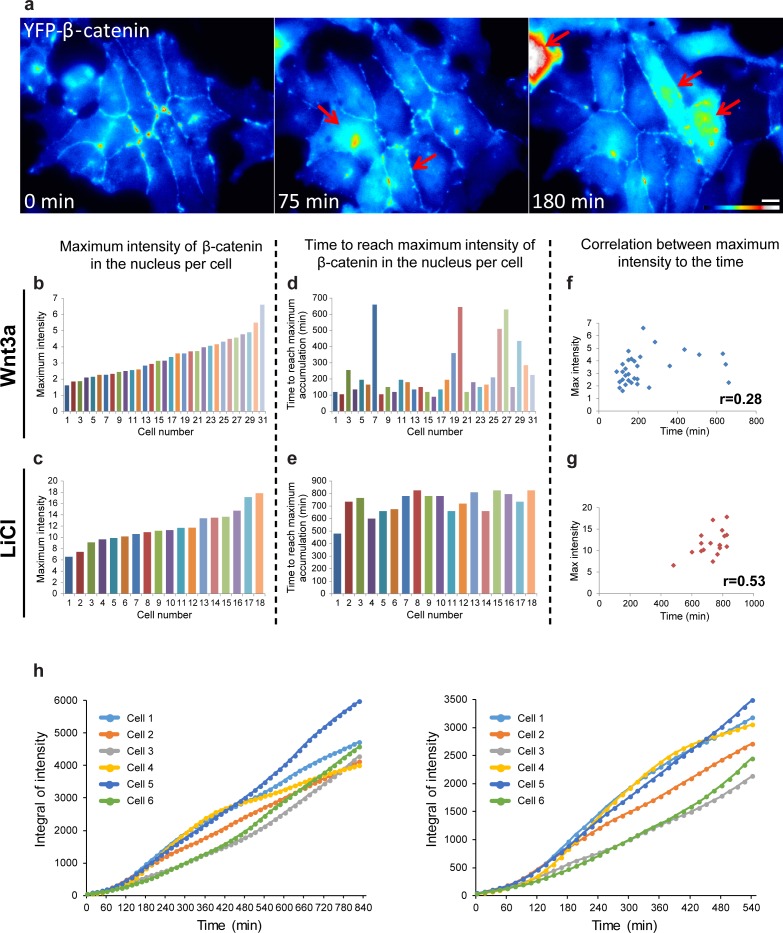
Figure 3u2014figure supplement 2.
The relationship between YFP-u03b2-catenin levels of accumulation and time of Wnt3a activation.
( a ) Frames from a time-lapse movie showing YFP-u03b2-catenin accumulation in a population of cells in the field. The YFP signal is pseudo-colored using the ImageJ u2018Royalu2019 look-up table. Red ...
Video 3.
YFP-u03b2-catenin dynamics in individual cells.
HEK293 CCND1-MS2 cells stably expressing YFP-u03b2-catenin were treated with Wnt3a, and the dynamics of the protein were observed in individual cells. The YFP signal is pseudo-colored using ImageJ u20...
Video 4.
YFP-u03b2-catenin dynamics in response to LiCl.
HEK293 CCND1-MS2 cells stably expressing YFP-u03b2-catenin were treated with LiCl and increased accumulation of the protein was observed. The YFP signal is pseudo-colored using ImageJ u2018Green Fire ...
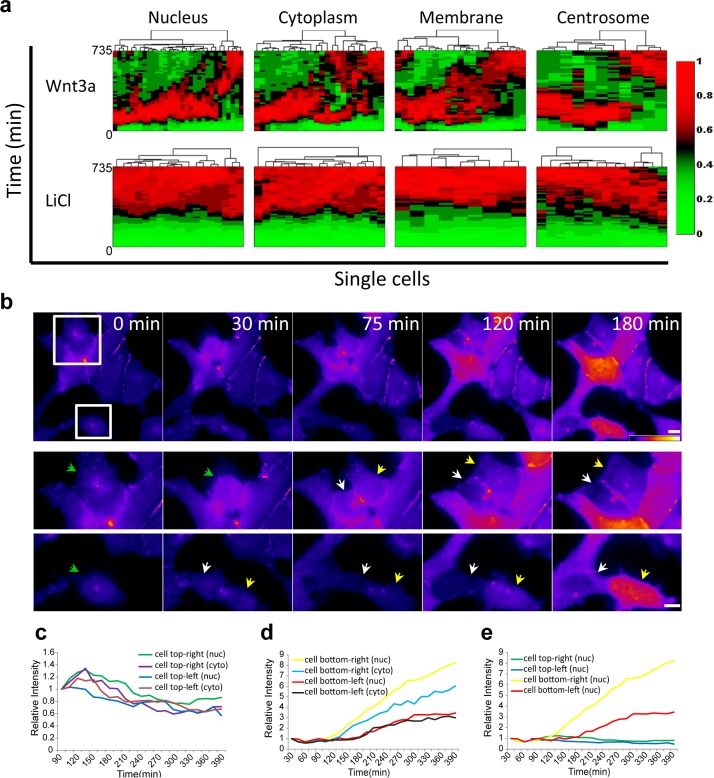
Figure 4.
Variability of u03b2-catenin dynamics in the cell population and during the cell cycle.
( a ) Heat map and cluster analysis of normalized u03b2-catenin accumulation dynamics in sub-cellular compartments following Wnt3a (top, n(nucleus)u00a0=u00a031, n(cytoplasm)u00a0=u00a024, n(membrane)...
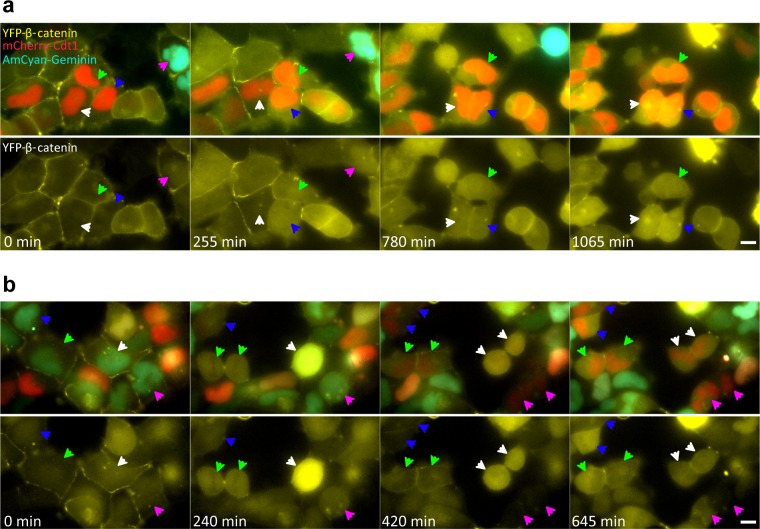
Figure 4u2014figure supplement 1.
YFP-u03b2-catenin dynamics during the cell cycle in Wnt3a induced cells.
HEK293 CCND1-MS2 YFP-u03b2-catenin cells were stably infected with the Fucci system (mCherry-Cdt1 and AmCyan1-Geminin). Cdt1 levels peak during G1 (red cells), and as cells transition into S, Cdt1 lev...
Video 5.
YFP-u03b2-catenin dynamics following Wnt3a activation during cell division.
HEK293 CCND1-MS2 cells stably expressing YFP-u03b2-catenin were treated with Wnt3a, and the dynamics of the protein in the nucleus were followed over time. Two cells that undergo mitosis were observed...
Video 6.
YFP-u03b2-catenin dynamics following Wnt3a activation during the cell cycle.
HEK293 CCND1-MS2 cells stably expressing YFP-u03b2-catenin (yellow) and the Fucci markers for G1 (red) and G2 (cyan), were treated with Wnt3a, and the dynamics of the protein were followed over time.u...
Video 7.
YFP-u03b2-catenin dynamics following Wnt3a activation during cell division.
HEK293 CCND1-MS2 cells stably expressing YFP-u03b2-catenin (yellow) and the Fucci markers for G1 (red) and G2 (cyan), were treated with Wnt3a, and the dynamics of the protein were followed over time i...
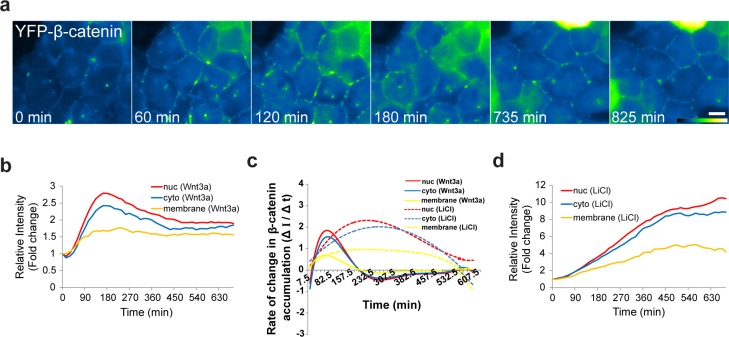
Figure 5.
The dynamics of u03b2-catenin accumulation at the membrane following Wnt3a activation.
( a ) Frames from time-lapse Video 8 showing YFP-u03b2-catenin accumulation at the cell membrane. The YFP signal is pseudo-colored using the ImageJ u2018Green Fire Blueu2019 look-up table. Baru00a0=u0...
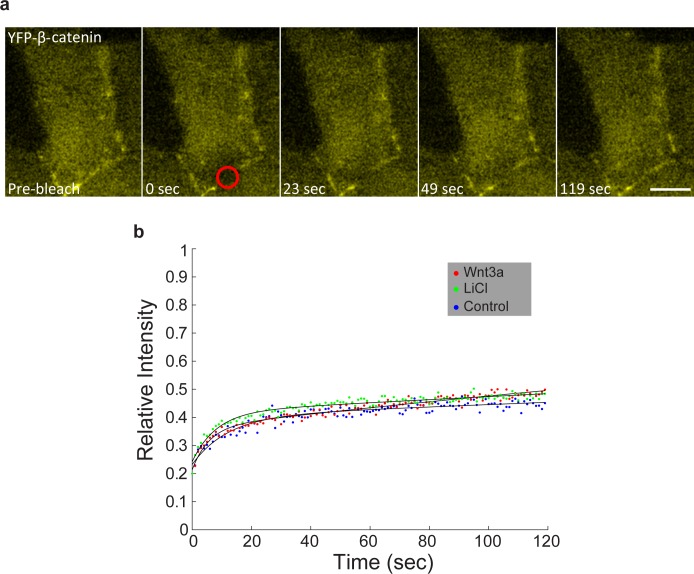
Figure 5u2014figure supplement 1.
FRAP measurements of YFP-u03b2-catenin dynamics at adherens junctions.
( a ) Frames showing one pre-bleach frame, the bleach of the YFP-u03b2-catenin in the membrane region of a Wnt3a-treated cell, and frames following the recovery of theu00a0signal over time. Circle den...
Video 8.
YFP-u03b2-catenin dynamics at the cell membrane following Wnt3a activation.
HEK293 CCND1-MS2 cells stably expressing YFP-u03b2-catenin were treated with Wnt3a, and the dynamics of the protein at the membrane were followed over time, and were similar to the nucleus and cytopla...
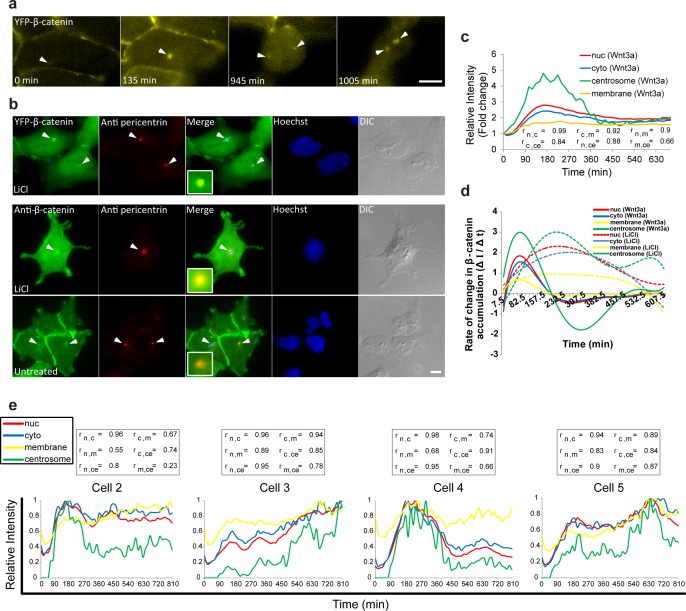
Figure 6.
Accumulation of u03b2-catenin at the centrosome after Wnt3a activation.
( a ) Frames from time-lapse Video 9 showing YFP-u03b2-catenin accumulation at the centrosome (white arrowheads) and after cell division. Baru00a0=u00a010 u03bcm. ( b ) The colocalization (white arrow...
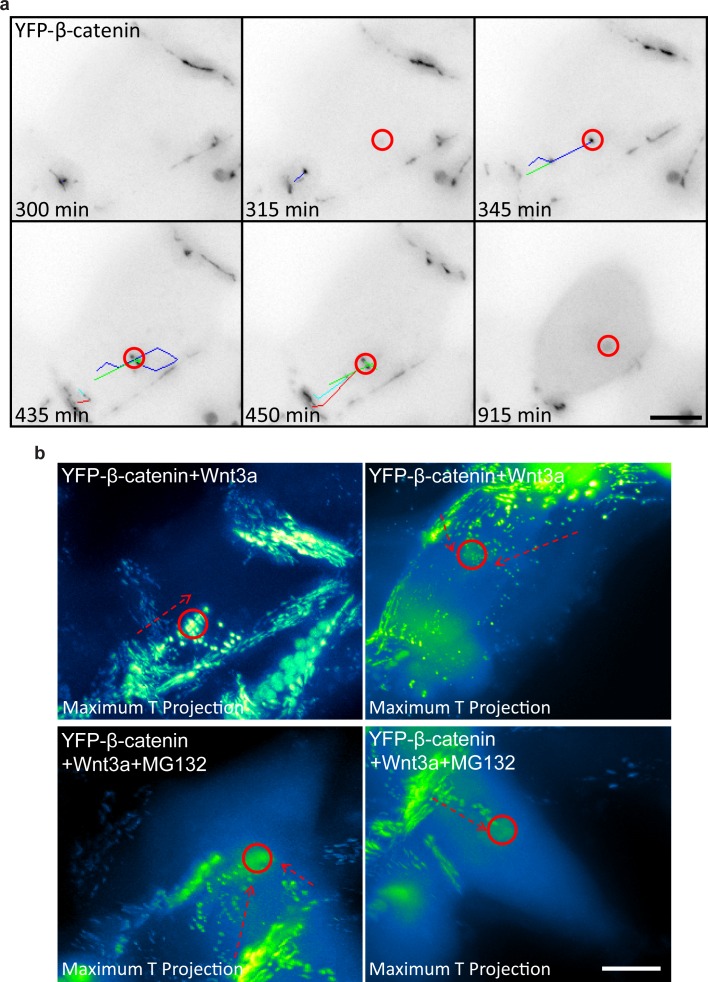
Figure 6u2014figure supplement 1.
Detachment of membranal YFP-u03b2-catenin puncta and movement towards the centrosome.
( a ) Frames from Video 10 showing the tracks of several YFP-u03b2-catenin membranal puncta (colored tracks) moving from the membrane region towards the centrosome area (red circle). Time is minutes a...
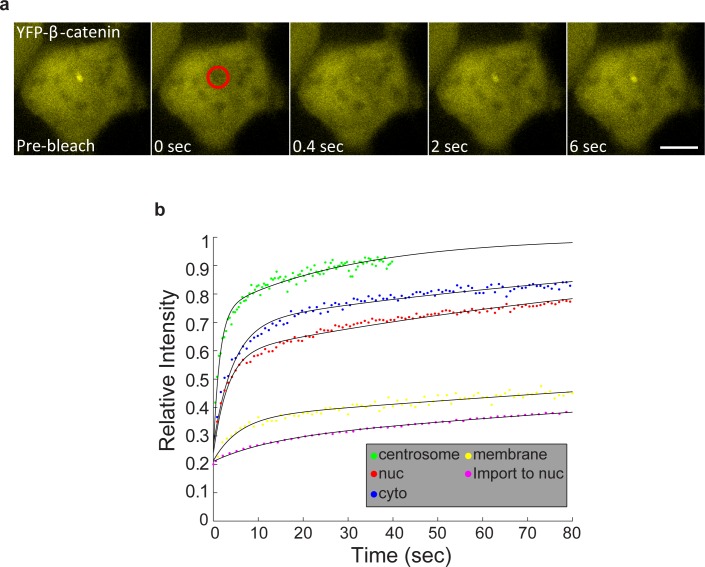
Figure 6u2014figure supplement 2.
Summary of FRAP measurements of YFP-u03b2-catenin dynamics in subcellular compartments in response to Wnt3a treatment.
( a ) Frames showing one pre-bleach frame, the bleach of the YFP-u03b2-catenin in the centrosome of a Wnt3a-treated cell, and frames following the recovery of signal over time. Circle denotes the blea...
Video 9.
YFP-u03b2-catenin accumulation at the centrosome following Wnt3a activation.
HEK293 CCND1-MS2 cells stably expressing YFP-u03b2-catenin were treated with Wnt3a, and the dynamics of the protein at the centrosome were observed in parallel to the accumulation in the nucleus and c...
Video 10.
YFP-u03b2-catenin puncta move from the membrane to the centrosome.
HEK293 CCND1-MS2 cells stably expressing YFP-u03b2-catenin were treated with Wnt3a. At the 300 min time point, a series of YFP-u03b2-catenin puncta can be tracked (track colors) moving from the membra...
Video 11.
YFP-u03b2-catenin puncta move from the membrane to the centrosome.
HEK293 CCND1-MS2 cells stably expressing YFP-u03b2-catenin were treated with Wnt3a and MG132. At the 165 min time point, a series of YFP-u03b2-catenin puncta can be tracked (track colors) moving from ...
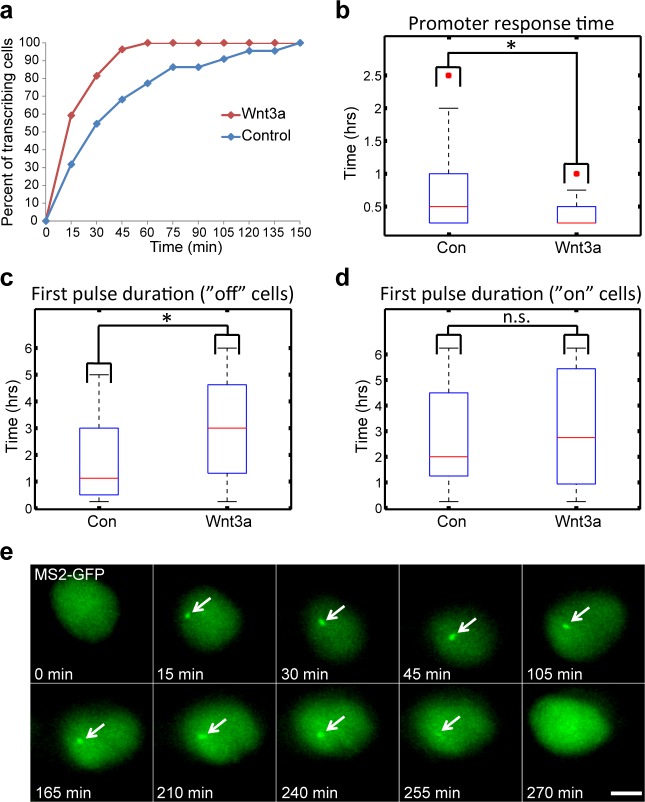
Figure 7.
Measuring the transcriptional response of CCND1-MS2 to Wnt3a activation in living cells.
( a ) The percentage of cells in a population of either mock-treated (blue) or Wnt3a-activated cells (red) showing an active CCND1-MS2 transcribing gene, over time. ( b ) The promoter response time of...
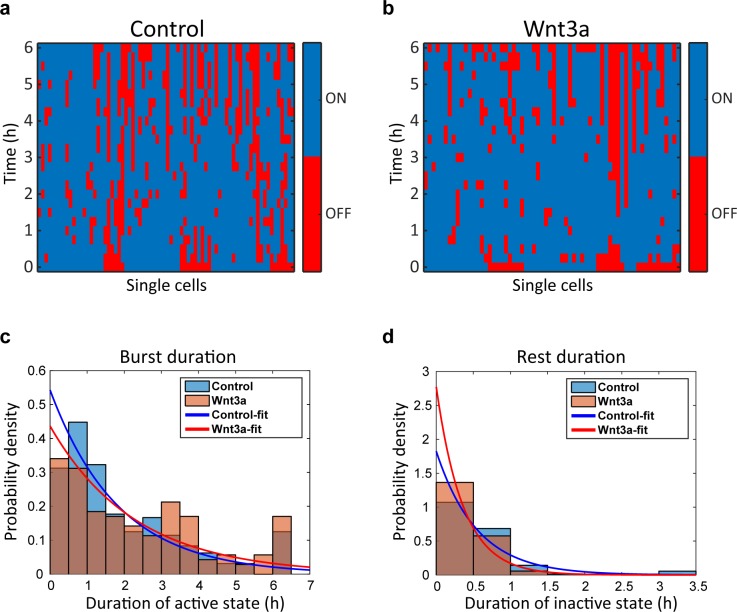
Figure 7u2014figure supplement 1.
Wnt signaling causes shorter rest duration in addition to an increase in the gene burst duration.
Plots of single cells demonstrate the active (blue) and inactive (red) state of CCND1-MS2 transcribing gene along 6 hr in ( a ) mock-treated cells (Control, nu00a0=u00a074) and ( b ) Wnt3a-treated cel...
Video 12.
Prolonged activation of CCND1 after Wnt activation.
HEK293 CCND1-MS2 cells stably expressing MS2-GFP (green) were treated with Wnt3a. CCND1 mRNA transcription could be detected 15 min after Wnt3a (green dot, transcription site) and continued for 4 hr. ...
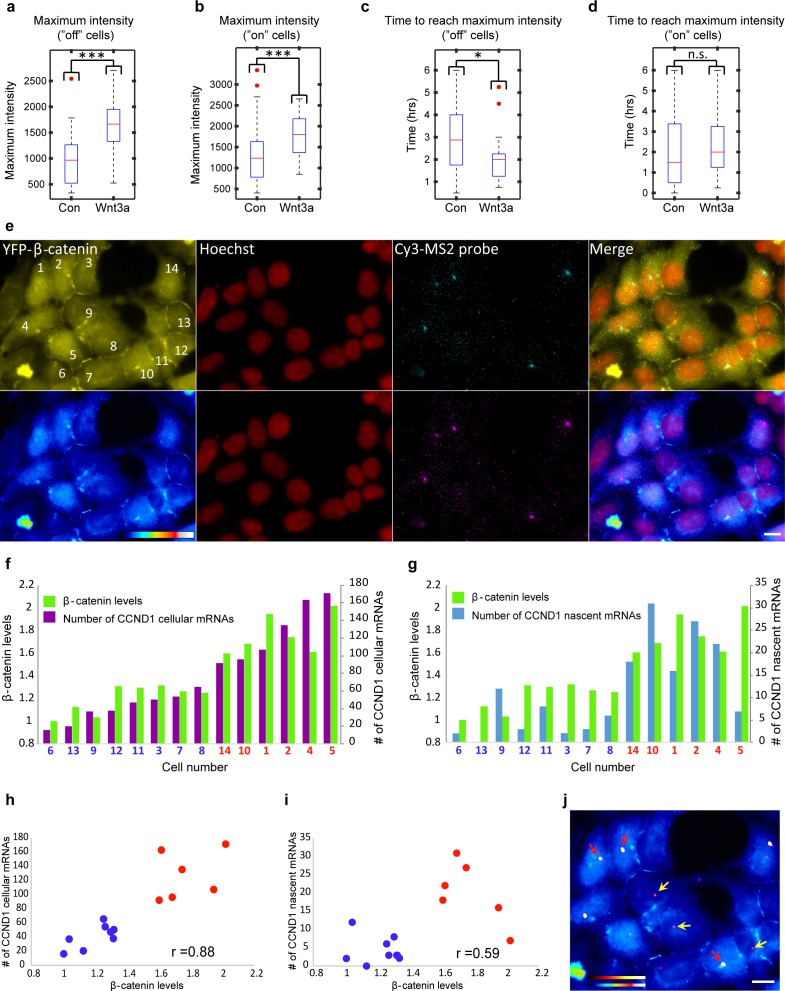
Figure 8.
Quantification of CCND1 activity levels following Wnt activation in single fixed and living cells.
( a , b ) Boxplots showing the maximal MS2-GFP intensity levels reached on actively transcribing CCND1-MS2 genes during 6 hr in Wnt3a-treated and mock-treated (Con) cells, when ( a ) the gene was eith...
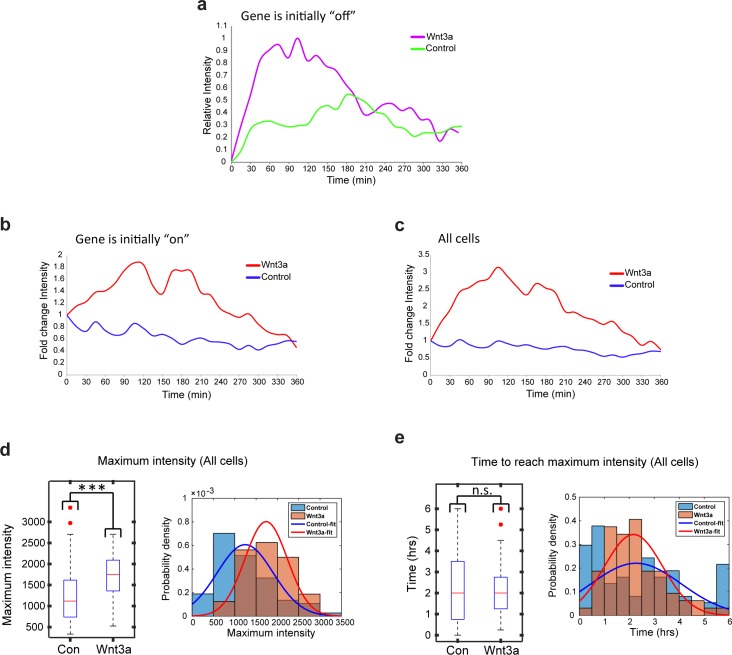
Figure 8u2014figure supplement 1.
Transcription site intensity levels in living cells following Wnt3a activation.
Plots showing the MS2-GFP average intensity levels measured on active CCND1-MS2 transcription sites during 6 hr in Wnt3a-treated and in mock-treated cells, when ( a ) the gene was either not transcrib...
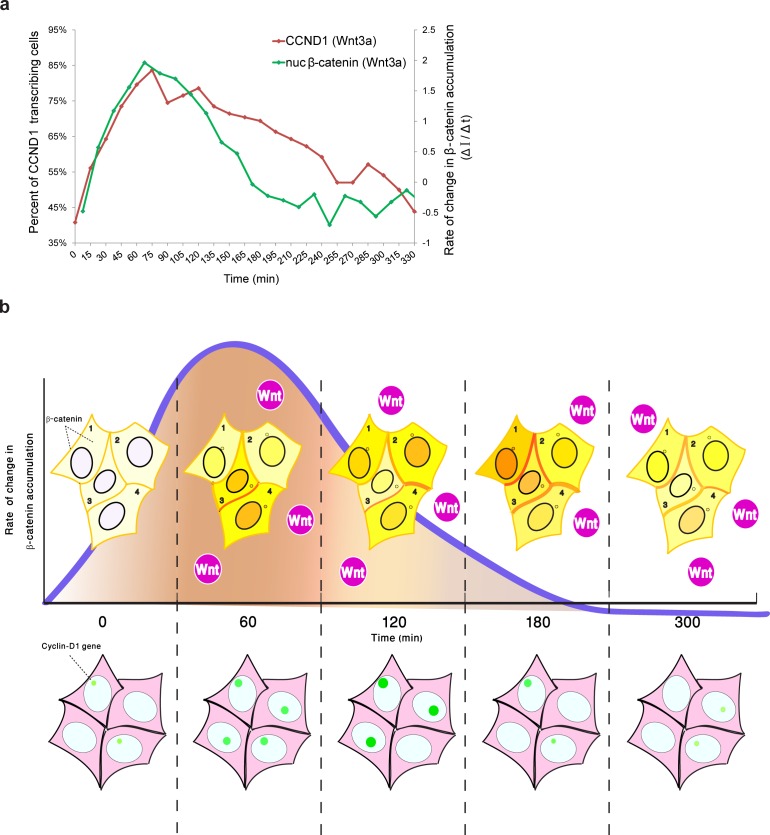
Figure 9.
Comparing the kinetics of CCND1 transcriptional activation to the dynamics of u03b2-catenin nuclear accumulation rate of change following Wnt signaling in living cells.
( a ) Plots of the average transcriptional activation kinetics of CCND1-MS2 (red) following Wnt3a activation, compared to the plot of rate of change in u03b2-catenin nuclear accumulation (green). ( b ...
Figure images are served from the NIH/NLM PubMed Central Open Access Subset or Europe PMC; copyright remains with the publishers and authors.
💬 Discussion
0 commentsNo comments yet. Be the first to start a discussion!
Leave a Comment