Abstract
The ability to precisely monitor and manipulate neural circuits is essential to understand the brain. Advancements over the last decade in optical techniques such as calcium imaging and optogenetics have empowered researchers to gain insight into brain function by systematically manipulating or monitoring defined neural circuits. Combining these cutting-edge techniques enables a more direct mechanism for ascribing neural dynamics to behavior. Here, we developed a miniaturized integrated microscope that allows for simultaneous optogenetic manipulation and cellular-resolution calcium imaging within the same field of view in freely behaving mice. The integrated microscope has two LEDs, one filtered with a 435-460 nm excitation filter for imaging green calcium indicators, and a second LED filtered with a 590-650 nm excitation filter for optogenetic modulation of red-shifted opsins. We developed and tested this technology to minimize biological and optical crosstalk. We observed insignificant amounts of biological and optical crosstalk with regards to the optogenetic LED affecting calcium imaging. We observed some amounts of residual crosstalk of the imaging light on optogenetic manipulation. Despite residual crosstalk, we have demonstrated the utility of this technology by probing the causal relationship between basolateral amygdala (BLA) -to- nucleus accumbens (NAc) circuit function, behavior, and network dynamics. Using this integrated microscope we were able to observe both a significant behavioral and cellular calcium response of the optogenetic modulation on the BLA-to-NAc circuit. This integrated strategy will allow for routine investigation of the causality of circuit manipulation on cellular-resolution network dynamics and behavior.
🔬 Techniques
🔭 Microscopes
✨ Fluorophores
🧪 Sample Preparation
🏭 Microscope Brands
📷 Detectors
🎨 Filters
💻 Software Details
🏛️ Research Organizations (ROR)
Affiliated research institutions:
📋 Methods
Microscope configuration and LED control
The integrated microscope has two LEDs, one filtered with a 435–460 nm excitation filter (EX-LED) for imaging, and a second LED filtered with a 590–650 nm excitation filter (OG-LED) for optogenetics. The output from the EX-LED is controlled by a constant current source with the ability to drive up to 30 mA (2 mW/mm 2 measured from the objective) with a step size of 7.6 μA. The OG-LED is controlled by a constant current source with the ability to drive up to 700 mA (10 mW/mm 2 measured from the objective at 100% duty cycle, or 35 mW/mm 2 at 25% duty cycle) with a step size of 15.2 μA. The microscope has a maximum field of view of 1,440 × 1,080 pixels (900 × 650 μm). The microscope is capable of imaging at a 30 frames per second resolution at maximum field of view, and 50 frames per second at 50% of the field of view. The working distance of the microscope is 100–300 micrometers below the objective lens, with ~100 μm of adjustment below this plane available through the focusing element on the microscope tower (Figure 1A ). Figure 1 Integrated optogenetic and Ca 2+ imaging system. (A) Cross-section schematic of the integrated optogenetic and Ca 2+ imaging system detailing the filter design and the Ca 2+ imaging LED (EX-LED) and optogenetic LED (OG-LED) light path. EX-LED rays (blue) and OG-LED rays (orange) are representative light paths measured using ray tracing. (B) EX-LED (blue) and OG-LED (orange) illumination spectra. Displayed spectra are normalized to equal peak spectral power. (C) Schematic of synchronized acquisition of integrated imaging and optogenetics with behavioral tracking.
Show full methods section
Microscope configuration and LED control
The integrated microscope has two LEDs, one filtered with a 435–460 nm excitation filter (EX-LED) for imaging, and a second LED filtered with a 590–650 nm excitation filter (OG-LED) for optogenetics. The output from the EX-LED is controlled by a constant current source with the ability to drive up to 30 mA (2 mW/mm 2 measured from the objective) with a step size of 7.6 μA. The OG-LED is controlled by a constant current source with the ability to drive up to 700 mA (10 mW/mm 2 measured from the objective at 100% duty cycle, or 35 mW/mm 2 at 25% duty cycle) with a step size of 15.2 μA. The microscope has a maximum field of view of 1,440 × 1,080 pixels (900 × 650 μm). The microscope is capable of imaging at a 30 frames per second resolution at maximum field of view, and 50 frames per second at 50% of the field of view. The working distance of the microscope is 100–300 micrometers below the objective lens, with ~100 μm of adjustment below this plane available through the focusing element on the microscope tower (Figure 1A ). Figure 1 Integrated optogenetic and Ca 2+ imaging system. (A) Cross-section schematic of the integrated optogenetic and Ca 2+ imaging system detailing the filter design and the Ca 2+ imaging LED (EX-LED) and optogenetic LED (OG-LED) light path. EX-LED rays (blue) and OG-LED rays (orange) are representative light paths measured using ray tracing. (B) EX-LED (blue) and OG-LED (orange) illumination spectra. Displayed spectra are normalized to equal peak spectral power. (C) Schematic of synchronized acquisition of integrated imaging and optogenetics with behavioral tracking.
Optical bench testing
The spectra of the miniaturized microscope (nVoke, Inscopix, Palo Alto, California) LED illumination were obtained by illuminating the end of a 400 micron 0.45 NA fiber optic (P400-2-UV-VIS, Ocean Optics, Dunedin, Florida) through an opal glass diffuser (opal glass diffuser, 43–717, Edmund Optics, Cupertino, California). The fiber optic directed the microscope output to a spectrograph with a cooled linear CCD sensor (QE65 Pro, Ocean Optics, Dunedin, Florida) with spectral resolution 5 sweeps. For the ChrimsonR synaptic terminal timecourse experiment, OG-LED light pulses (5 ms pulses, 10 Hz, 13 mW/mm 2 ) were delivered every 20 s for 5 sweeps to evoke postsynaptic currents. Pulse trains were repeated every 5 min for a total of 30 min of recording. In a subset of neurons, EX-LED (20 min, 0.5 mW/mm 2 ) was delivered between minutes 5 and 25. EPSC amplitudes were calculated by measuring the peak current from the average response from 5 sweeps. In a few cases, BLA terminal stimulation elicited spikes. As necessary, EPSC amplitude was estimated by generating an exponential curve fit to the latter 300–400 ms of the mean EPSC trace. EPSC amplitude was estimated as the intercept point of the extrapolated curve fit and the rising phase of the EPSC trace. For all somatic recordings, OG-LED light pulses (500 ms, 0.2–2.0 mW/mm 2 ) or EX-LED (500 ms, 0.2–2.0 mW/mm 2 ) were delivered every 20 s to evoke postsynaptic currents, or action potential firing. EPSC amplitudes were calculated by measuring the peak current from the average response from 5 sweeps. Real-time place preference At least 24 h after baseplate installation mice were habituated daily to the integrated microscope (nVoke, Inscopix, Palo Alto, California) in their home-cages. Prior to all habituation and behavioral sessions the integrated microscope was attached to the baseplate (Part number 1050-002192, Inscopix, Palo Alto, California) and fixed in place by the baseplate set screw. Habituation sessions lasted between 5 and 30 min for at least 3 days. Following habituation, mice were placed in a 30 × 30 cm open field box (Phenotyper Box, Noldus, Wageningen, The Netherlands). Mice received two 30 min habituation sessions separated by at least 24 h in the box in order to habituate the mice to the box. At least 24 h following the second habituation session, mice received at least 2 days of real-time place preference (RTPP). Mice received at least one counterbalanced 30 min session each of an EX-LED RTPP and OG-LED RTPP. Minutes 0–5 and 25–30 were used to establish a pre- and post-RTPP baseline. During the RTPP portion of the session (minutes 5–25) one counterbalanced side of the chamber was assigned as the LED-paired side. Each time the mouse crossed to the LED-paired side of the chamber, LED stimulation was delivered until the mouse crossed back into the non-stimulation side. For the OG-LED RTPP mice received 1–2 s of 20 Hz OG-LED (5 ms pulse duration, 5–35 mW/mm 2 measured at the objective) every 3–4 s. These optogenetic parameters were chosen prior to the RTPP session (>24 h), by visually inspecting the effect of the OG-LED on calcium responses. The OG-LED parameters (pulse train duration and OG-LED light levels) were gradually ramped up until a robust postsynaptic effect was observed (increase in calcium activity visualized under df/f). For the EX-LED RTPP mice received 1–2 s of EX-LED (constant, 0.5–1.2 mW/mm 2 measured at the objective to mimic recording parameters) every 3–4 s. Behavior was tracked during the entire session using the Ethovision XT software (Noldus, Wageningen, The Netherlands). Percent time spent on the LED-paired side, velocity, and distance traveled was recorded via the Ethovision XT software. During the OG-LED RTPP Ca 2+ imaging was recorded during the entire 30 min. Freely behaving Ca 2+ imaging An integrated microscope (nVoke, Inscopix, Palo Alto, California) was used to image GCaMP6s in NAc neurons through an implanted 7 mm GRIN lens (Part number 1050-002179, Inscopix, Palo Alto, California). Grayscale HDF5 images (12 bit) were acquired using nVoke Acquisition Software (version 2.1, Inscopix, Palo Alto, California) at 15 frames per second with an average exposure time of 66.7 ms. The analog gain on the image sensor was set between 1.5 and 3.0, while the EX-LED was maintained within 0.5–1.2 mW/mm 2 (measured from the bottom of the objective). Ca 2+ imaging, optogenetic activation, and behavior was time-stamped and synchronized.
Image processing
All image processing was performed using Mosaic Software (version 1.2, Inscopix, Palo Alto, California). First, a spatial downsampling of 2 was applied to each movie to reduce the file size and decrease the processing time. To enable parallelization, each movie was broken into 30 s segments. Background subtraction was performed on each segment using a spatial bandpassing Gaussian filter. Each segment was motion corrected with TurboReg (Thévenaz et al., 1998 ), using the mean image over time as the reference image. Any recording session that exhibited translational motion of more than 20 pixels was discarded from analysis. In a subset of the recordings, motion artifacts 0.60. Traces were re-computed for the merged ROIs. For some movies, ROIs were manually dropped if they falsely identified cells, or created for cells that were not automatically identified. GCaMP noise The GCaMP noise level was measured in each neuron from spatially bandpassed movies where the mean intensity over pixels was subtracted from each frame. To measure the noise level, the ROI for each neuron, previously obtained through PCA-ICA, was thresholded such that all pixels in the ROI < 0.75 times the maximum pixel intensity were set to zero. The thresholded ROI was then applied to the spatially bandpassed movie to produce a trace. The median absolute deviation of the trace was measured, in units of counts, and was used as the GCaMP noise level for that neuron.
Detection of OG-stimulated cells
An encoder analysis was performed to determine which cells were responsive to OG stimulation. The encoder is a modified temporal receptive field (Theunissen et al., 2000 ) that translated the recent history of OG stimulation into a prediction of DF/F activity for a given cell. First, the OG stimulation onset times were transformed into a binary temporal sequence, where a 1 denoted the onset of 1 s of 20 Hz stimulation, and left to be zero otherwise. A linear filter encoder was then fit to predict the value of a trace at time t from the preceding ~6 s of OG onsets. The encoder was fit using cross validated Ridge regression. Ten different ridge parameters were tried, logarithmically spaced from 10 −2 to 10 5 . For each ridge parameter, 10-fold cross validation was performed on the dataset. The R2 was computed on each holdout set, and the average R 2 was computed across holdout sets. The ridge parameter that produced the highest average R 2 was chosen as optimal, and the average R 2 for that parameter was used as the overall performance metric for that cell. Cells that exhibited an R 2 ≥ 0.05 and an event rate >0.01 Hz were considered “OG-stimulated.”
Statistical analysis
Results are expressed as mean ± SEM. All analysis were performed using MATLAB and Graphpad Prism. Data was analyzed using paired t- tests, unpaired t- tests, and repeated-measures one-way ANOVAs where applicable. Significance levels: * p < 0.05 ** p < 0.01. D'Agostino-Pearson or Shapiro–Wilk (for data sets with lower sample sizes) were used to check for normality prior to any significance test. All data demonstrated normality.
Supplementary material The Supplementary Material for this article can be found online at: https://www.frontiersin.org/articles/10.3389/fnins.2018.00496/full#supplementary-material Movie S1 Representative synchronized in vivo Ca 2+ , optogenetic, and behavior movie demonstrating OG-modulated Ca 2+ activity in NAc neurons during BLA-to-NAc activation. DF/F Ca 2+ movie synched with behavioral video from the RTPP task. NAc neurons display enhanced Ca 2+ activity during optogenetic activation. Click here for additional data file. Figure S1 EX-LED is stable during OG-LED light pulses. Ex-vivo EX-LED measurements of light output in response to 30 s pulses of 10 mW/mm 2 OG-LED (100% duty cycle). Measured EX-LED output ranged from 0.995 to 1.007 mW/mm 2 when set to 1 mW/mm 2 . Click here for additional data file. Figure S2 EX-LED induces robust depolarization of somas expressing ChrimsonR at typical imaging irradiances. (A) AAV5-Syn-ChrimsonR-tdTom was injected into the somatosensory cortex. Changes in depolarization were measured from cortical neurons expressing ChrimsonR in response to LEDs filtered with the EX- and OG-LED excitation filters. (B) Representative traces showing current in a neuron expressing ChrimsonR in response to 0.4 mW/mm 2 of OG-LED stimulation and 0.4 mW/mm 2 of EX-LED stimulation. (C) Quantification of changes in current (pA) during OG-LED and EX-LED light pulses. (Data points, mean ± SEM; n = 11 neurons). (D) Representative traces showing voltage in a neuron expressing ChrimsonR in response to 0.4 mW/mm 2 of OG-LED stimulation and 0.4 mW/mm 2 of EX-LED stimulation. (E) Quantification of number of spikes during OG-LED and EX-LED light pulses. (Data points, mean ± SEM; n = 8 neurons). (F) Quantification of number of spikes as a percentage of OG-LED (Spikes = (EX-LED Spikes/OG-LED Spikes) * 100; Data points, mean ± SEM; n = 8 neurons). All error bars are SEM. Click here for additional data file. Figure S3 EX-LED induces minimal hyperpolarization of somas expressing NpHR3.0 at typical imaging irradiances. (A) AAV5-CamKIIa-NpHR3.0-mCherry was injected into the somatosensory cortex. Changes in hyperpolarization were measured from cortical neurons expressing NpHR3.0 in response to LEDs filtered with the EX- and OG-LED excitation filters. (B) Representative traces showing current in a neuron expressing NpHR3.0 in response 1.0 mW/mm 2 of OG-LED stimulation and 1.0 mW/mm 2 of EX-LED stimulation. (C) Quantification of changes in current (pA) during OG-LED and EX-LED light pulses. (Data points, mean ± SEM; n = 9 neurons). (D) Representative traces showing voltage in a neuron expressing NpHR3.0 in response to a 200 pA current step (baseline) followed by a 200 pA current step combined with 1.0 mW/mm 2 of OG-LED stimulation (left) and 1.0 mW/mm 2 of EX-LED stimulation (right). (E) Quantification of % inhibition during OG-LED and EX-LED light pulses [% Inhibition = ((baseline spikes – LED spikes)/baseline spikes × 100) Data points, mean ± SEM; n = 7 neurons]. All error bars are SEM. Click here for additional data file. Figure S4 EX-LED induces minimal hyperpolarization of somas expressing Jaws at typical imaging irradiances. (A) AAV5-CamKIIa-Jaws-KCG-GFP-ER2 was injected into the somatosensory cortex. Changes in hyperpolarization were measured from cortical neurons expressing Jaws in response to LEDs filtered with the EX- and OG-LED excitation filters. (B) Representative traces showing current in a neuron expressing Jaws in response 1.0 mW/mm 2 of OG-LED stimulation and 1.0 mW/mm 2 of EX-LED stimulation. (C) Quantification of changes in current (pA) during OG-LED and EX-LED light pulses. (Data points, mean ± SEM; n = 7 neurons). (D) Representative traces showing voltage in a neuron expressing Jaws in response to a 200 pA current step (baseline) followed by a 200 pA current step combined with 1.0 mW/mm 2 of OG-LED stimulation (left) and 1.0 mW/mm 2 of EX-LED stimulation (right). (E) Quantification of % inhibition during OG-LED and EX-LED light pulses [% Inhibition = ((baseline spikes – LED spikes)/baseline spikes × 100) Data points, mean ± SEM; n = 7 neurons]. All error bars are SEM. Click here for additional data file. Figure S5 Various OG-LED optogenetic pulse parameters change the temperature of brain slices
📊 Figures
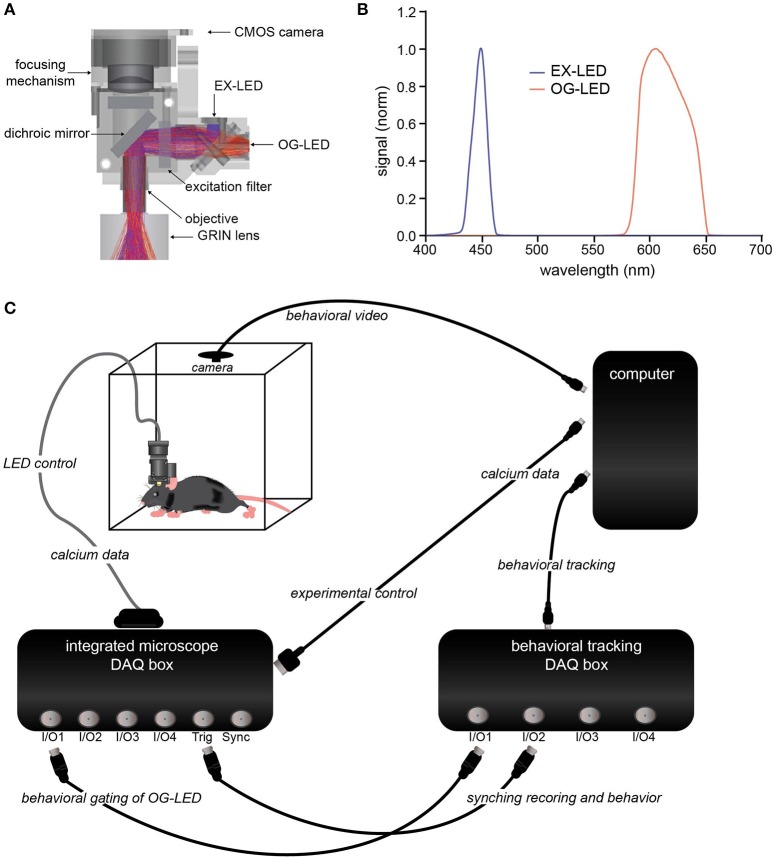
Figure 1
Integrated optogenetic and Ca 2+ imaging system. (A) Cross-section schematic of the integrated optogenetic and Ca 2+ imaging system detailing the filter design and the Ca 2+ imaging LED (EX-LED) and o...
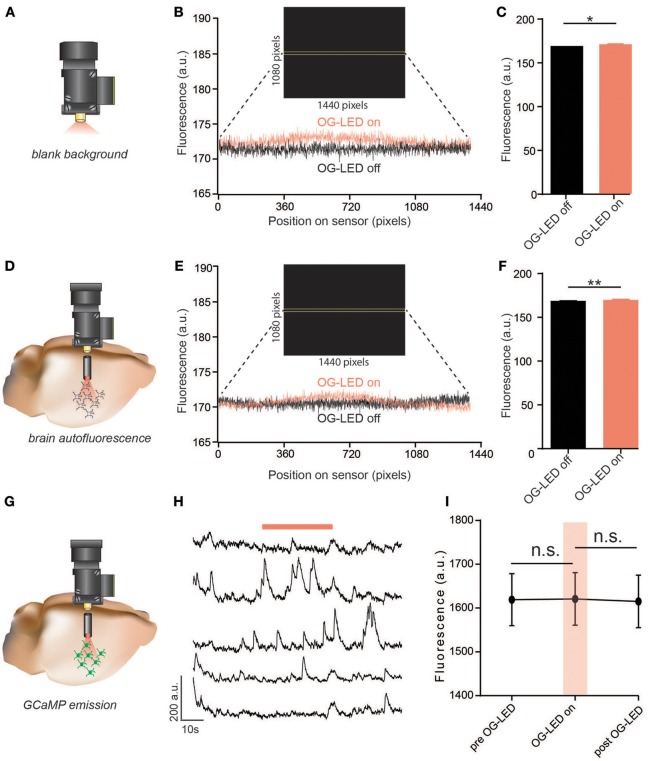
Figure 2
Exposure to OG-LED results in minimal fluorescence emission from microscope, lens, brain tissue, or GCaMP. (A) Schematic of ex-vivo OG-LED optical crosstalk measurements. The microscope was aimed into...
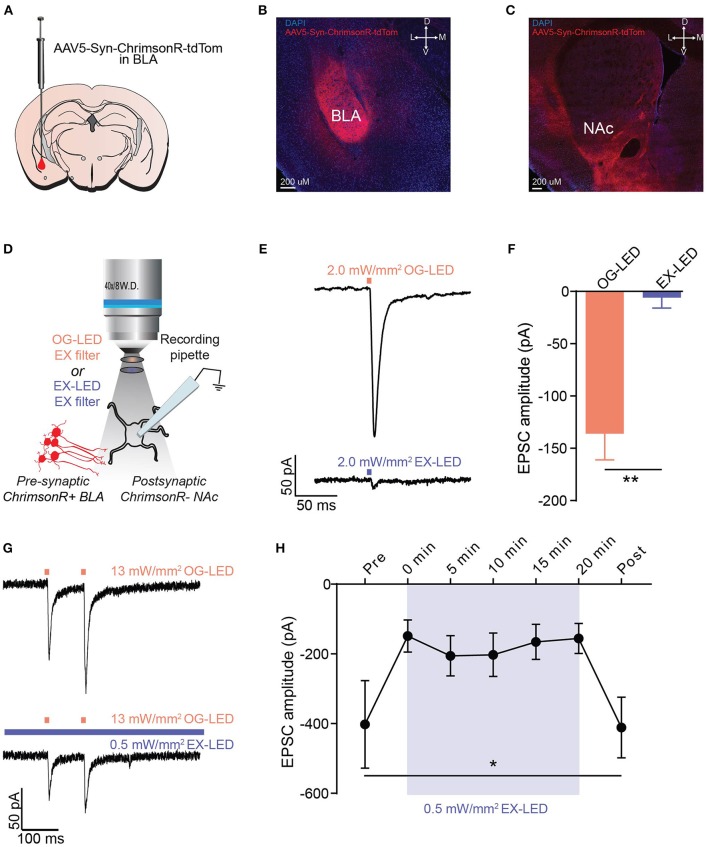
Figure 3
EX-LED has modest effects on pre-synaptic terminals expressing ChrimsonR. (A) Schematic of AAV5-Syn-ChrimsonR-tdTom injection into the BLA. (B) DAPI stained coronal section showing ChrimsonR-tdTom (re...
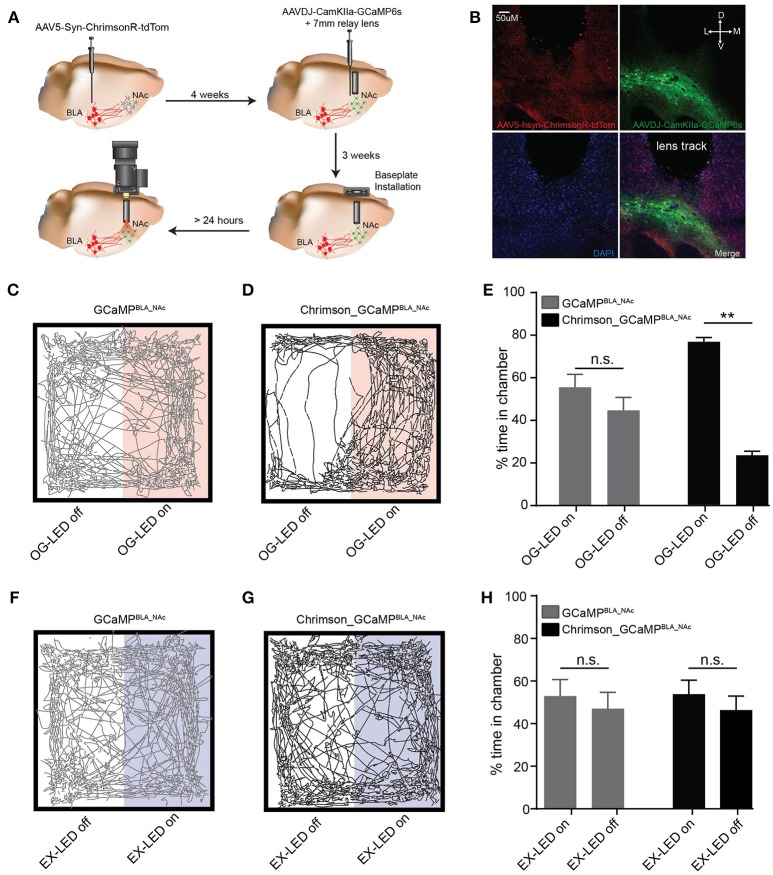
Figure 4
In vivo activation of BLA-to-NAc circuit using an integrated microscope produces a rewarding phenotype. (A) Schematic of surgical workflow for in vivo simultaneous imaging and optogenetic experiments....
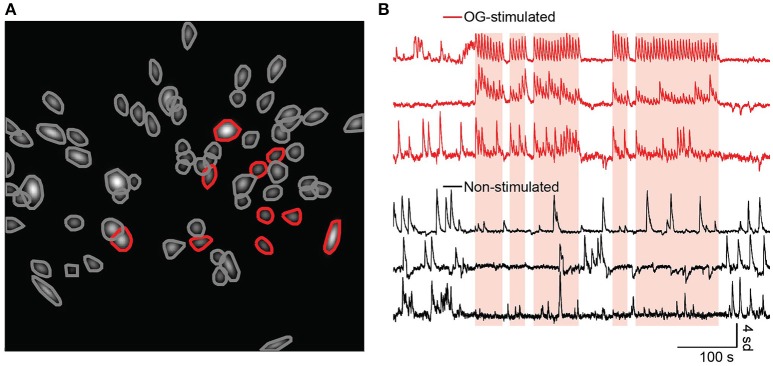
Figure 5
A subset of NAc neurons show an increase in Ca 2+ activity following optogenetic activation of the BLA-to-NAc circuit. (A) ROIs fit with 2D Gaussians identified from representative Chrimson_GCaMP BLA_...
Figure images are served from the NIH/NLM PubMed Central Open Access Subset or Europe PMC; copyright remains with the publishers and authors.
💬 Discussion
0 commentsNo comments yet. Be the first to start a discussion!
Leave a Comment