Abstract
AbstractZn2+ plays important roles in metabolism and signaling regulation. Subcellular Zn2+ compartmentalization is essential for organelle functions and cell biology, but there is currently no method to determine Zn2+ signaling relationships among more than two different organelles with one probe. Here, we report simultaneous Zn2+ tracking in multiple organelles (Zn-STIMO), a method that uses structured illumination microscopy (SIM) and a single Zn2+ fluorescent probe, allowing super-resolution morphology-correlated organelle identification in living cells. To guarantee SIM imaging quality for organelle identification, we develop a new turn-on Zn2+ fluorescent probe, NapBu-BPEA, by regulating the lipophilicity of naphthalimide-derived Zn2+ probes to make it accumulate in multiple organelles except the nucleus. Zn-STIMO with this probe shows that CCCP-induced mitophagy in HeLa cells is associated with labile Zn2+ enhancement. Therefore, direct organelle identification supported by SIM imaging makes Zn-STIMO a reliable method to determine labile Zn2+ dynamics in various organelles with one probe. Finally, SIM imaging of pluripotent stem cell-derived organoids with NapBu-BPEA demonstrates the potential of super-resolution morphology-correlated organelle identification to track biospecies and events in specific organelles within organoids.
🔬 Techniques
🔭 Microscopes
✨ Fluorophores
🧪 Sample Preparation
🔬 Cell Lines
🏭 Microscope Brands
🧪 Reagent Suppliers
💻 Software Details
🏛️ Research Organizations (ROR)
Affiliated research institutions:
📋 Methods
Materials and instrument All solvents and reagents are of analytical grade and used without further purification. 4-Bromo-1, 8-naphthalic anhydride, n -butylamine, ethylenediamine, picolyl chloride, and Ru(bpy) 3 2+ were purchased from Energy Chemical Inc (Shanghai, China). KCl, CaCl 2 , MgCl 2 , NaCl, FeSO 4 , FeCl 3 , Zn(NO 3 ) 2 , NiCl 2 , CdCl 2 , MnCl 2 , BaCl 2 , CrCl 3 , Al 3 (SO 4 ) 2 , and Pb(NO 3 ) 2 were purchased from Sinopharm Chemical Reagent (Nanjing, China). Carbonyl cyanide m-chlorophenylhydrazone (CCCP), ethylenebis (oxyethylenenitrilo) tetraacetic acid (EGTA) and 2-[4-(2-hydroxyethyl)-1-piperazinyl]ethanesulfonic acid (HEPES) were purchased from Sigma (Shanghai, China). Pyrithione sodium salt, N, N, N′, N′-tetrakis(2-pyridylmethyl)ethylenediamine were obtained from Fisher Scientific Inc (OH, USA). MitoTracker™ Green FM (MTG), MitoTracker™ DeepRed FM, LysoTracker™ Red DND-99 (LTR), ER-Tracker™ Red and Hoechst 33258 were purchased from Invitrogen (OH, USA). Autophagosome Detection dye (DAPRed) and Cytoxicity LDH Assy Kit-WST were purchased from Dojindo (Washington, USA). The cell culture medium, Dulbecco’s Modified Eagle Medium (DMEM) and Earle’s Balanced Salt Solution (EBSS, calcium, magnesium, phenol red) were bought from Gibco (OH, USA). The 1 H NMR and 13 C NMR spectra were determined with a 400 M Bruker spectrometer with TMS as internal standard. High-Resolution Mass spectrometric data were recorded on an Agilent 6540 Q-TOF mass spectrometer. The UV-Vis and fluorescence spectra were performed on PerkinElmer Lambda 35 spectrophotometer and Horiba FM-4 fluorophotometer. The cell imaging was carried out by Nikon N-SIM system. Synthesis of 4-bromo- N -n-butyl-1, 8-naphthalimide (1) 64 1 H NMR (400 MHz, Chloroform- d ) δ 8.66 (dd, J = 7.3, 1.1 Hz, 1H), 8.57 (dd, J = 8.5, 1.2 Hz, 1H), 8.42 (d, J = 7.8 Hz, 1H), 8.04 (d, J = 7.9 Hz, 1H), 7.85 (dd, J = 8.5, 7.3 Hz, 1H), 4.24–4.06 (m, 2H), 1.83–1.62 (m, 2H), 1.52–1.34 (m, 2H), 0.98 (t, J = 7.3 Hz, 3H). Synthesis of N -n-butyl-4-(aminoethylene) amino-1, 8-naphthalimide (2) 64 1 H NMR (400 MHz, Chloroform- d ) δ 8.59 (dd, J = 7.3, 1.1 Hz, 1H), 8.47 (d, J = 8.4 Hz, 1H), 8.17 (dd, J = 8.5, 1.1 Hz, 1H), 7.63 (dd, J = 8.4, 7.3 Hz, 1H), 6.71 (d, J = 8.5 Hz, 1H), 6.14 (s, 1H), 4.21–4.12 (m, 2H), 3.42 (q, J = 5.3 Hz, 2H), 3.18 (dd, J = 6.7, 4.9 Hz, 2H), 1.79–1.69 (m, 2H), 1.51–1.38 (m, 2H), 0.97 (t, J = 7.3 Hz, 3H). Synthesis of 2,4-(bis(pyridin-2-ylmethyl)aminoethyl)amino- N -n-butyl-1,8-naphthalimide (NapBu–BPEA) 65 In all, 200 mg (0.64 mmol) compound 2 , 300 mg K 2 CO 3 , and 330 mg (2.6 mmol) picolyl chloride were dissolved in 20 mL dry ethanol. The mixture was stirred and refluxed for 10 h under N 2 . The reaction process was monitored by TLC. The solvent was evaporated by under reduced pressure, once the reaction was completed. Then the crude product was purified by silica gel column chromatography (CH 2 Cl 2 : CH 3 OH = 20:1) to obtain a yellow solid with 24.6% yield (70 mg). 1 H NMR (400 MHz, Methanol- d 4 ) δ 8.59 (dd, J = 8.4, 1.2 Hz, 1H), 8.50 (d, J = 7.3 Hz, 1H), 8.42 (dd, J = 5.0, 1.3 Hz, 2H), 8.17 (d, J = 8.5 Hz, 1H), 7.68 (dd, J = 8.4, 7.3 Hz, 1H), 7.51–7.47 (m, 4H), 7.14 (ddd, J = 6.6, 5.2, 2.4 Hz, 2H), 6.51 (d, J = 8.5 Hz, 1H), 4.15–4.03 (m, 2H), 3.88 (s, 4H), 3.52 (t, J = 5.9 Hz, 2H), 2.92 (t, J = 5.9 Hz, 2H), 1.67 (tt, J = 8.0, 6.4 Hz, 2H), 1.42 (q, J = 7.5 Hz, 2H), and 0.99 (t, J = 7.3 Hz, 3H). 13 C NMR (101 MHz, Methanol- d 4 ) δ 166.25, 165.72, 160.27, 152.30, 149.61, 138.51, 135.86, 132.22, 131.27, 129.50, 125.49, 125.25, 123.79, 123.46, 122.00, 109.23, 105.12, 61.16, 53.19, 49.68, 49.54, 49.47, 49.32, 49.25, 49.04, 48.83, 48.69, 48.62, 48.40, 41.88, 40.84, 31.43, 21.42, and 14.28. HR-MS(positive mode): Calcd. 494.2551, Found. 494.2649. Spectroscopic study The stock solution of NapBu–BPEA (10 mM) was prepared with DMSO of HPLC pure grade, and stored at −20 °C. The work solutions of this probe for spectroscopic study were prepared by diluting this stock solution to the final concentration of 10 μM with 3 mL HEPES buffer (50 mM, 100 mM KNO 3 , 10% DMSO, pH 7.2) in quartz cuvettes with 1 cm path lengths. All fluorescent spectra were recorded upon excitation at 450 nm. The Zn 2+ titration UV-vis and fluorescent spectra were recorded by adding aliquots of Zn 2+ solution into the probe work solution (10 μM). The detection limit of NapBu–BPEA was determined by recording the fluorescence spectra of NapBu–BPEA for six times to obtain the background noise (σ). The probe’s fluorescent sensing selectivity of NapBu–BPEA were determined by recording fluorescence spectra after adding metal cation (1000 eq K + , Na + , Ca 2+ ,Mg 2+ ; 1 eq Cd 2+ , Ni 2+ , Cr 3+ , Pb 2+ , Al 3+ , Co 2+ , Fe 2+ , Fe 3+ , Ba 2+ , Mn 2+ ) to the NapBu–BPEA solution. The fluorescence quantum yields were determined by using Ru(bpy) 3 2+ ( Φ = 0.04) in DMSO/HEPES ( v:v , 1:9) as the reference. To determine binding constant, various amounts of Zn(NO 3 ) 2 (0~9 mM) were added to NapBu–BPEA solution buffered with DMSO/HEPES (50 mM, pH 7.21, 100 mM KNO 3 ) containing 10 mM EGTA. The probe’s fluorescence spectra at different pH were measured by recording the spectra of NapBu–BPEA solution in the presence of Zn 2+ at different pH adjusted with KOH and HCl. Cell culture Wild-type, FIP 200 and ATG KO HeLa cell lines were gifted from Dr. Jun-Lin Guan’s lab (University of Cincinnati). Cells were cultured in DMEM supplemented with 10% FBS and 100 U/mL penicillin–streptomycin (Gibco) in 5% CO 2 incubator at 37 °C.
Show full methods section
Materials and instrument All solvents and reagents are of analytical grade and used without further purification. 4-Bromo-1, 8-naphthalic anhydride, n -butylamine, ethylenediamine, picolyl chloride, and Ru(bpy) 3 2+ were purchased from Energy Chemical Inc (Shanghai, China). KCl, CaCl 2 , MgCl 2 , NaCl, FeSO 4 , FeCl 3 , Zn(NO 3 ) 2 , NiCl 2 , CdCl 2 , MnCl 2 , BaCl 2 , CrCl 3 , Al 3 (SO 4 ) 2 , and Pb(NO 3 ) 2 were purchased from Sinopharm Chemical Reagent (Nanjing, China). Carbonyl cyanide m-chlorophenylhydrazone (CCCP), ethylenebis (oxyethylenenitrilo) tetraacetic acid (EGTA) and 2-[4-(2-hydroxyethyl)-1-piperazinyl]ethanesulfonic acid (HEPES) were purchased from Sigma (Shanghai, China). Pyrithione sodium salt, N, N, N′, N′-tetrakis(2-pyridylmethyl)ethylenediamine were obtained from Fisher Scientific Inc (OH, USA). MitoTracker™ Green FM (MTG), MitoTracker™ DeepRed FM, LysoTracker™ Red DND-99 (LTR), ER-Tracker™ Red and Hoechst 33258 were purchased from Invitrogen (OH, USA). Autophagosome Detection dye (DAPRed) and Cytoxicity LDH Assy Kit-WST were purchased from Dojindo (Washington, USA). The cell culture medium, Dulbecco’s Modified Eagle Medium (DMEM) and Earle’s Balanced Salt Solution (EBSS, calcium, magnesium, phenol red) were bought from Gibco (OH, USA). The 1 H NMR and 13 C NMR spectra were determined with a 400 M Bruker spectrometer with TMS as internal standard. High-Resolution Mass spectrometric data were recorded on an Agilent 6540 Q-TOF mass spectrometer. The UV-Vis and fluorescence spectra were performed on PerkinElmer Lambda 35 spectrophotometer and Horiba FM-4 fluorophotometer. The cell imaging was carried out by Nikon N-SIM system. Synthesis of 4-bromo- N -n-butyl-1, 8-naphthalimide (1) 64 1 H NMR (400 MHz, Chloroform- d ) δ 8.66 (dd, J = 7.3, 1.1 Hz, 1H), 8.57 (dd, J = 8.5, 1.2 Hz, 1H), 8.42 (d, J = 7.8 Hz, 1H), 8.04 (d, J = 7.9 Hz, 1H), 7.85 (dd, J = 8.5, 7.3 Hz, 1H), 4.24–4.06 (m, 2H), 1.83–1.62 (m, 2H), 1.52–1.34 (m, 2H), 0.98 (t, J = 7.3 Hz, 3H). Synthesis of N -n-butyl-4-(aminoethylene) amino-1, 8-naphthalimide (2) 64 1 H NMR (400 MHz, Chloroform- d ) δ 8.59 (dd, J = 7.3, 1.1 Hz, 1H), 8.47 (d, J = 8.4 Hz, 1H), 8.17 (dd, J = 8.5, 1.1 Hz, 1H), 7.63 (dd, J = 8.4, 7.3 Hz, 1H), 6.71 (d, J = 8.5 Hz, 1H), 6.14 (s, 1H), 4.21–4.12 (m, 2H), 3.42 (q, J = 5.3 Hz, 2H), 3.18 (dd, J = 6.7, 4.9 Hz, 2H), 1.79–1.69 (m, 2H), 1.51–1.38 (m, 2H), 0.97 (t, J = 7.3 Hz, 3H). Synthesis of 2,4-(bis(pyridin-2-ylmethyl)aminoethyl)amino- N -n-butyl-1,8-naphthalimide (NapBu–BPEA) 65 In all, 200 mg (0.64 mmol) compound 2 , 300 mg K 2 CO 3 , and 330 mg (2.6 mmol) picolyl chloride were dissolved in 20 mL dry ethanol. The mixture was stirred and refluxed for 10 h under N 2 . The reaction process was monitored by TLC. The solvent was evaporated by under reduced pressure, once the reaction was completed. Then the crude product was purified by silica gel column chromatography (CH 2 Cl 2 : CH 3 OH = 20:1) to obtain a yellow solid with 24.6% yield (70 mg). 1 H NMR (400 MHz, Methanol- d 4 ) δ 8.59 (dd, J = 8.4, 1.2 Hz, 1H), 8.50 (d, J = 7.3 Hz, 1H), 8.42 (dd, J = 5.0, 1.3 Hz, 2H), 8.17 (d, J = 8.5 Hz, 1H), 7.68 (dd, J = 8.4, 7.3 Hz, 1H), 7.51–7.47 (m, 4H), 7.14 (ddd, J = 6.6, 5.2, 2.4 Hz, 2H), 6.51 (d, J = 8.5 Hz, 1H), 4.15–4.03 (m, 2H), 3.88 (s, 4H), 3.52 (t, J = 5.9 Hz, 2H), 2.92 (t, J = 5.9 Hz, 2H), 1.67 (tt, J = 8.0, 6.4 Hz, 2H), 1.42 (q, J = 7.5 Hz, 2H), and 0.99 (t, J = 7.3 Hz, 3H). 13 C NMR (101 MHz, Methanol- d 4 ) δ 166.25, 165.72, 160.27, 152.30, 149.61, 138.51, 135.86, 132.22, 131.27, 129.50, 125.49, 125.25, 123.79, 123.46, 122.00, 109.23, 105.12, 61.16, 53.19, 49.68, 49.54, 49.47, 49.32, 49.25, 49.04, 48.83, 48.69, 48.62, 48.40, 41.88, 40.84, 31.43, 21.42, and 14.28. HR-MS(positive mode): Calcd. 494.2551, Found. 494.2649. Spectroscopic study The stock solution of NapBu–BPEA (10 mM) was prepared with DMSO of HPLC pure grade, and stored at −20 °C. The work solutions of this probe for spectroscopic study were prepared by diluting this stock solution to the final concentration of 10 μM with 3 mL HEPES buffer (50 mM, 100 mM KNO 3 , 10% DMSO, pH 7.2) in quartz cuvettes with 1 cm path lengths. All fluorescent spectra were recorded upon excitation at 450 nm. The Zn 2+ titration UV-vis and fluorescent spectra were recorded by adding aliquots of Zn 2+ solution into the probe work solution (10 μM). The detection limit of NapBu–BPEA was determined by recording the fluorescence spectra of NapBu–BPEA for six times to obtain the background noise (σ). The probe’s fluorescent sensing selectivity of NapBu–BPEA were determined by recording fluorescence spectra after adding metal cation (1000 eq K + , Na + , Ca 2+ ,Mg 2+ ; 1 eq Cd 2+ , Ni 2+ , Cr 3+ , Pb 2+ , Al 3+ , Co 2+ , Fe 2+ , Fe 3+ , Ba 2+ , Mn 2+ ) to the NapBu–BPEA solution. The fluorescence quantum yields were determined by using Ru(bpy) 3 2+ ( Φ = 0.04) in DMSO/HEPES ( v:v , 1:9) as the reference. To determine binding constant, various amounts of Zn(NO 3 ) 2 (0~9 mM) were added to NapBu–BPEA solution buffered with DMSO/HEPES (50 mM, pH 7.21, 100 mM KNO 3 ) containing 10 mM EGTA. The probe’s fluorescence spectra at different pH were measured by recording the spectra of NapBu–BPEA solution in the presence of Zn 2+ at different pH adjusted with KOH and HCl. Cell culture Wild-type, FIP 200 and ATG KO HeLa cell lines were gifted from Dr. Jun-Lin Guan’s lab (University of Cincinnati). Cells were cultured in DMEM supplemented with 10% FBS and 100 U/mL penicillin–streptomycin (Gibco) in 5% CO 2 incubator at 37 °C.
Organoid culture
Human induced pluripotent stem cells (iPSCs) were differentiated into foregut using previously described method 56 . In brief, hiPSCs were detached by Accutase (Thermo Fisher Scientific Inc., MA, USA) and were seeded on Laminin coated tissue culture plate with 100,000 cells/cm 2 . Medium was changed to RPMI 1640 medium (Life Technologies) containing 100 ng/mL Activin A (R&D Systems) and 50 ng/mL bone morphogenetic protein 4 (BMP4; R&D Systems) at day 1, 100 ng/mL Activin A and 0.2% fetal calf serum (FCS; Thermo Fisher Scientific Inc.) at day 2, and 100 ng/mL Activin A and 2% FCS at day 3. On day 4–6, cells were cultured in Advanced DMEM/F12 (Thermo Fisher Scientific Inc.) with B27 (Life Technologies) and N2 (Gibco, CA, USA) containing 500 ng/mL fibroblast growth factor (FGF4; R&D Systems) and 3 µM CHIR99021 (Stemgent, MA, USA). Cells were maintained at 37 °C in 5% CO 2 with 95% air and the medium was replaced every day. The foregut cells were detached by Accutase and then centrifuged at 1200 rpm for 3 min. Cells were resuspended in Matrigel (Corning, In., NY, USA). A total of 100,000 cells were embedded in 50 µL Matrigel drop on the dishes in organoid formation media with 5 factors for 4 days. After organoid formation, the media was switched to liver specification media for 4 days. After the liver specification step, organoids were harvested from Matrigel by scratching and pipetting. Then organoids were re-embedded in Matrigel on the Ultra-low attached plate (Corning) in liver maturation media for 10 days. Cultures for HLO induction were maintained at 37 °C in 5% CO 2 with 95% air and the medium was added every 2 days. Nikon SIM super-resolution imaging The SIM images were acquired using a Nikon N-SIM system. The blue imaging channel for Hoechst 33258 with emission bandwidth at 420–495 nm upon excitation at 405 nm, the green imaging channel for NapBu-BPEA with emission bandwidth at 500–550 nm upon excitation at 488 nm, the red imaging channel for ER-Tracker Red, LysoTracker Red and DAPRed with emission bandwidth at 570–640 nm upon excitation at 561 nm, the magenta imaging channel for MitoTracker Deep Red with emission bandwidth at 660–735 nm upon excitation at 640 nm were utilized. The imaging data analysis and thermal map construction were performed via analysis with ImageJ. The co-localization experiments were performed with a dual-channel mode. HeLa cells were stained by NapBu–BPEA (10 μM, 1 h) and then incubated with Mito-marker Deep Red (0.5 μM, 30 min), Lysotracker Red (0.1 μM, 30 min), ER-Tracker Red (1 μM, 30 min), and Hoechst 33258 (1 μg/mL, 30 min), respectively. The Pearson’s correlation coefficient was calculated using Cellprofiler with co-localization module. The intracellular Zn 2+ level in autophagy was imaged in HeLa cells. Prior to CCCP (10 μM, 24 h) or EBSS treatment (10 μM, 24 h), the cells were stained with DAPRed (1 μM, 30 min). The cells were finally stained by NapBu–BPEA (10 μM, 1 h) before SIM imaging. The fresh organoids were transferred into petri dish. After 10 μM CCCP treatment for 24 h, the organoids were incubated with 10 μM NapBu–BPEA for 2 h. Then the organoids were imaged with z stack at different depths.
Cell viability determination via WST assay
The suspension of HeLa cells diluted with 50 μL DMEM was planted into 96-well plate. The inoculated cells were pre-cultured overnight in 96-well plate and replaced with a new 50 μL DMEM. 50 μL DMEM containing different concentrations of NapBu–BPEA was added and cultured in CO 2 incubator at 37 °C for 24 h. After 10 μL Lysis Buffer was added to the high contrast wells, 30 min was cultured in the CO 2 incubator at 37 °C. After 100 μL Working Solution was added to each well, it was cultured for 0.5 h under dark and room temperature. After 50 μL Stop Solution was added to each well, the absorbance of 490 nm was determined immediately by a microplate reader (Thermomax, Molecular Devices).
Data analysis
All data were analyzed and statistically calculated using Microsoft Excel 2016 software (Microsoft, Redmond, WA). The results are expressed as mean ± standard deviation (SD) unless otherwise stated. The statistical differences between the experimental groups were analyzed by double-tailed Student’s t -test. When p < 0.05, it was considered to have statistical significance. All statistical graphs were performed using Origin 2016 (OriginLab Corporation, MA, USA).
Statistics and reproducibility
Each experiment was repeated at least three times independently with similar results. All images shown are representative results from biological replicates. Reporting summary Further information on research design is available in the Nature Research Reporting Summary linked to this article.
Materials and instrument All solvents and reagents are of analytical grade and used without further purification. 4-Bromo-1, 8-naphthalic anhydride, n -butylamine, ethylenediamine, picolyl chloride, and Ru(bpy) 3 2+ were purchased from Energy Chemical Inc (Shanghai, China). KCl, CaCl 2 , MgCl 2 , NaCl, FeSO 4 , FeCl 3 , Zn(NO 3 ) 2 , NiCl 2 , CdCl 2 , MnCl 2 , BaCl 2 , CrCl 3 , Al 3 (SO 4 ) 2 , and Pb(NO 3 ) 2 were purchased from Sinopharm Chemical Reagent (Nanjing, China). Carbonyl cyanide m-chlorophenylhydrazone (CCCP), ethylenebis (oxyethylenenitrilo) tetraacetic acid (EGTA) and 2-[4-(2-hydroxyethyl)-1-piperazinyl]ethanesulfonic acid (HEPES) were purchased from Sigma (Shanghai, China). Pyrithione sodium salt, N, N, N′, N′-tetrakis(2-pyridylmethyl)ethylenediamine were obtained from Fisher Scientific Inc (OH, USA). MitoTracker™ Green FM (MTG), MitoTracker™ DeepRed FM, LysoTracker™ Red DND-99 (LTR), ER-Tracker™ Red and Hoechst 33258 were purchased from Invitrogen (OH, USA). Autophagosome Detection dye (DAPRed) and Cytoxicity LDH Assy Kit-WST were purchased from Dojindo (Washington, USA). The cell culture medium, Dulbecco’s Modified Eagle Medium (DMEM) and Earle’s Balanced Salt Solution (EBSS, calcium, magnesium, phenol red) were bought from Gibco (OH, USA). The 1 H NMR and 13 C NMR spectra were determined with a 400 M Bruker spectrometer with TMS as internal standard. High-Resolution Mass spectrometric data were recorded on an Agilent 6540 Q-TOF mass spectrometer. The UV-Vis and fluorescence spectra were performed on PerkinElmer Lambda 35 spectrophotometer and Horiba FM-4 fluorophotometer. The cell imaging was carried out by Nikon N-SIM system.
Supplementary information Supplementary Information Peer Review File Reporting Summary
📊 Figures
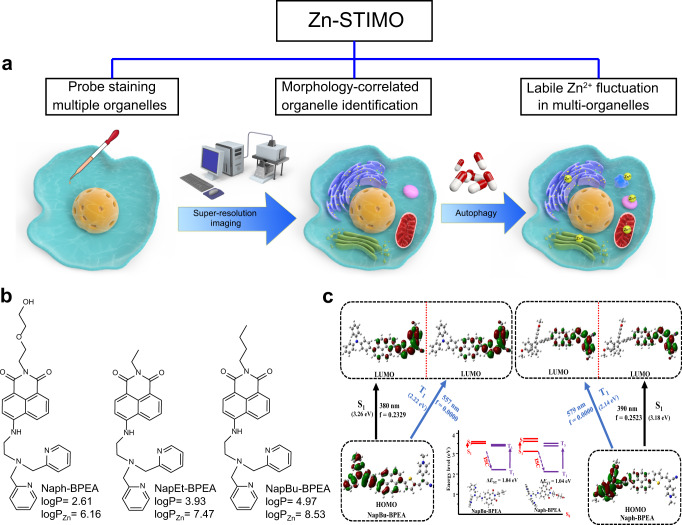
Fig. 1
Schematic illustration of Zn-STIMO and the design of probe candidate for Zn-STIMO.
a General scheme of Zn-STIMO; b fluorescent Zn 2+ probes Naph-BPEA, NapEt-BPEA, and NapBu-BPEA. LogP values are for free probes, while logP Zn values are for their zinc complexes formed with ZnCl 2 ; ...
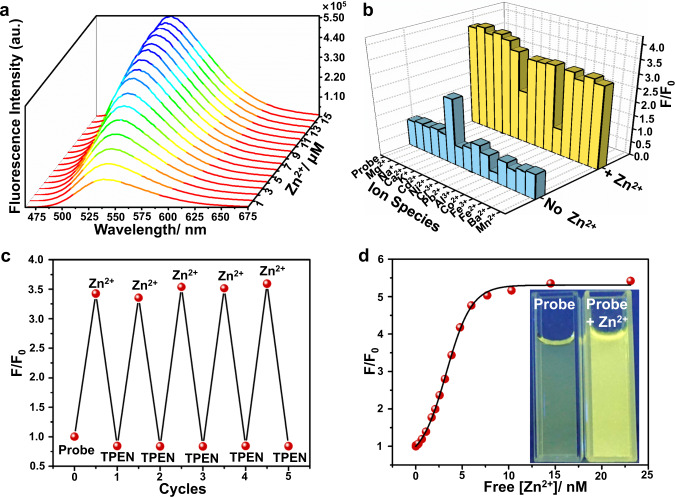
Fig. 2
NapBu-BPEA shows reversible Zn 2+ -specific sensing behavior.
Fluorescence spectroscopic determination of NapBu-BPEA (10u2009u03bcM) in HEPES buffer upon excitation at 450u2009nm. a Emission spectra determined upon Zn 2+ titration (10u2009mM, 0.3u2009u03bcL aliq...
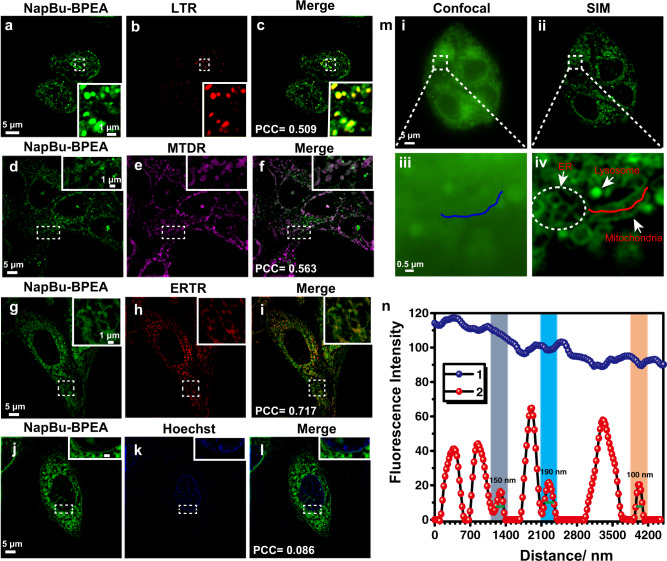
Fig. 3
NapBuu2013BPEA distributes to multiple organelles in HeLa cells.
a u2013 l SIM images for HeLa cells co-stained by NapBuu2013BPEA (10u2009u03bcM) with a u2013 c LysoTracker Red (LTR, 0.1u2009u03bcM), d u2013 f MitoTracker Deep Red (MTDR, 0.5u2009u03bcM), g u2013 i ...
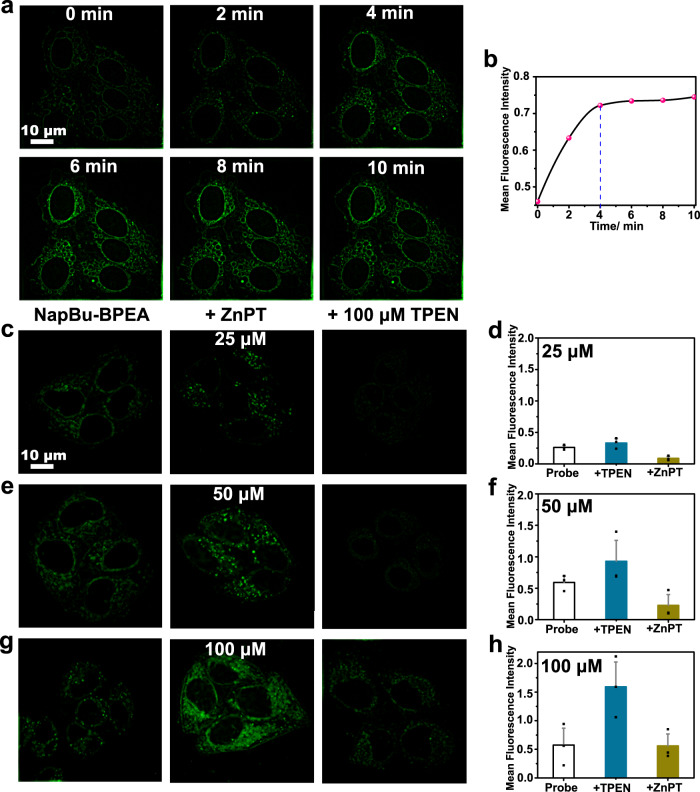
Fig. 4
NapBu-BPEA can sense intracellular labile Zn 2+ in a reversible manner.
a SIM imaging of the NapBu-BPEA-stained HeLa cells (10u2009u03bcM, 1u2009h, 37u2009u00b0C) upon incubation with 50u2009u03bcM ZnPT; and b the corresponding temporal profile of intracellular fluorescen...
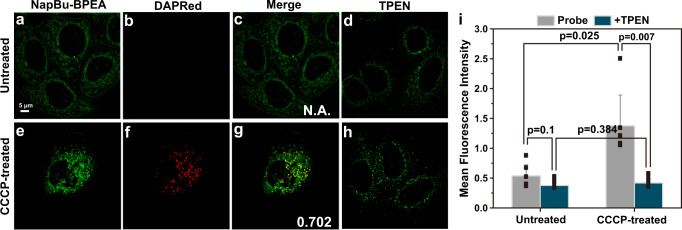
Fig. 5
NapBu-BPEA reveals labile Zn 2+ dynamics in autophagic HeLa cells.
SIM images of HeLa cells stained by NapBuu2013BPEA and DAPRed without ( a u2013 d ) or with ( e u2013 h ) CCCP (10u2009u03bcM, 24u2009h, 37u2009u00b0C) treatment. a , e cell images from the green chan...
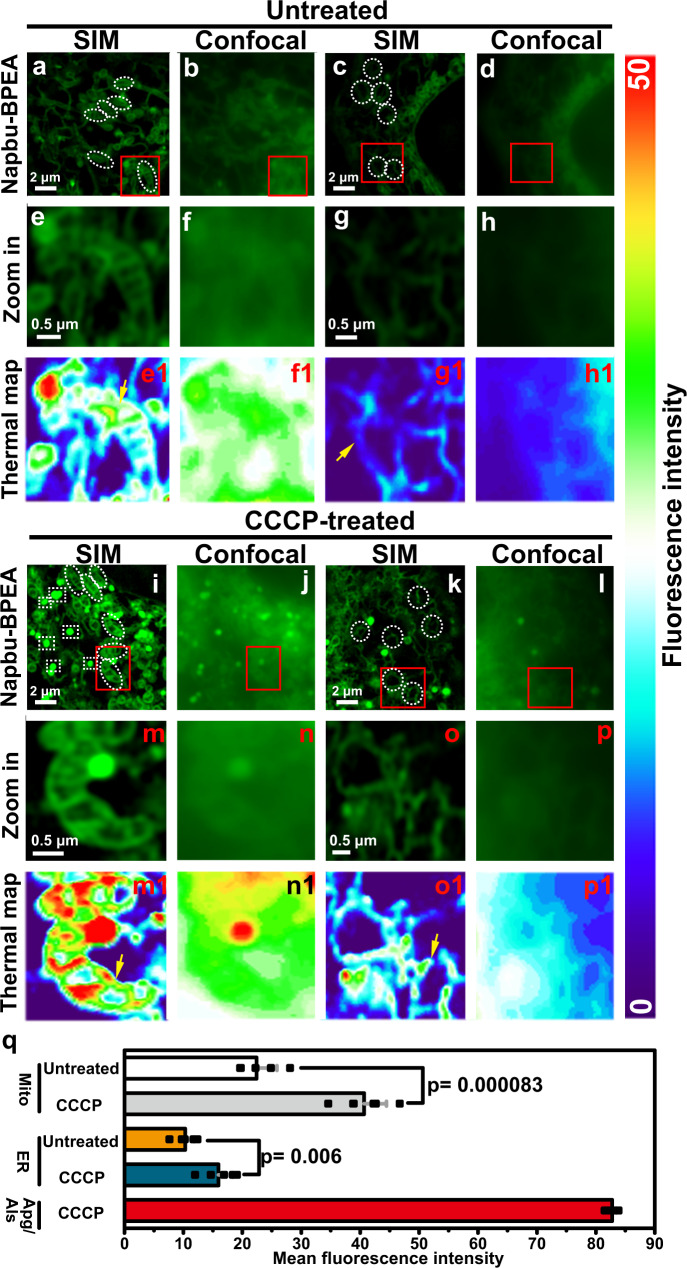
Fig. 6
Zn-STIMO reveals different labile Zn 2+ responses in mitochondria, autophagosomes/autolysosomes, and ER during autophagy.
Simultaneous Zn 2+ tracking in the mitochondria and ER of HeLa cells undergoing autophagy induced by CCCP (10u2009u03bcM, 37u2009u00b0C, 24u2009h) incubation via SIM imaging using NapBu-BPEA (10u2009u...
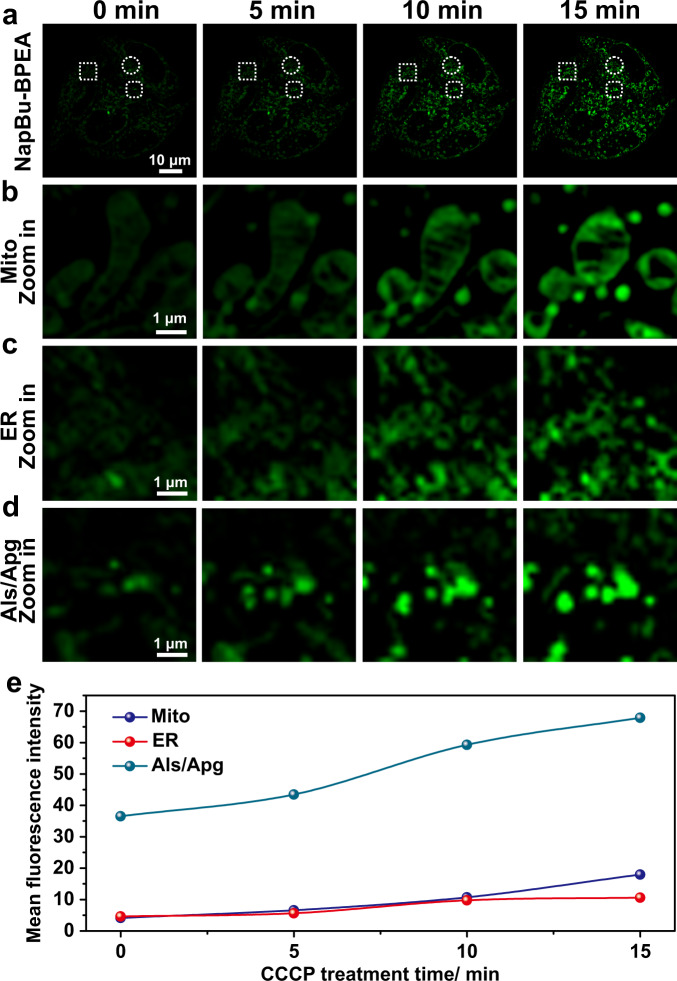
Fig. 7
NapBu-BPEA enables dynamically track of labile Zn 2+ in cells undergoing mitophagy via Zn-STIMO.
a Time-lapse SIM images of HeLa cells stained by NapBu-BPEA recorded upon incubation with 20u2009u03bcM CCCP; and zoom-in images of regions of interest marked with squares ( b , mitochondria), circles...
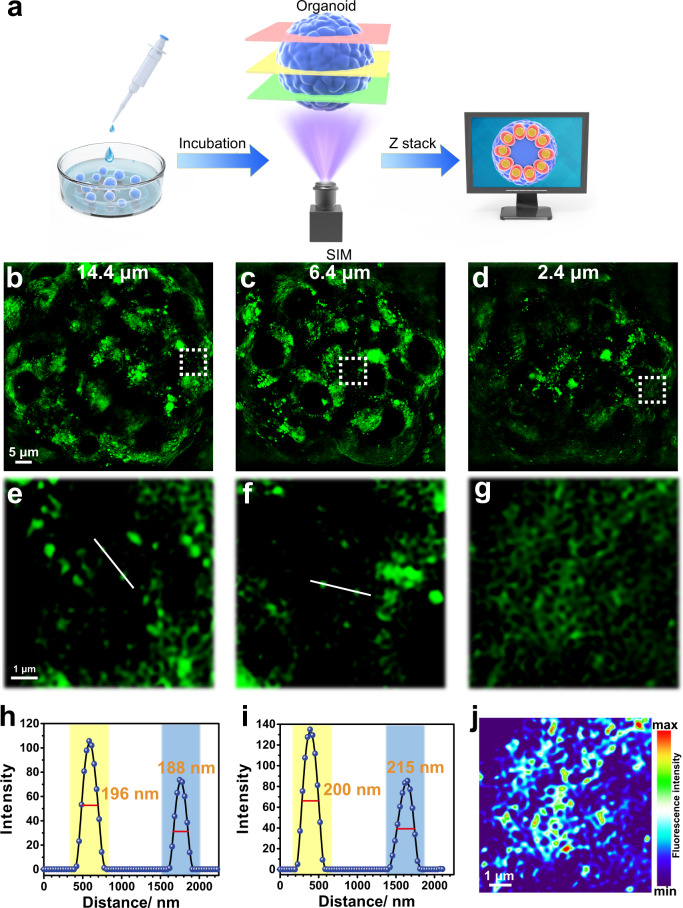
Fig. 8
NapBu-BPEA can identify organelles in liver organoids.
SIM imaging of organoids treated with CCCP for 24u2009h. a Schematic diagram of Z-stack SIM imaging for organoid; b u2013 d SIM images of organoids recorded at different imaging depths; e u2013 g enla...
Figure images are served from the NIH/NLM PubMed Central Open Access Subset or Europe PMC; copyright remains with the publishers and authors.
💬 Discussion
0 commentsNo comments yet. Be the first to start a discussion!
Leave a Comment