Abstract
Nonsense-mediated decay (NMD) is a surveillance system that degrades mRNAs containing a premature termination codon (PTC) and plays important roles in protein homeostasis and disease. The efficiency of NMD is variable, impacting the clinical outcome of genetic mutations. However, limited resolution of bulk analyses has hampered the study of NMD efficiency. Here, we develop an assay to visualize NMD of individual mRNA molecules in real time. We find that NMD occurs with equal probability during each round of translation of an mRNA molecule. However, this probability is variable and depends on the exon sequence downstream of the PTC, the PTC-to-intron distance, and the number of introns both upstream and downstream of the PTC. Additionally, a subpopulation of mRNAs can escape NMD, further contributing to variation in NMD efficiency. Our study uncovers real-time dynamics of NMD, reveals key mechanisms that influence NMD efficiency, and provides a powerful method to study NMD.
🔬 Techniques
🔭 Microscopes
💻 Software
✨ Fluorophores
🧪 Sample Preparation
🔬 Cell Lines
🏭 Microscope Brands
🧪 Reagent Suppliers
📷 Detectors
🔎 Objectives
💻 Software Details
💾 Data Repositories
🏛️ Research Organizations (ROR)
Affiliated research institutions:
📋 Methods
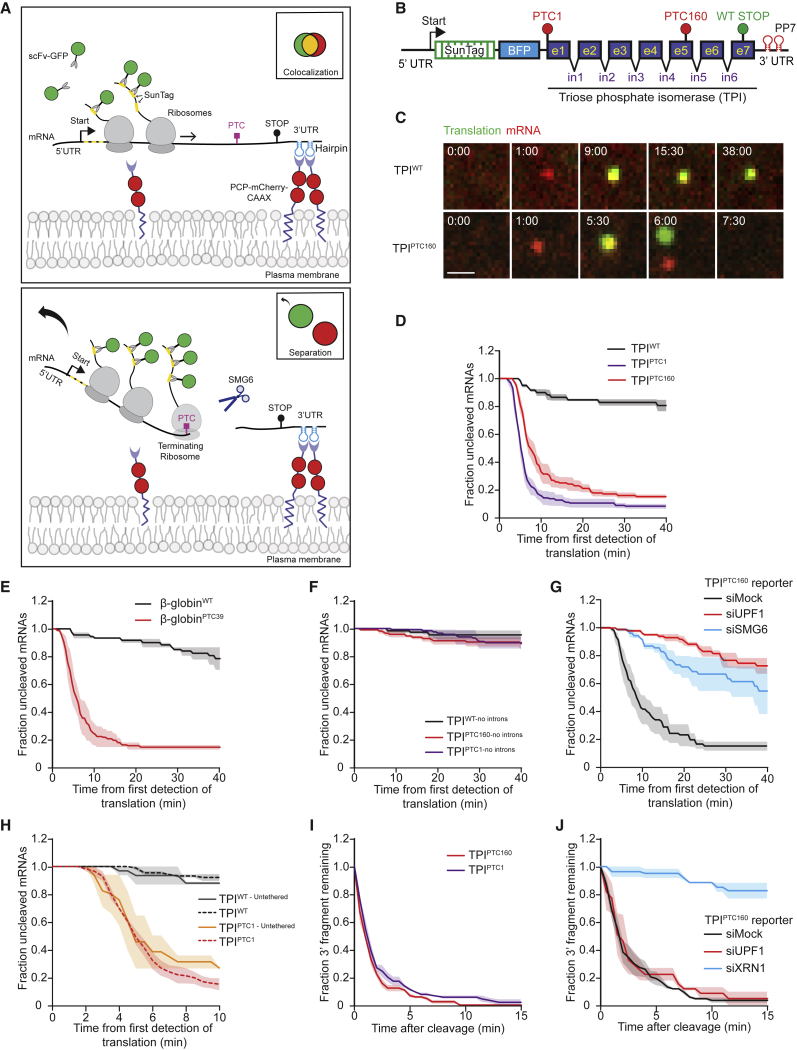
SunTag Translation Imaging—A Method to Study NMD A major strength of our single-molecule imaging NMD assay is that it accounts for many variable factors that can influence the steady-state mRNA levels of an NMD target. For example, delayed nuclear export or delayed translation initiation would extend the lifetime of mRNAs, making them appear less sensitive to NMD in bulk mRNA decay measurements, while our assay distinguishes between these possibilities. In addition, single-molecule measurements can uncover different mRNA subpopulations, for instance, with distinct sensitivities to NMD. Although exogenous mRNA sequence elements are required for the assay (i.e., SunTag and PP7 binding sites), we find that our NMD reporter faithfully recapitulates key aspects of NMD, including the dependence on a PTC and an EJC downstream of the PTC, a requirement for the key NMD factors UPF1 and SMG6, and exonucleolytic decay of the 3′ cleavage fragment by XRN1. We note that a small percentage of mRNAs (∼5%) is cleaved even in the absence of a PTC or EJCs, so it is possible that these mRNAs are cleaved through EJC-independent NMD or through a mechanism other than NMD. Long 3′ UTRs can stimulate NMD by increasing the distance between a PTC and the poly(A) tail ( Bühler et al., 2006 , Singh et al., 2008 , Eberle et al., 2008 ). However, for the reporters tested here, the length of the 3′ UTR did not play a major role in inducing NMD ( Figures 1 F, S2 F, S2G, S5 G, and S5H). Thus, our single-molecule imaging method faithfully recapitulates most, if not all, aspects of NMD and therefore adds a unique tool to study NMD timing, kinetics, and heterogeneity. The mRNA cleavage and exonucleolytic decay assays developed here may also be adapted to study other forms of mRNA quality control and more generally other aspects of RNA biology involving mRNA translation and decay.
Show full methods section
SunTag Translation Imaging—A Method to Study NMD A major strength of our single-molecule imaging NMD assay is that it accounts for many variable factors that can influence the steady-state mRNA levels of an NMD target. For example, delayed nuclear export or delayed translation initiation would extend the lifetime of mRNAs, making them appear less sensitive to NMD in bulk mRNA decay measurements, while our assay distinguishes between these possibilities. In addition, single-molecule measurements can uncover different mRNA subpopulations, for instance, with distinct sensitivities to NMD. Although exogenous mRNA sequence elements are required for the assay (i.e., SunTag and PP7 binding sites), we find that our NMD reporter faithfully recapitulates key aspects of NMD, including the dependence on a PTC and an EJC downstream of the PTC, a requirement for the key NMD factors UPF1 and SMG6, and exonucleolytic decay of the 3′ cleavage fragment by XRN1. We note that a small percentage of mRNAs (∼5%) is cleaved even in the absence of a PTC or EJCs, so it is possible that these mRNAs are cleaved through EJC-independent NMD or through a mechanism other than NMD. Long 3′ UTRs can stimulate NMD by increasing the distance between a PTC and the poly(A) tail ( Bühler et al., 2006 , Singh et al., 2008 , Eberle et al., 2008 ). However, for the reporters tested here, the length of the 3′ UTR did not play a major role in inducing NMD ( Figures 1 F, S2 F, S2G, S5 G, and S5H). Thus, our single-molecule imaging method faithfully recapitulates most, if not all, aspects of NMD and therefore adds a unique tool to study NMD timing, kinetics, and heterogeneity. The mRNA cleavage and exonucleolytic decay assays developed here may also be adapted to study other forms of mRNA quality control and more generally other aspects of RNA biology involving mRNA translation and decay.
STAR★Methods Key Resources Table
REAGENT or RESOURCE SOURCE IDENTIFIER Chemicals, Peptides, and Recombinant Proteins DMEM GIBCO Cat# 31966021 Leibovitz’s L15 medium GIBCO Cat# 21083-027 Penicillin-Streptomycin GIBCO Cat# 15140-122 Fetal Bovine Serum (FBS) Sigma-Aldrich Cat# F7524 Doxycycline Sigma-Aldrich Cat# D9891-1G Opti-MEM Sigma-Aldrich Cat# 11058-021 FuGENE 6 Transfection Reagent Promega Cat# E231A Lipofectamine RNAi-MAX Invitrogen Cat# 13778-075 Polyethylenimine Polysciences Inc Cat# 23966 Zeocin Invitrogen Cat# R25001 Trimethoprim Sigma-Aldrich Cat# T7883-5G TRIsure Bioline Cat# Bio-38033 Bioscript Reverse Transcriptase Bioline Cat# Bio-27036 Halo-TMR ligand Promega Cat# G8252 RNase Inhibitor New England Biolabs (NEB) Cat# M0307L Polybrene Santa Cruz Biotechnology, Inc Cat# sc-134220 Critical Commercial Assays iQ SYBR Green SuperMix Bio-Rad Cat# 1708885 Experimental Models: Cell Lines Human U2OS cells Tanenbaum lab Cat# HTB-96 HEK293T cells Tanenbaum lab Cat# CRL-3216 Oligonucleotides siRNA targeting sequence-UPF1:GCAGUUCCGCUCCAUUUUGAU Dharmacon N/A siRNA targeting sequence-XRN1: AGAUGAACUUACCGUAGAAUU Dharmacon N/A siRNA targeting sequence-SMG6: GGGUCACAGUGCUGAAGUAUU Dharmacon N/A See Table S1 for all primers used for RT-qPCRs. This study N/A Recombinant DNA See Table S1 for all plasmids used in the paper This study N/A Software and Algorithms ImageJ NIH https://imagej.nih.gov/ij/ Graphpad Prism 7 GraphPad Software Inc https://www.graphpad.com/scientific-software/prism/ MATLAB R2012b The Mathworks, Inc. https://nl.mathworks.com/products/matlab.html Micromanager for microscope control Micro-Manager 1.4.22 https://micro-manager.org NIS elements 5.11.01 Nikon https://www.microscope.healthcare.nikon.com/en_EU/products/software TransTrack (MATLAB) Boersma et al., 2018 https://github.com/TanenbaumLab RiboFitter (R) Boersma et al., 2018 https://github.com/TanenbaumLab Other 96-well glass bottom imaging plates-(Matriplates) Brooks Life Science Systems Cat# MGB096-1-2-LG-L Deposited Data Raw data of imaging experiments Mendeley data https://doi.org/10.17632/bw255hcw7h.1 Contact for Reagents and Resource Sharing Further information and requests for resources and reagents should be directed to and will be fulfilled by Marvin Tanenbaum ( m.tanenbaum@hubrecht.eu ) Experimental Model and Subject Details U2OS and HEK293T cell culture Human U2OS cells and HEK293T cells (ATCC) were grown in DMEM (4.5g/L glucose, GIBCO) containing 5% fetal bovine serum (Sigma-Aldrich) and 1% penicillin/streptomycin (GIBCO). Cells were grown at 37°C and with 5% CO2. Method Details Cells, Plasmids, Transfections and Lentiviral infections Plasmids The complete list and sequence of all plasmids used in this study is provided in Table S1 .
Plasmid and siRNA transfections
For imaging experiments, plasmid transfection of U2OS cells was performed in 96-well glass-bottom imaging plates 24 hr before imaging, using 0.5 μl FuGENE 6 (Promega) and 100-200 ng DNA per well. In experiments in which ha4E-BP1 was overexpressed, cells were transfected with ha4E-BP1 plasmid 16h before the start of imaging to reduce toxicity associated with overexpression of this protein. The transfection mix was prepared in OptiMEM (Sigma-Aldrich) and added to the cells in a total volume 150-200 μL of medium. Transfections in 24-well plates were performed using 1 μL FuGENE and 200-400 ng DNA per well in a total volume of 300 μl. For experiments in which siRNA transfections and plasmid transfections were combined, U2OS cells were first reverse transfected with siRNAs at a final concentration of 10 nM (unless stated otherwise) using Lipofectamine RNAiMAX (Invitrogen) and seeded in plastic 24-well plates. After 24hr, the cells were trypsinized, transfected with a second dose of 10 nM siRNA and re-plated in 96-well glass-bottom imaging plates. 48 hr after the first siRNA transfection, cells were transfected with plasmid DNA, as described above. 24 hr after DNA transfection, cells were analyzed by time-lapse microscopy. The sequences of the siRNAs used in this study are listed in the Key Resource table. For generation of cells stably expressing reporter mRNAs, U2OS cells were transfected with indicated reporter plasmids. 24 hr after transfection, selection for stable integration was performed using 0.4mg/ml Zeocin (Invitrogen) for 10 days.
Lentivirus production and infection
For lentivirus production, HEK293T cells were transfected with the lentiviral vector along with lentiviral packaging plasmids pMD2.g and pspax2 using Polyethylenimine (PEI) (Polysciences Inc). The medium was replaced the day after transfection with fresh culture medium, and 72 hr after transfection, viral supernatant was collected. For lentiviral infections, cells were seeded in a 6-well plate at about 70% confluency. Viral supernatant was added to the cells along with Polybrene (10μg/ml) (Santa Cruz Biotechnology Inc) and the cells were spun at 2000 rpm for 90 min at 22°C (Spin-infection). After the spin-infection, the culture medium was replaced with fresh medium, and cells were incubated for at least 48 hr before further analysis.
Microscopy
Unless stated otherwise, all live-cell imaging experiments were performed using U2OS cells expressing TetR, scFv-sfGFP and PCP-mCherry-CAAX ( Yan et al., 2016 , Ruijtenberg et al., 2018 ). Cells were seeded 48h before imaging in 96-well glass bottom dishes (Matriplates, Brooks Life Science Systems) at 20%–25% confluency. Cells were transfected with reporter plasmid DNA 24h before imaging. Thirty minutes before imaging, the cell culture medium was replaced with pre-warmed CO 2 -independent Leibovitz’s-15 medium (GIBCO) and transcription of the reporters was induced by addition of doxycycline (1 μg/ml) (Sigma-Aldrich). Images were acquired using a Nikon TI inverted microscope with perfect focus system equipped with a Yokagawa CSU-X1 spinning disc, a 100x 1.49 NA objective and an iXon Ultra 897 EM-CCD camera (Andor) using Micro-Manager software ( Edelstein et al., 2010 ) and NIS software (Nikon). During the experiment, cells were maintained at a constant temperature of 37°C. Unless stated otherwise, single Z-plane images were acquired, with the bottom of the cell in the focal plane. Camera exposure times of 500 ms were used for both GFP and mCherry, and images were acquired with an interval of 30 s, unless stated otherwise. Of note, mCherry-positive lysosomes were visible in most cells, but these could easily be distinguished from mRNAs based on fluorescence intensity and diffusion kinetics. In experiments in which untethered mRNAs were tracked, U2OS cells expressing PCP-Halo (instead of PCP-mCherry-CAAX) were used. Cells were labeled with Halo-TMR ligand (Promega) (50nM concentration for 2 h) before imaging. Single Z-plane images were acquired, with the region just below the nucleus of the cell in the focal plane. Images were taken with an interval of 15 s and camera exposure times of 500 ms were used for both GFP and TMR. In experiments in which the intensity of green spots was measured in 3D before and after cleavage, Z stacks were acquired for GFP. We acquired 11 slices with an inter-slice distance of 1 μm each, and used a 100 ms exposure time. For mCherry, a single Z-plane was imaged with 500 ms exposure time. Images were acquired at a 10 s time interval. In experiments in which the intensity of red spots was measured after mRNA cleavage, low laser power (∼8x lower than used for other imaging) and high exposure times (1500 ms) were used for mCherry to reduce photobleaching and increase signal-to-noise. This enabled accurate detection and measurement of mCherry foci for > 300 time points.
Quantitative RT-PCR U2OS cells stably expressing
TetR or TetR, scFv-sfGFP, PCP-mCherry-CAAX ( Yan et al., 2016 ) were seeded in 24-well plastic bottom plates at ∼10% confluency 72h before harvesting of cells. When the effect of UPF1 siRNA on reporter expression was assessed, a reverse transfection with 10 nM siRNA against UPF1 was performed during seeding, and another siRNA transfection was performed 24h after seeding. 48h after seeding, equal amounts of TPI WT , TPI PTC160 or TPI PTC1 reporter constructs were co-transfected with a control plasmid, and doxycycline was added for 24h to induce transcription of the reporters. 72hr after cell seeding, RNA was isolated using RNeasy plus mini kit (QIAGEN) according to manufacturer’s guidelines, and cDNA was generated using Bioscript reverse transcriptase (Bioline) and Oligo-d(T) primers. qPCRs were performed using SYBR-Green Supermix (Bio-Rad) on a Bio-Rad Real time PCR machines (CFX Connect Real-Time PCR Detection System). RNA abundance of reporter mRNAs was measured using two different primer sets that amplified a ∼200 nt regions upstream or downstream of the PTC. Reporter mRNA abundance was normalized to the expression of the control plasmid that was co-transfected to control for differences in transfection efficiency. The average of the two primer sets was then used as the final value for mRNA abundance. For checking efficiencies of UPF1 and XRN1 siRNAs by qPCR, U2OS cells expressing TetR, scFv-sfGFP and PCP-mCherry-CAAX ( Yan et al., 2016 ) were seeded in 24-wells plates. Respective siRNAs (10mM) were transfected during cell plating using reverse translation and cells were harvested 3 days after transfection. RNA isolation was performed using TRIsure (Bioline) according to manufacturer’s protocol. cDNA synthesis and qPCRs were performed as described above, except that GAPDH mRNA levels were used to normalize mRNA abundance. For determining splicing efficiency of NMD reporters, U2OS cells expressing TetR were seeded in 24-wells plates at 20%–25% confluency 48h before harvesting. After 24h cells were transfected with either a kif18b reporter that contained an intron or a matched reporter in which the intron sequence was removed from the plasmid. 3h before harvesting of cells, doxycycline was added to the cell culture medium to induce transcription, and 200 μg/ml cycloheximide was added to prevent degradation of spliced transcripts by NMD. RNA was isolated using RNeasy plus mini kit (QIAGEN) with on-column DNase treatment (RNase-free DNase set, QIAGEN) according to manufacturer’s protocol. cDNA synthesis and qPCR were performed as described above. To assess splicing efficiency, we used a primer set that amplified the reporter mRNA independent of its splicing status (total transcript) and a primer set for which one primer binds at the exon-exon junction, which only generates a PCR product when the transcript is spliced. The no-intron control reporter has the same mRNA sequence as the spliced transcript, and should therefore be amplified by both primer sets. We compared the ratio in abundance of the two amplicons (e.g., ‘total’ and ‘spliced’), and normalized this ratio to the ratio of total and spliced amplicons obtained with the no-intron control reporter. To ensure that the ‘spliced’ mRNA-specific primer set is indeed specific to spliced mRNAs, we tested the spliced mRNA-specific primer set on plasmid DNA. Amplification was tested on plasmid DNA in which the intron was present, which resembles unspliced mRNA and should thus not be amplified, and plasmid DNA in which the intron was not present, which resembles spliced mRNA and should be efficiently amplified. Each spliced mRNA-specific primer set amplified plasmid DNA lacking an intron > 500 fold more efficiently than plasmid DNA containing an intron, confirming the specificity of these primer sets.
Flow Cytometry
For analysis of splicing by flow cytometry using fluorescence splicing reporters, U2OS cells were seeded in 24-well plates at 20%–25% density. 24 hr after seeding, cells were transfected with plasmids encoding the splicing reporters and 1μg/ml doxycycline was added to induce expression of the reporter. 48 hr after seeding, cells were harvested and analyzed for GFP and BFP expression by flow cytometry using a Cytoflex analyzer (Beckman Coulter). The ratio of BFP-to-GFP signal intensity was then determined for each cell and the average BFP/GFP ratio for the cell population was calculated for each reporter. The BFP/GFP ratio of intron-containing reporters was then normalized to the average ratio of BFP/GFP of 6 no-intron control reporters (which represent fully spliced mRNAs) to determine the splicing efficiency.
Quantitation and Statistical Analysis
Quantification of mRNA degradation mRNA cleavage
To calculate the precise moment of cleavage of reporter mRNA molecules relative to the start of translation, we determined for each mRNA at which moment we could first visually observe GFP signal, and at which moment the red and the green signals separated from each other (cleavage). For mRNAs for which we did not observe cleavage, we determined the total time that the mRNA was tracked. An mRNA track was ended either when: 1) the end of the time lapse was reached, 2) two mRNAs crossed each other’s paths, 3) when translation of the mRNA could no longer be observed, 4) when the mRNA moved out of the field of view, or 5) when the mRNA detached from the plasma membrane. To ensure we only analyzed newly transcribed mRNAs, we excluded mRNAs that were already present at the membrane at the start of the time-lapse experiment, mRNAs that were already associated with a green fluorescent signal in the frame that they appeared in the field of view, or mRNAs on which we never observed a green fluorescence signal during the time lapse (∼50% of mRNAs). For each mRNA, we calculated the time from GFP appearance until cleavage or until the last time point in which the mRNA could be tracked, and we plotted the fraction of uncleaved mRNAs using a Kaplan-Meier plot, which takes into account both the track length of the cleaved and uncleaved mRNAs. Cleavage of mRNAs with 5xPP7 binding sites Reporter mRNAs containing a 5x PP7 binding array did not recruit sufficient mCherry molecules to detect the mRNA molecule over the background fluorescence. Therefore, mRNA cleavage could not be defined as physical separation of GFP and mCherry foci. As an alternative approach to define the time from translation initiation until mRNA cleavage, we analyzed the fluorescence intensity and diffusion of translation sites; translation initiation on a newly transcribed mRNA molecule was determined by the gradual appearance of a GFP spot that diffused slowly (indicative of membrane tethering). Cleavage was determined as either the rapid disappearance of the translation site, or a sudden large increase in the diffusion speed of the translation site, both of which occur because the 5′ cleavage product, which contains all the ribosomes and is thus GFP-labeled, is no longer physically connected to the PP7 binding sites in the 3′UTR after cleavage, and has thus lost its membrane tethering. An issue with determining the moment of cleavage based on the GFP signal alone is that cleavage cannot be distinguished from detachment of the entire mRNA from the plasma membrane. Membrane detachment may be especially prevalent when analyzing mRNAs containing only 5x PP7 binding sites, as they are connected to the membrane by fewer PP7 molecules. Therefore, for each reporter the rate of mRNA membrane detachment was determined by analyzing the rate of translation site disappearance for reporters that did not include a PTC. Cleavage times were then corrected for mRNA detachment by dividing the fraction of uncleaved mRNAs in the reporters containing a PTC by the fraction of remaining mRNAs (i.e., not detached) of the control reporter lacking a PTC for each time point. Cleavage of HP21 reporters Because reporters with reduced initiation rates are frequently translated by a single ribosome at a time, cleavage cannot be distinguished from translation termination as they both result in the separation of a single ribosome/SunTag array from the mRNA. Since mRNA cleavage, but not translation termination, results in rapid disappearance of the 3′ cleavage fragment, we classified disappearance of a green fluorescent signal as mRNA cleavage when the mRNA signal disappeared after GFP disappearance. Although the mRNA foci can also disappear through mechanisms other than NMD cleavage (e.g., mRNA detachment from the membrane), mRNAs on which no NMD occurred rarely disappeared from the membrane, indicating that mRNA disappearance after GFP disappearance mostly represents NMD. Cleavage of untethered mRNAs To observe cleavage of mRNA molecules that were not tethered to the membrane, cells were imaged in a single focal plane just below the nucleus of the cell. This region was selected to allow observation of mRNAs immediately after nuclear export, and because mRNAs could be easily tracked in the region below the nucleus. Similar to analysis on tethered mRNAs, we excluded from our analysis mRNAs which were already present at the start of the time-lapse video, or first appeared in the field of view in a translating state. For mRNAs that were not cleaved for the duration of the video, the time was noted at which we could no longer accurately track the mRNA and/or GFP signal (e.g., when mRNAs get out of focus or cross each other). The fraction of cleaved mRNAs was plotted as Kaplan-Meier plots. Estimating SMG5/7-dependent NMD NMD-dependent mRNA decay through SMG5/7 does not result in cleavage, but rather in exonucleolytic decay ( Unterholzner and Izaurralde, 2004 , Loh et al., 2013 ). Exonucleolytic decay of an mRNA would result in disappearance of both the GFP and mCherry signals. Therefore, we tested whether reporter mRNAs that were not degraded by endonucleolytic decay were subject to exonucleolytic decay. To do this, we determined the duration that mRNA and translation foci that did not get cleaved could be observed. Analysis of decay of 3′ cleavage fragments To determine how quickly 3′ decay intermediates were degraded after mRNA cleavage ( Figure 1 I), we precisely determined the moment of mRNA cleavage (as described above) and the moment of mRNA disappearance. For mRNAs that did not disappear during the video, we determined the last frame in which we could track the mRNA. An mRNA track could be lost, because the mRNA spatially overlapped with another mRNA, moved out of the field of view, or because the end of the video was reached. We then calculated for each individual mRNA the time between cleavage and mRNA disappearance and determined the fraction of remaining mRNAs over time using a Kaplan-Meier plot. Observing the first round of translation It is possible that a minor fraction of the mRNAs that initially appeared in the field of view in the untranslated state had already undergone the first round of translation previously followed by translation shutdown. To determine the likelihood that an mRNA that appears without an associated GFP signal had previously been translated, we analyzed which fraction of their lifetime TPI WT mRNAs spend in a state of temporary translational shutdown. The duration of a temporary shutdown event was defined as the number of frames during which no GFP signal could be detected on an mRNA before translation reinitiated. We determined the total time that an mRNA was translated as the duration from first GFP appearance until the last frame in which GFP was observed. We then calculated which fraction of their lifetime TPI WT mRNA spends in a state of temporary shutdown, which was 4% ± 2%. If all newly appearing mRNAs would already have been translated, 96% of the newly appearing mRNAs should be associated with a green signal, while 4% should not have an associated green signal. However, 86% of the newly appearing mRNAs did not have an associated green signal, suggesting that the majority of these mRNAs had not yet initiated translation. The 14% of mRNAs that appeared with a GFP signal represent 96% of the mRNAs that had already initiated translation. Therefore, the 4% of mRNAs in a state of temporary shutdown should represent only 4/96 ∗ 14% = 0.6% of all mRNAs, meaning that we observe the first round of translation on > 99% for the mRNAs that appear without an associated GFP signal. Measuring fluorescence intensities Fluorescence intensities of mRNAs and translation sites To determine the fluorescence intensity of individual translation or mRNA foci over time, mean spot intensities were measured in ImageJ in a region of interest (ROI) 4x4 pixels in size (0.54 × 0.54 μm). For each spot, local background fluorescence intensity was measured in a 10x10 pixel ROI directly next to the spot of interest, and mean background fluorescence intensities was subtracted from the mean spot intensity. To correct for photobleaching during the time-lapse video, the mean fluorescence intensity of the entire cell (for GFP fluorescence) or of mRNAs that remained present for the entire duration of the video (mCherry fluorescence) was determined at each time point in the video and the decrease in fluorescence over time was fit with a single exponential decay distribution, from which a bleaching rate was determined. All spot and background fluorescence intensity measurements were then corrected for the bleaching.
Tracking and intensity measurements of translation sites
For mRNA tracking and fluorescence intensity measurements of single mRNAs described in Figure 3 , we used a previously described software package called ‘TransTrack’ ( Boersma et al., 2018 ). Using TransTrack, we measured the GFP fluorescence intensity and performed background subtraction and bleach correction. All traces were manually curated. Ribosome initiation and elongation rates Calculating the number of ribosomes present on an mRNA For TPI PTC1 , calculation of the number of ribosomes present on individual mRNA molecules was performed as described previously ( Yan et al., 2016 ). In brief, mRNAs were imaged with short (30 ms) exposure time and high laser intensity (∼20x higher than used for normal translation imaging). With this short exposure time, mature SunTag proteins that have completed translation and are freely diffusing in the cytoplasm and are not co-localizing with an mRNA molecule can be observed as distinct foci. In contrast, translation sites are visible as brighter foci that co-localized with an mRNA molecule. We compared the background-subtracted fluorescence intensity of translation sites with the mean fluorescence intensity of mature proteins in the same cell. Since some ribosomes (that have not yet translated the entire SunTag sequence) will recruit fewer scFv-sfGFP molecules, a mature protein produces more fluorescence intensity than an average ribosome translating an mRNA. Therefore, we corrected for the average fluorescence intensity associated with a translating ribosome to obtain the final ribosome occupancy on mRNA molecules, as described previously ( Yan et al., 2016 )). For other reporters, we determined the ribosome occupancy by comparing the fluorescence intensity of translation sites of each of these reporters with the fluorescence intensity of TPI PTC1 translation sites, for which the ribosome number had been calculated, as described above. Determining ribosome elongation speeds To determine the time a ribosome takes to translate the entire coding sequence of a reporter mRNA, the 5′UTR sequence of the Emi1 gene ( Yan et al., 2016 , Tanenbaum et al., 2015 ) was introduced into the reporter, which severely reduces the translation initiation rate, frequently limiting the number of ribosomes per mRNA molecule to one. To determine the time taken by the ribosomes to translate the entire reporter mRNA coding sequence, we measured the time between appearance and disappearance of GFP signal. To ensure that only translation events by single ribosomes were analyzed, only events with low GFP signal were included in this analysis. In addition, only translation events on which the time between GFP appearance and disappearance was < 4.5 min were included, as longer events are more likely to represent either translation events by multiple ribosomes or stalled ribosomes. The duration of all analyzed translation events was then plotted, and fit with a Gaussian distribution. The mean of this Gaussian distribution (2.38 min) was used as a mean time from the moment of GFP appearance to GFP disappearance. As GFP cannot be detected until ∼8 SunTag peptides have been synthesized due to limited fluorescence intensity, GFP will only be detected after the first ∼735 nucleotides have been translated ( Yan et al., 2016 ). Therefore, the translation time of 2.38 min represents the time required for translation of the mRNA reporter from nt 735 until the end of the coding sequence (nt 2517), resulting in an effective coding sequence length of 2517 – 735 = 1782 nucleotides, which results in an elongation speed of 12.45 nucleotides/s (4.15 codons/s). When translation initiation is not reduced (e.g., for TPI PTC1 ), multiple ribosomes will simultaneously translate the mRNA, resulting in a brighter fluorescent signal than when the mRNA is translated by a single ribosome. Therefore, the GFP signal can already be detected when the first ribosome has translated fewer than 8 SunTag peptides, resulting in a longer effective coding sequence length. With the determined ribosome occupancy of 10.85 ribosomes on TPI PTC1 , the average distance between ribosomes will be 232 nucleotides, corresponding to 3.2 SunTag peptides. When the first ribosome has on average translated 5.6 SunTag peptides, or 562 nucleotides, the next ribosome trailing the first at a distance of 232 nucleotides will have translated 2.4 peptides, resulting in a total fluorescence of 8 SunTag peptides of the two ribosome combined, which we determined to be our detection limit (see above). Translation of the remaining 1955 nucleotides (2517 minus the 562 undetected nucleotides), which corresponds to the time required for the first ribosome to reach the stop codon after GFP appearance, should therefore require on average 1955/12.5 = 2.62 min. In Figure 1 D, we state that the timing of the first mRNAs undergoing NMD coincides with the expected time of arrival of the first ribosome at the stop codon. This statement is based on elongation rates measured in a previous study, in which we found elongation rates of 9-15 nt/s for different reporters (( Yan et al., 2016 )). TPI PTC1 and TPI PTC160 have effective coding sequence lengths (see above) of 1955 and 2429 nt respectively. Assuming elongation rates of 9-15 nt/s, translation of TPI PTC1 should take between 1955/15 = 130 and 1955/9 = 217 s (2.1-3.6 min), which corresponds to 2.1-3.6 min. Translation of TPI PTC160 should take between 2.7-4.4 min.
Calculation of translation initiation rates
Calculation of the translation initiation rate was performed as described previously ( Yan et al., 2016 ). In brief, it requires both knowledge of the translation elongation rate (4.15 codons/s, see ‘ Determining ribosome elongation speeds’ ) and the inter-ribosome distance. The inter-ribosome distance was calculated based on the coding sequence length (2517 nucleotides for TPI PTC1 ) and the number of ribosomes present on the mRNA (10.85 for TPI PTC1 , see ‘ Calculating the number of ribosomes present on an mRNA’) . The inter-ribosome distance for TPI PTC1 was 2517/10.85 = 232 nucleotides. In steady state, ribosomes need to initiate as frequently as they terminate. With an inter-ribosome distance of 232 nucleotides, and an elongation speed of 4.15 codons/s, a ribosome terminates and initiates every 232/12.45 = 18.6 s, corresponding to an initiation rate of 3.2 ribosomes per minute.
Cell-to-cell heterogeneity in NMD efficiency
Since we only analyze a relatively small number of mRNAs in each cell, cleavage distributions in individual cells are expected to show substantial variation, even when they have the same NMD efficiency. In order to determine if NMD efficiency was variable among different cells, it is therefore essential to determine the extent of heterogeneity that is expected between different cells based on random chance, assuming that each cells has an equal NMD efficiency. To determine how much heterogeneity is expected when all cells have equal NMD efficiency, we performed stochastic simulations for TPI WT , TPI PTC160 and TPI PTC1 reporters to determine the expected ranges in cleavage time distributions. The number of cells and the number of mRNAs per cell in each simulation were kept equal to the number of cells and mRNAs per cell in the corresponding experiment. For each simulated mRNA, the moment of cleavage was determined by randomly picking a value from the experimentally observed cleavage time distribution. Then, the cleavage time distribution for each simulated cells was plotted using a Kaplan-Meier plot. Next, we determined whether the cell-to-cell variation in the experimental cleavage time distributions exceeded the variation in the simulated cleavage time distribution (which would indicate that different cells have distinct NMD efficiencies). For simulated data, we compared the cleavage time distributions of single cells with the experimentally observed average cleavage distribution of all cells, and calculated the Summed Squared Error (SSE) for each simulated cell individually. We then summed the SSE’s of all individual cells to get a measure of the total variation. These simulations were performed 10.000 times to generate a 95% confidence interval of the SSE that is expected if all cells have an equal NMD efficiency. Similarly, for experimental data, we compared the cleavage time distributions of single cells with the experimentally observed average cleavage distribution of all cells to get a measure of the total variation in the experiment. Finally, we compared the experimental variation with the variation in the simulations to determine if the experimental data showed significantly greater heterogeneity in NMD efficiency among different cells than the simulated data. Counting ribosomes that translate HP21 mRNAs Determining how many ribosomes have translated a HP21-TPI PTC1 reporter mRNA molecule, requires knowledge of the GFP fluorescence produced over time by a single ribosome translating the mRNA, and of the GFP fluorescence associated with an mRNA during each time point. Distinguishing translation events from noise To generate GFP intensity time traces, we measured the GFP fluorescence intensity of an mRNA at every time point in which the mRNA was present. GFP intensity time traces showed peaks of high fluorescence intensity that lasted for multiple consecutive time points, consistent with the expected fluorescence intensity produced by a translation event of one or more ribosomes. In order to count how many ribosomes had translated an mRNA, we first distinguished translation events (originating from one or multiple ribosomes translating the mRNA) from noise. Fluorescence intensity peaks were defined as translation events when the mean pixel intensity was either above 0.3 (arbitrary units) for 4 consecutive time points, or above 0.3 for 5 out of 6 consecutive time points. When a fluorescence intensity peak was categorized as a translation event, GFP intensity of earlier and later time points were also determined to obtain the entire fluorescence intensity peak associated with that translation event. Earlier time points were included until a time point was encountered in which the mean pixel intensity was < 0.05, or when a local minimum with an intensity of < 0.15 was encountered. Later time points were included until the first time point was encountered with a pixel intensity of < 0.2. The total fluorescence intensity of each translation event was then calculated as the sum of the fluorescence intensities at each time point of the translation event, i.e., the integrated fluorescence intensity of the peak.
Fluorescence intensity of a single ribosome
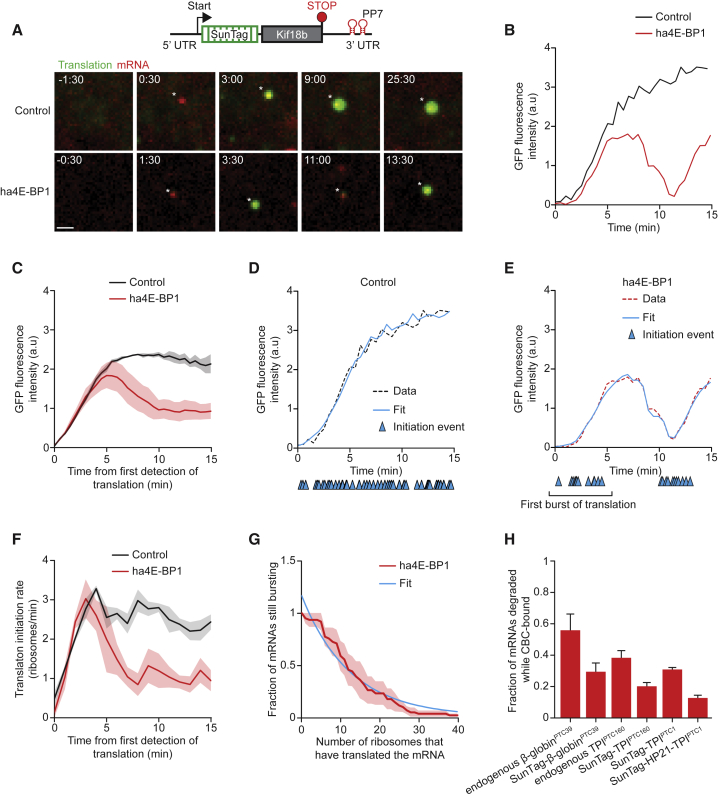
As the observed translation events (i.e., GFP peaks in the GFP intensity time traces) can originate from one or multiple ribosomes, interpretation of fluorescence intensities requires knowledge of the fluorescence intensity produced by single ribosome translation events. We reasoned that a single ribosome translation event can be distinguished from multi-ribosome translation events based one: 1) the duration of the translation event, and 2) the fluorescence intensity; translation events that include multiple ribosomes will, on average, last longer and have a higher fluorescence intensity. Translation events with a duration of 2.5 min or less always had a low maximum intensity, whereas translation events with a duration of more than 2.5 min occasionally had higher maximum intensities ( Figure S2 G). Therefore, we reasoned that all translation events with a duration of 2.5 min or less are highly enriched from translation events originating from a single ribosome. We measured the maximum pixel intensity for all peaks of 2.5 min or less, and found that the average maximum intensity of GFP for those mRNAs was 0.76. To acquire the integrated GFP fluorescence intensity of a single ribosome translation HP21-TPI PTC1 , we used our previously described model to correct for the lower fluorescence intensity when ribosomes have not yet completed translation of all 24 SunTag peptides ( Yan et al., 2016 ). This correction takes into account the delay in fluorescence buildup caused by sequential production of SunTag peptides and the delay in binding of scFv-sfGFP to a newly translated SunTag peptide when the SunTag peptide has not left the ribosomal exit tunnel. Using this correction we estimated the mean fluorescence intensity of the entire translation event to be 0.43. Finally, the integrated fluorescence intensity was calculated as the mean fluorescence intensity multiplied by the average duration of a single-ribosome translation event, which we determined to be 2.38 min (in Emi1-TPI PTC1 ) or 9.5 frames, resulting in an integrated fluorescence intensity of 4.1 for single ribosomes. Counting ribosomes translating an HP21-PTC1 mRNA To calculate the total number of ribosomes that had translated an mRNA, we calculated how many ribosomes contributed to the fluorescence intensity of each translation event. The number was rounded, so that translation events with a total fluorescence intensity between 0.5 and 1.5 ribosomes (e.g., between 2.05 and 6.15 arbitrary intensity units) were scored as originating from 1 ribosome, translation events with intensities of 1.5-2.5 ribosomes as 2 ribosomes, etc. We then summed the number of ribosomes from all translation events observed on an mRNA to get the total number of ribosomes that had translated an mRNA. Probability per ribosome to induce NMD of HP21-TPI PTC1 mRNAs After counting how many ribosomes translated each HP21-TPI PTC1 mRNA before NMD was induced, we calculated the chance per ribosome by fitting the cumulative decay graph with a 2-component exponential decay distribution (containing a fast and slow decaying population, similar to the fitting approach described in ’Modeling of NMD kinetics ’) in GraphPad Prism. Since 10% of TPI PTC1 mRNAs appeared to be insensitive to NMD ( Figure 1 D), we used a slow component that represented 10% of the mRNAs. The decay rate for this slow decaying population was set to the same value as the slow decay rate for our modeling of reporters without reduced translation initiation. The decay rate of the fast component was than fitted by GraphPad Prism. We then converted the decay rate that was determined by prism to a probability per ribosome to induce NMD. An exponential decay distribution is described the by the equation: Fraction uncleaved ( R ) = e ∧ ( − λ∗R ) In this equation, R represents the number of ribosomes that have translated the mRNA, while λ is the decay rate (in ribosomes -1 . Therefore, after 1 ribosome has translated an mRNA, the fraction of mRNAs that has not yet been degraded is given by: Fraction uncleaved ( 1 ribosome ) = e ∧ ( − λ ) The probability per ribosome to induce NMD is then given by: Probability per ribosome to induce NMD=1− e ∧ ( - λ ) Analysis of the first burst of translation Fitting initiation events based on the fluorescence intensities To determine the timing of individual translation initiation events based on fluorescence intensity time traces of single mRNAs, we used a previously described algorithm to fit initiation events to the fluorescence intensity trace of translation sites ( Boersma et al., 2018 ). This algorithm calculates the fluorescence intensity trace of a single ribosome translating the mRNA, and fits multiple intensity traces of single ribosomes along the intensity trace of a translation site. The fit in which the combined traces of single ribosomes best fit the trace of the translation site is determined by minimizing the root mean squared error between the fit and the experimentially determine intensity trace. In the best fit, the timing of translation initiation events is recorded. Generating the intensity trace of a single ribosome requires knowledge of 1) the fluorescence intensity of a ribosome when all SunTag peptides are occupied by scFv-GFP, and 2) the duration of translation of the SunTag peptides and of the mRNA downstream of the SunTag peptides. To obtain these values, we measured the intensity of a single ribosome as described above for TPI PTC1 (‘ Calculating the number of ribosomes present on an mRNA ‘), which we found to be 0.155 a.u.. We calculated the time of translation of the SunTag peptides and the downstream sequence based on the previously published translation elongation rate of 3.3 codons/s for the Kif18b reporter ( Yan et al., 2016 ). Defining the first burst of translation In cells overexpression ha4E-BP1, newly transcribed mRNAs frequently showed a high translation initiation rate initially (referred to as the “first burst of translation”), followed by a period in which no or very few new ribosomes initiated translation (For example, see Figure 3 E). To distinguish initiation events that occurred during this first burst of initiation from events that happened during later bursts of translation, we defined the end of the first burst of translation as the first moment in which no translation initiation events had occurred for 2 consecutive minutes. In addition, we also called the end of a burst when only a very low initiation rate was observe for 3 consecutive minutes (initiation rate lower than 1 ribosome per minute). Finally, we plotted the duration of the first bursts of translation as a cumulative distribution, and fit this distribution with an exponential decay distribution to determine the average and median duration of the first burst. XRN1 decay kinetics Measurement of fluorescence intensities of mRNAs To analyze changes in mCherry fluorescence caused by XRN1-mediated degradation of the PP7 binding site array, images were acquired with a time interval of 5 (TPI PTC160 ) or 15 (TPI PTC160-48xPP7 ) seconds. The mCherry fluorescence intensity of 3′ cleavage fragments was measured starting 10 frames before cleavage until the moment the mRNA could no longer be detected or the track was lost, and intensities were normalized to the average mCherry fluorescence intensity in the 10 frames before cleavage. Calculating XRN1 decay kinetics mCherry fluorescence intensity profiles during the decay of the 3′ cleavage fragments for the TPI PTC160 reporter (containing a 24x PP7 array) were characterized by an initial delay phase, during which no changes in fluorescence intensity were observed, followed by a degradation phase, during which the fluorescence intensity decreased linearly until the mRNA could no longer be detected. A fraction of mRNAs did not show a degradation phase for the duration of the experiment and were excluded from further analysis. To calculate the duration of the delay and the degradation phase, we determined the onset of the degradation phase by fitting each intensity trace with a model consisting of a plateau followed by a linear decrease. To determine onset of degradation, the quality of fit was determined for different initial moments of linear decrease, ranging from immediately after cleavage to the moment of degradation. The initial moment of linear decrease that best fit the data was then used for further calculations. The duration of the delay phase was calculated as the time from cleavage until the onset of degradation, while the duration of the degradation phase was calculated as the time from the onset of degradation till the last moment the mRNA signal could be detected. Calculating mRNA decay kinetics using the TPI PTC160-48xPP7 reporter Degradation of TPI PTC160-48xPP7 occurred in 4 phases: mCherry fluorescence initially remained constant during a delay phase, after which it decreased to ∼50%, followed by a plateau phase during which mCherry intensity again remained constant, and finally complete disappearance of the mCherry signal was observed. Because these traces showed a complex profile, we manually inspected all traces to identify the different phases. The duration of the initial delay phase was calculated as the time between mRNA cleavage and the first moment of a steep decline in fluorescence intensity to < 75% of the initial intensity. The duration of the plateau phase was defined by the number of frames during which fluorescence intensity remained constant over time while having a fluorescence intensity of 15%–75% of the initial intensity. For some traces, we could not observe all 4 phases because mRNAs could not be tracked sufficiently long; for these traces we noted the last frame in which the delay phase or plateau phase could be observed. We finally plotted the duration of delay phase and plateau phase using a Kaplan-Meier plot.
Calculation of the XRN1 degradation speed
To calculate the degradation speed of XRN1 degrading a 24x PP7 binding site array, we used the degradation time which was determined as described above. We estimated that we could no longer track the mRNA when 19 of 24 PP7 binding sites were degraded (i.e., when 5 binding sites were remaining), as we generally observed a steep decrease in fluorescence intensity when ∼1/5th of the fluorescence intensity was remaining, suggesting that we could no longer accurately identify the mRNA spot at that point and were instead measuring background fluorescence. Therefore, the degradation time represents the time required for degradation of 19/24 th of the 24xPP7 array, or 1153 of the total 1456 nucleotides. Using this value, we calculated the degradation speed by dividing the 1153 nucleotides by the median degradation time (30 s for TPI PTC160 ) to obtain a degradation speed of 38 nucleotides/s. To calculate the degradation speed of XRN1 degrading the 2642 nucleotide linker sequence of TPI PTC160-48xPP7 , we assumed that plateau phases with durations of 2 or less min were degraded by a single XRN1 binding event, and that plateau phases that lasted longer were degraded by 2 or more XRN1 binding events (see main text ‘Decay kinetics of the 3′ fragment after mRNA cleavage ’). The degradation speed was then calculated by dividing the linker length of 2642 nucleotides by the median degradation time (48 s for TPI PTC160-48x PP7 ) to obtain a degradation speed of 55 nucleotides/s. Modeling of NMD kinetics General information We used MATLAB to perform stochastic simulations that describe NMD cleavage kinetics with quantitative parameters. Each simulation was run using four parameters: 1) the moment the ribosome reaches the stop codon, which was experimentally determined and was assumed to be constant for all reporters with the same coding sequence. 2) The fraction of mRNAs that is sensitive to NMD; this parameter was variable and the value that best described the data was determined by the modeling. 3) The probability that a terminating ribosomes induces NMD of an NMD-sensitive mRNA; this parameter was variable and the value that best described the data was determined by the modeling. 4) The probability that a terminating ribosomes induces NMD of an NMD-insensitive mRNA; this probability was constant and set to the decay rate of an NMD reporter without introns (TPI PTC1-no introns ). Since 2 parameters were kept constant, decay kinetics were determined by the 2 variable parameters (fraction NMD-sensitive mRNAs and decay rate of NMD-sensitive mRNAs). Decay kinetics were simulated using a wide range of input values for the two variable parameters, and the best fitting values were determined based on similarity between data and simulation using least square fitting.
Running a single simulation
Each simulation was run for 100.000 mRNA molecules. The moment of cleavage was determined for each mRNA molecule and depended on the values of the four parameters. First, the 100.000 mRNAs were divided into either NMD-sensitive or NMD-insensitive mRNAs based on the value of the parameter that describes the fraction of NMD-sensitive mRNAs N NMD−sensitive =100 .000∗fraction sensitive N NMD−insensitive =100 .000∗ ( 1−fraction sensitive ) Next, the time from first detection of translation until induction of NMD (t degraded ) was calculated for each mRNA based on two parameters: 1) the time from first detection of translation until arrival of the first ribosome at the stop codon (t 1 ), and 2) the time from arrival of the first ribosome at the stop codon until the moment of induction of NMD (t 2 ), which depends on the probability that a terminating ribosome induces NMD: t degraded = t 1 + t 2 A value for t 1 was randomly selected from a Gaussian distribution; the mean and standard deviation of this Gaussian distribution were experimentally determined using the Emi-TPI PTC1 reporter (2.38 ± 0.79 min). For other reporters, the mean was scaled linearly based on the effective coding sequence length (See ‘ Determining ribosome elongation speeds’), while the standard deviation was scaled with the square root of the effective coding sequence length (e.g., a reporter with a 2x longer effective coding sequence length will have a 1.41x higher standard deviation). Since a Gaussian distribution was used, ribosomes could occasionally be predicted to reach the stop codon in less than 0 s (< 0.1% of the cases); therefore a lower limit of 0 s was used for the time at which ribosomes reached the stop codon. A value for t 2 was randomly selected from an exponential decay distribution; the decay rate of this exponential decay distribution depended on the probability that a terminating ribosome induces NMD. For the NMD-sensitive population (N NMD sensitive ), we used a fitting approach to determine which decay rate best described the experimental data (see below, ‘ Comparing simulations and data’). The decay rate was then converted to a probability per ribosome to induce NMD using the equation: Fraction uncleaved ( t ) = e ∧ ( −λ∗t ) In which λ is the decay rate (in min -1 ), and t is the time (in min). Since 3.2 ribosomes terminate per minute, t can be converted to ribosomes (R): Fraction uncleaved ( R ) = e ∧ ( −λ∗R / 3 .2 ) After a single ribosome has translated the mRNA (R = 1), the fraction of mRNA that has not been degraded is given by: Fraction uncleaved ( 1 ribosome ) = e ∧ ( − λ / 3 .2 ) Thus, the probability per ribosome to induce NMD is given by Probability per ribosome to induce NMD=1− e ∧ ( −λ / 3 .2 ) In the ‘first ribosome’ model, degradation of the NMD-sensitive population was based purely on the moment the ribosome reached the stop codon ( Figure 2 A), and decay was therefore modeled to be induced immediately after the ribosome had reached the stop codon (t 2 = 0). For the NMD-insensitive population of mRNAs, the time required to induce NMD after the first ribosome had reached the stop codon was also randomly selected from an exponential decay distribution. The decay rate of this exponential distribution was set at a fixed value for all simulations, and was similar to the decay rate of TPI PTC1-no introns (decay rate = 0.0029 min -1 ) After we determined the moment of degradation for all 100.000 molecules, a cumulative distribution function was made that describes the fraction of uncleaved mRNAs over time, similar to the Kaplan-Meier plots used to describe cleavage data. We then determined how well the simulation fit the data by calculating the Summed Square Error (SSE): at each time point (e.g., every 30 s for most experiments), we calculated the squared difference in fraction of remaining mRNAs in simulation and data, and then summed all these values to get the total SSE. Simulations that describe the data well will have a small SSE, while simulations that do not fit well will have a large SSE.
Comparing simulations and data
To find which values for the two variable parameters best described the data, we first ran simulations with a wide range of initial NMD decay rates and fractions of NMD-sensitive mRNAs. The initial values for (1/decay rate) ranged from 0-400 min with steps of 1 min, whereas the fraction of cleaved mRNAs range from 10 to 100% with steps of 1%. The lower limit of 10% prevented fitting very high decay rates in situations where a single mRNA molecule was cleaved early on but very little cleavage occurred during the rest of the experiment. We calculated the SSE for each simulation, and determined which parameter values resulted in the lowest SSE and thus best described the data. We then ran the simulation with a new, smaller range of parameter values centered on the values that were found to describe the data most accurately in the previous round. This was repeated for several rounds with increasingly small parameter ranges until the change in the parameter 1/decay rate was less than 0.01 min. The entire fitting process was repeated 5 times, and the mean of best fitting parameter values of the 5 replicates were used as the final value that was used to describe the data. In general, the 5 replicate fitting processes had differences of < 1%, indicating that stochasticity does not have a major effect on the outcome of the simulation.
Comparing quality of fit of different models
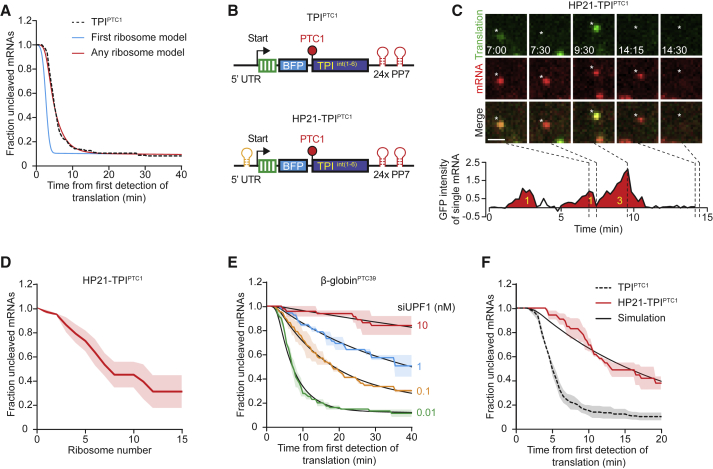
We have used two different models to describe the cleavage kinetics of TPI PTC1 based on either one variable parameter (‘first ribosome’ model) or two variable parameters (‘any ribosome’ model). As models with two parameters generally produce better fits, we calculated Akaike information criterion (AIC) for both models, which corrects for the number of variable parameters through the following equation: AIC=n∗ln ( SSE/n ) +2∗K In this equation, SSE is the summed squared error of the fit and the data, n is the number of time points, which was 81 (i.e., 40 min), and K is the number of variable parameters in the model. The model that best describes the data will have the lowest (most negative) AIC, which we found to be the model with two variable components. Predicting NMD decay rates in cells expressing ha4E-BP1 To predict the effect of ha4E-BP1 overexpression on kinetics of NMD of TPI PTC160 and TPI PTC1 reporters, we assumed that ha4E-BP1 did not affect the NMD decay rate while mRNAs were bound to CBC, but reduced the decay rate while mRNAs were bound to eIF4E by decreasing the number of ribosomes that initiate translation and could induce NMD. To calculate the predicted NMD decay rate in ha4E-BP1 overexpressing cells, two parameters are required. 1) The number of ribosomes that initiated on CBC-bound mRNAs. 2) The fold decrease in the NMD decay rate while eIF4E is bound to mRNAs for cells overexpressing ha4E-BP1, which is directly related to the initiation rate on eIF4E-bound mRNAs in the presence and absence of ha4E-BP1 overexpression. The number of ribosomes that initiated on CBC-bound mRNAs was described by an exponential decay distribution with an half-live of 8.7 ribosomes (see Figure 3 G). Translation initiation rates on eIF4E-bound mRNAs were on average 2.4-fold lower in ha4E-BP1 overexpressing cells, thus we used a NMD decay rate that was also reduced by 2.4-fold upon ha4E-BP1 overexpression. We then adjusted the stochastic simulation described above (See ‘ Running a single simulation ‘) to predict how ha4E-BP1 overexpression affects the NMD decay rate. For each mRNA, we simulated 3 values: 1) t 1 , the time from first detection of translation until arrival of the first ribosome at the stop codon (see above, ‘ running a single simulation’ ). 2) t 2 , the time from arrival of the first ribosome at the stop codon until the moment of induction of NMD (in a situation without ha4E-BP1 overexpression,see above, ‘ running a single simulation’ ). 3) t 3 , the duration of the first burst of translation (in min), which was randomly selected from the exponential decay distribution that described the duration of the first burst of translation (and has a half-live of 8.7 ribosomes (See Figure 3 G)). We then determined for each simulated mRNA whether it was degraded by ribosomes that initiated in the first burst of translation, or by ribosomes that initiated after the first burst of translation. mRNAs were considered to be degraded in the first burst of translation when t 3 > t 2 , as this indicated that the time required for degradation was shorter than the duration of the first burst of translation, and thus that NMD was induced by a ribosome that initiated in the first burst of translation. For these mRNAs, the moment of degradation was defined as above (‘ running a single simulation’ ): t degraded = t 1 + t 2 For mRNAs that were not degraded in the first burst of translation (t 3 < t 2 ), we assumed that the initiation rate (and thus NMD decay rate) was unaffected during the first burst of translation, and reduced by 2.4-fold after the first burst of translation in the presence of ha4E-BP1 (see Figure 3 F). The time from the end of the first burst of translation until degradation (during which decay is delayed by 2.4-fold) is defined as: t delayed = t 2 − t 3 . Therefore, the moment of degradation for mRNAs not degraded during the first burst of translation is defined as: t degraded = t 1 + t 3- + ( t delayed ∗2 .4 ) After we determined the moment of degradation for all molecules in the simulation, a cumulative distribution function was made that describes the fraction of uncleaved mRNAs over time. Fraction of mRNAs degraded while CBC-bound To predict which fraction of mRNAs are degraded while still bound to CBC, we need to determine when replacement of CBC by eIF4E occurs relative to the moment of NMD induction for each reporter. We assumed that the CBC-to-eIF4E switch kinetics was similar for all reporters. Therefore, the fraction of mRNAs that are degraded while still bound to CBC could be calculated based on the NMD decay rate for each reporter. We assumed that the end of the first burst of translation (see above, ’ Predicting NMD decay rates in cells expressing ha4E-BP1’ ) indicates the moment of CBC-replacement by eIF4E. For each mRNA, we again simulated the three values t 1 , t 2 and t 3 . Next, we determined the moment of degradation (t degraded ) for each mRNA as described above in ‘ Running a single simulation’. An mRNA was considered to be degraded while CBC-bound if degradation happened before CBC-replacement (i.e.. t degraded < t 3 ). We then determined for each mRNA whether degradation happened before (i.e., t degraded < t 3 ) or after (i.e., t degraded > t 3 ) CBC-replacement to calculate the fraction of mRNAs that is degraded while bound to CBC. Of note, this fraction was calculated for the population of mRNAs that was cleaved efficiently; we did not include the fraction uncleaved mRNAs in this calculation.
Analysis of genome-wide data on NMD efficiency
Filtering the TCGA dataset
To determine the effect of the number and position of upstream and downstream introns on NMD efficiency, we used the previously published TCGA dataset ( Lindeboom et al., 2016 ). This dataset contains expression levels of PTC-containing transcripts for 2840 high-confidence nonsense mutations, compared to expression levels of their wild-type counterparts. These expression levels were filtered for non-random noise by principal component analysis (see ( Lindeboom et al., 2016 ) for details), and the ratio of abundances of nonsense and wild-type transcripts is used as a measure for NMD efficiency. For our analyses, we removed all transcripts with an intron in their 3′ UTR (98 nonsense mutations removed), as they are likely to behave differently regarding the effect of the number of upstream and downstream introns on NMD efficiency. We also removed transcripts in which the PTC was located within 250 nucleotides of the start codon (413 nonsense mutations removed), as these PTCs have been shown to induce NMD less efficiently and would therefore skew analyses independently of the effect we are analyzing. Effect of the number of downstream EJCs on NMD efficiency To determine the effect of the number of downstream EJCs on NMD efficiency, we assumed that an EJC will be present on the mRNA when the intron is located at least 50 nucleotides downstream of the PTC, while the EJC will be displaced by translating ribosomes if the PTC is within 50 nucleotides of a downstream intron (refs). We grouped transcripts based on the number of EJCs downstream of the PTC, and compared NMD efficiency for transcripts with 0, 1, 2, 3, or more than 3 EJCs downstream of the PTC. Statistical significance was tested using a two-tailed Mann-Whitney U test. Effect of the number of upstream introns on NMD efficiency To determine the effect of the number of upstream EJCs on NMD efficiency, we grouped transcripts based on the number of introns upstream of the PTC, and compared NMD efficiency for transcripts with 0, 1, 2, 3, or more than 3 upstream introns. We performed this analysis independently for either transcripts containing a PTC with 1 downstream EJC, or containing a PTC with 2 or more downstream introns. Statistical significance was tested using a two-tailed Mann-Whitney U test.
Data and software availability
Raw imaging data of key experiments related to Figures 1 , 2 , 3 , and 7 (including related supplemental figures) can be accessed on Mendeley data. Microscopy data reported in this paper can be found at Mendeley Data: https://doi.org/10.17632/bw255hcw7h1 .
Experimental Model and Subject Details
U2OS and HEK293T cell culture Human U2OS cells and HEK293T cells (ATCC) were grown in DMEM (4.5g/L glucose, GIBCO) containing 5% fetal bovine serum (Sigma-Aldrich) and 1% penicillin/streptomycin (GIBCO). Cells were grown at 37°C and with 5% CO2.
Method Details Cells, Plasmids, Transfections and Lentiviral infections Plasmids The complete list and sequence of all plasmids used in this study is provided in Table S1 .
Plasmid and siRNA transfections
For imaging experiments, plasmid transfection of U2OS cells was performed in 96-well glass-bottom imaging plates 24 hr before imaging, using 0.5 μl FuGENE 6 (Promega) and 100-200 ng DNA per well. In experiments in which ha4E-BP1 was overexpressed, cells were transfected with ha4E-BP1 plasmid 16h before the start of imaging to reduce toxicity associated with overexpression of this protein. The transfection mix was prepared in OptiMEM (Sigma-Aldrich) and added to the cells in a total volume 150-200 μL of medium. Transfections in 24-well plates were performed using 1 μL FuGENE and 200-400 ng DNA per well in a total volume of 300 μl. For experiments in which siRNA transfections and plasmid transfections were combined, U2OS cells were first reverse transfected with siRNAs at a final concentration of 10 nM (unless stated otherwise) using Lipofectamine RNAiMAX (Invitrogen) and seeded in plastic 24-well plates. After 24hr, the cells were trypsinized, transfected with a second dose of 10 nM siRNA and re-plated in 96-well glass-bottom imaging plates. 48 hr after the first siRNA transfection, cells were transfected with plasmid DNA, as described above. 24 hr after DNA transfection, cells were analyzed by time-lapse microscopy. The sequences of the siRNAs used in this study are listed in the Key Resource table. For generation of cells stably expressing reporter mRNAs, U2OS cells were transfected with indicated reporter plasmids. 24 hr after transfection, selection for stable integration was performed using 0.4mg/ml Zeocin (Invitrogen) for 10 days.
Lentivirus production and infection
For lentivirus production, HEK293T cells were transfected with the lentiviral vector along with lentiviral packaging plasmids pMD2.g and pspax2 using Polyethylenimine (PEI) (Polysciences Inc). The medium was replaced the day after transfection with fresh culture medium, and 72 hr after transfection, viral supernatant was collected. For lentiviral infections, cells were seeded in a 6-well plate at about 70% confluency. Viral supernatant was added to the cells along with Polybrene (10μg/ml) (Santa Cruz Biotechnology Inc) and the cells were spun at 2000 rpm for 90 min at 22°C (Spin-infection). After the spin-infection, the culture medium was replaced with fresh medium, and cells were incubated for at least 48 hr before further analysis.
Microscopy
Unless stated otherwise, all live-cell imaging experiments were performed using U2OS cells expressing TetR, scFv-sfGFP and PCP-mCherry-CAAX ( Yan et al., 2016 , Ruijtenberg et al., 2018 ). Cells were seeded 48h before imaging in 96-well glass bottom dishes (Matriplates, Brooks Life Science Systems) at 20%–25% confluency. Cells were transfected with reporter plasmid DNA 24h before imaging. Thirty minutes before imaging, the cell culture medium was replaced with pre-warmed CO 2 -independent Leibovitz’s-15 medium (GIBCO) and transcription of the reporters was induced by addition of doxycycline (1 μg/ml) (Sigma-Aldrich). Images were acquired using a Nikon TI inverted microscope with perfect focus system equipped with a Yokagawa CSU-X1 spinning disc, a 100x 1.49 NA objective and an iXon Ultra 897 EM-CCD camera (Andor) using Micro-Manager software ( Edelstein et al., 2010 ) and NIS software (Nikon). During the experiment, cells were maintained at a constant temperature of 37°C. Unless stated otherwise, single Z-plane images were acquired, with the bottom of the cell in the focal plane. Camera exposure times of 500 ms were used for both GFP and mCherry, and images were acquired with an interval of 30 s, unless stated otherwise. Of note, mCherry-positive lysosomes were visible in most cells, but these could easily be distinguished from mRNAs based on fluorescence intensity and diffusion kinetics. In experiments in which untethered mRNAs were tracked, U2OS cells expressing PCP-Halo (instead of PCP-mCherry-CAAX) were used. Cells were labeled with Halo-TMR ligand (Promega) (50nM concentration for 2 h) before imaging. Single Z-plane images were acquired, with the region just below the nucleus of the cell in the focal plane. Images were taken with an interval of 15 s and camera exposure times of 500 ms were used for both GFP and TMR. In experiments in which the intensity of green spots was measured in 3D before and after cleavage, Z stacks were acquired for GFP. We acquired 11 slices with an inter-slice distance of 1 μm each, and used a 100 ms exposure time. For mCherry, a single Z-plane was imaged with 500 ms exposure time. Images were acquired at a 10 s time interval. In experiments in which the intensity of red spots was measured after mRNA cleavage, low laser power (∼8x lower than used for other imaging) and high exposure times (1500 ms) were used for mCherry to reduce photobleaching and increase signal-to-noise. This enabled accurate detection and measurement of mCherry foci for > 300 time points.
Quantitative RT-PCR U2OS cells stably expressing
TetR or TetR, scFv-sfGFP, PCP-mCherry-CAAX ( Yan et al., 2016 ) were seeded in 24-well plastic bottom plates at ∼10% confluency 72h before harvesting of cells. When the effect of UPF1 siRNA on reporter expression was assessed, a reverse transfection with 10 nM siRNA against UPF1 was performed during seeding, and another siRNA transfection was performed 24h after seeding. 48h after seeding, equal amounts of TPI WT , TPI PTC160 or TPI PTC1 reporter constructs were co-transfected with a control plasmid, and doxycycline was added for 24h to induce transcription of the reporters. 72hr after cell seeding, RNA was isolated using RNeasy plus mini kit (QIAGEN) according to manufacturer’s guidelines, and cDNA was generated using Bioscript reverse transcriptase (Bioline) and Oligo-d(T) primers. qPCRs were performed using SYBR-Green Supermix (Bio-Rad) on a Bio-Rad Real time PCR machines (CFX Connect Real-Time PCR Detection System). RNA abundance of reporter mRNAs was measured using two different primer sets that amplified a ∼200 nt regions upstream or downstream of the PTC. Reporter mRNA abundance was normalized to the expression of the control plasmid that was co-transfected to control for differences in transfection efficiency. The average of the two primer sets was then used as the final value for mRNA abundance. For checking efficiencies of UPF1 and XRN1 siRNAs by qPCR, U2OS cells expressing TetR, scFv-sfGFP and PCP-mCherry-CAAX ( Yan et al., 2016 ) were seeded in 24-wells plates. Respective siRNAs (10mM) were transfected during cell plating using reverse translation and cells were harvested 3 days after transfection. RNA isolation was performed using TRIsure (Bioline) according to manufacturer’s protocol. cDNA synthesis and qPCRs were performed as described above, except that GAPDH mRNA levels were used to normalize mRNA abundance. For determining splicing efficiency of NMD reporters, U2OS cells expressing TetR were seeded in 24-wells plates at 20%–25% confluency 48h before harvesting. After 24h cells were transfected with either a kif18b reporter that contained an intron or a matched reporter in which the intron sequence was removed from the plasmid. 3h before harvesting of cells, doxycycline was added to the cell culture medium to induce transcription, and 200 μg/ml cycloheximide was added to prevent degradation of spliced transcripts by NMD. RNA was isolated using RNeasy plus mini kit (QIAGEN) with on-column DNase treatment (RNase-free DNase set, QIAGEN) according to manufacturer’s protocol. cDNA synthesis and qPCR were performed as described above. To assess splicing efficiency, we used a primer set that amplified the reporter mRNA independent of its splicing status (total transcript) and a primer set for which one primer binds at the exon-exon junction, which only generates a PCR product when the transcript is spliced. The no-intron control reporter has the same mRNA sequence as the spliced transcript, and should therefore be amplified by both primer sets. We compared the ratio in abundance of the two amplicons (e.g., ‘total’ and ‘spliced’), and normalized this ratio to the ratio of total and spliced amplicons obtained with the no-intron control reporter. To ensure that the ‘spliced’ mRNA-specific primer set is indeed specific to spliced mRNAs, we tested the spliced mRNA-specific primer set on plasmid DNA. Amplification was tested on plasmid DNA in which the intron was present, which resembles unspliced mRNA and should thus not be amplified, and plasmid DNA in which the intron was not present, which resembles spliced mRNA and should be efficiently amplified. Each spliced mRNA-specific primer set amplified plasmid DNA lacking an intron > 500 fold more efficiently than plasmid DNA containing an intron, confirming the specificity of these primer sets.
Flow Cytometry
For analysis of splicing by flow cytometry using fluorescence splicing reporters, U2OS cells were seeded in 24-well plates at 20%–25% density. 24 hr after seeding, cells were transfected with plasmids encoding the splicing reporters and 1μg/ml doxycycline was added to induce expression of the reporter. 48 hr after seeding, cells were harvested and analyzed for GFP and BFP expression by flow cytometry using a Cytoflex analyzer (Beckman Coulter). The ratio of BFP-to-GFP signal intensity was then determined for each cell and the average BFP/GFP ratio for the cell population was calculated for each reporter. The BFP/GFP ratio of intron-containing reporters was then normalized to the average ratio of BFP/GFP of 6 no-intron control reporters (which represent fully spliced mRNAs) to determine the splicing efficiency.
Supplemental Information Document S1. Figures S1–S7 Table S1. Plasmid List and Sequences, qPCR Primers, and Experimental Details, Related to STAR Methods Document S2. Article plus Supplemental Information
📊 Figures
Figureu00a01
An Assay for Real-Time Visualization of NMD of Single mRNA Molecules (A) Schematic of NMD single-molecule imaging assay before (top) or after (bottom) NMD induction. Green and red spots (insets) show ...
Figureu00a02
NMD Occurs with Equal Probability during Each Round of Translation (A) Experimentally determined cleavage time distribution of TPI PTC1 is shown (black dotted line). Predicted cleavage time distributi...
Figureu00a03
NMD Does Not Occur Preferentially on CBC-Bound mRNAs (Au2013G) U2OS cells expressing scFv-sfGFP, PCP-mCherry-CAAX, and the translation reporter shown in (A) were transfected with ha4E-BP1 or mock tran...
Figureu00a04
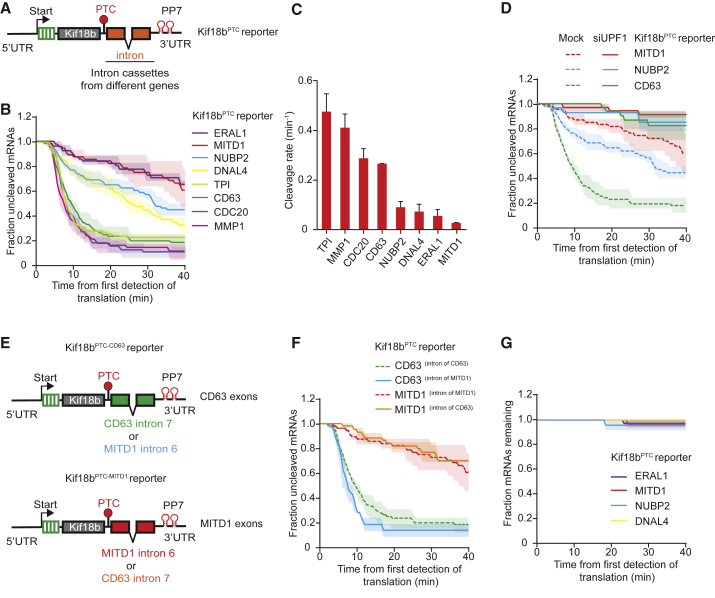
The NMD Cleavage Rate Is Variable and Depends on Exon Sequences Downstream of the PTC (A) Schematic of indicated reporter. (Bu2013G) U2OS cells expressing scFv-sfGFP and PCP-mCherry-CAAX were transfec...
Figureu00a05
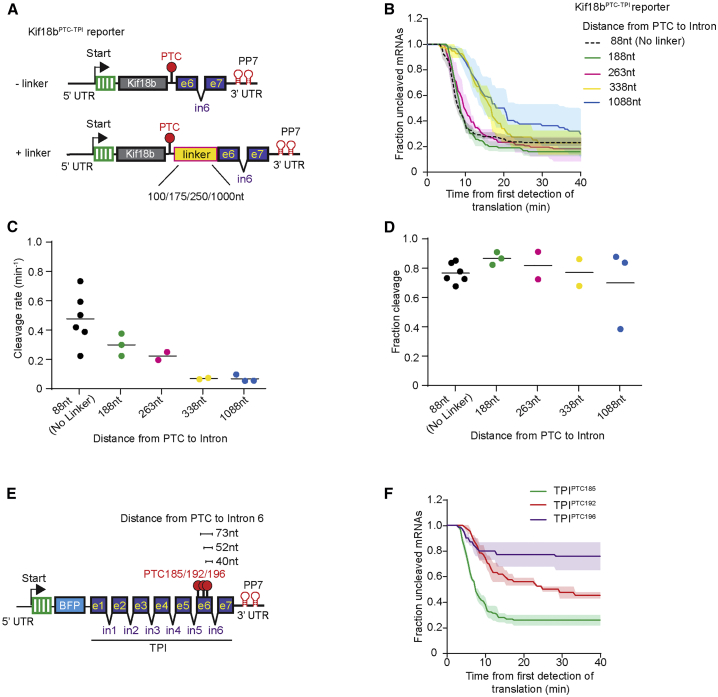
PTC-to-Intron Distance Affects Both the Decay Rate and Fraction of NMD-Resistant mRNA Molecules (A) Schematic of indicated reporters. (Bu2013D and F) U2OS cells expressing scFv-sfGFP and PCP-mCherry-C...
Figureu00a06
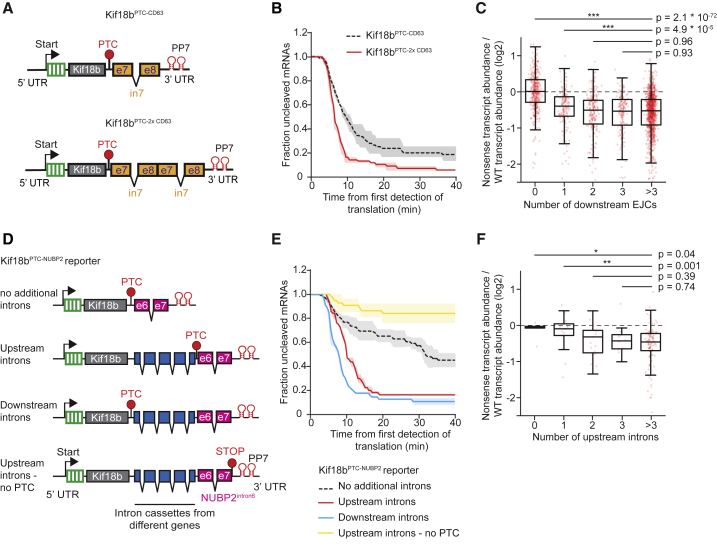
The Number and Position of Introns Relative to the PTC Affects the NMD Decay Rate and Fraction NMD-Resistant mRNA Molecules (A) Schematic of indicated reporters. (B and E) U2OS cells expressing scFv-s...
Figureu00a07
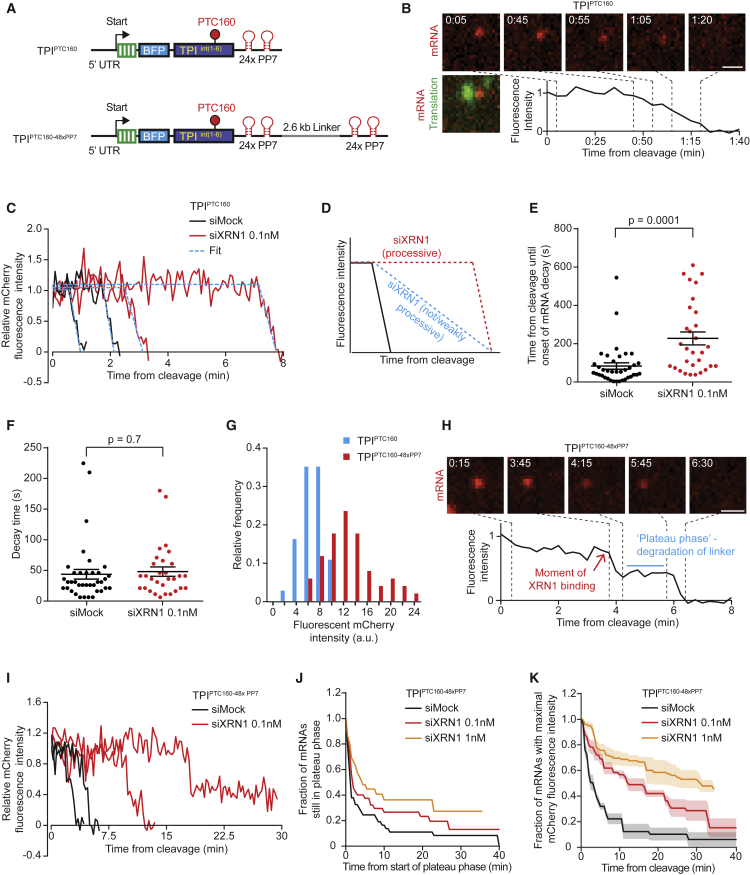
mRNA Decay Kinetics of XRN1 (A) Schematics of indicated reporters. (B, C, and Eu2013K) U2OS cells expressing scFv-sfGFP and PCP-Cherry-CAAX were transfected with either TPI PTC160 (B, C, E, and F) or ...
Figure images are served from the NIH/NLM PubMed Central Open Access Subset or Europe PMC; copyright remains with the publishers and authors.
💬 Discussion
0 commentsNo comments yet. Be the first to start a discussion!
Leave a Comment