Abstract
Full understanding of complex biological interactions frequently requires multi-color detection capability in doing single-molecule fluorescence resonance energy transfer (FRET) experiments. Existing single-molecule three-color FRET techniques, however, suffer from severe photobleaching of Alexa 488, or its alternative dyes, and have been limitedly used for kinetics studies. In this work, we developed a single-molecule three-color FRET technique based on the Cy3-Cy5-Cy7 dye trio, thus providing enhanced observation time and improved data quality. Because the absorption spectra of three fluorophores are well separated, real-time monitoring of three FRET efficiencies was possible by incorporating the alternating laser excitation (ALEX) technique both in confocal microscopy and in total-internal-reflection fluorescence (TIRF) microscopy.
🔬 Techniques
✨ Fluorophores
🏭 Microscope Brands
🧪 Reagent Suppliers
📷 Detectors
🔎 Objectives
🎨 Filters
🏛️ Research Organizations (ROR)
Affiliated research institutions:
📋 Methods
Fluorophores and setup
Due to their superior brightness, and photostability, cyanine dyes are popularly used in single-molecule FRET experiments [14] . Their photostability can be even further improved by removing ambient oxygen and adding reducing agents [15] . From these considerations, we selected Cy3, Cy5, and Cy7 as fluorophores in this work. The choice is a significant improvement from the previous dye trio–Cy3, Cy5, and Cy5.5 [7] because huge spectral overlap between Cy5 and Cy5.5 can be avoided in the new dye trio ( Figure 1a ). Due to this negligible spectral overlap, data analysis became clearer and more reliable, making it possible in many cases to qualitatively understand molecular motion even without data correction steps. 10.1371/journal.pone.0012270.g001 Figure 1 Dye selection and a confocal setup. (a) Normalized emission (solid lines) and absorption (dash lines) spectra of Cy3 (green), Cy5 (red) and Cy7 (gray). (b) FRET efficiencies of the three FRET pairs as a function of inter-dye distances. R 0 values of Cy3-Cy5 (green), Cy5-Cy7 (red) and Cy3-Cy7 (gray) pairs were calculated as 5.4-nm, 6.2-nm, and 3.8-nm, respectively. (c) A schematic diagram of ALEX three-color confocal setup. The setup was built based on an inverted microscope (TE2000-U, Nikon, Tokyo, Japan) equipped with a three dimensional piezo-stage (LP-100, MadCityLabs, Madison, WI). Two excitation lasers, a diode-pump solid state laser (532-nm, Excelsior-CDRH, Spectra-Physics, Santa Clara, CA) and HeNe laser (633-nm, HRP050, Thorlabs, Newton, NJ), were alternatively switched on and off by using electro-optic modulators (EOM, 350-50, Conoptics, Danbury, CT). To make sure that the two excitation lasers excite the same molecule, they were coupled into a single-mode fiber (460HP, Thorlabs). An oil-immersion objective (UPLSAPO 100×, Olympus, Tokyo, Japan) was used for both the excitation of molecules and the collection of fluorescence signals. The fluorescence signals are measured by using avalanche photo diodes (APD, SPCM-AQRH-14, Perkin Elmer, Wellesley, MA). The identities of other optics are: D1, a dichroic mirror (z532bcm, Chroma, Rockingham, VT); D2, dichroic mirror (z532/633rpc, Chroma); P, pinhole (P75S, Thorlabs); L1 and L2, lens (LAO-90.0-25.0/078, CVI, Irvine, CA); D3, dichroic mirror (640dcxr, Chroma); D4, dichroic mirror (740dcxr, Chroma); F1, bandpass filter (HQ580/60m-2p, Chroma); F2, bandpass filter (HQ680/60m-2p, Chroma); F3, bandpass filter (HQ790/80m, Chroma). Initially we were concerned about a short working range of the Cy3-Cy7 FRET pair. To compare the FRET ranges of the three FRET pairs, a Förster distance, R 0 , for each FRET pair was calculated from the following equation: R 0 6 = 0.529 κ 2 Φ D J(λ)/N A n 4 [16] , where R 0 and λ are in the unit of centimeter, Φ D is the donor quantum yield, J(λ) is the spectral overlap of the donor emission and the acceptor absorption, N A is the Avogadro number, n is the refractive index of the medium, and κ 2 is determined by the relative orientation of the two dyes. By using the quantum yields of Cy3 and Cy5 provided by the GE Health care (16% for Cy3, and 27% for Cy5), assuming the κ 2 is 2/3, and calculating J(λ) from the measurements, Förster distances of Cy3-Cy5, Cy5-Cy7, and Cy3-Cy7 FRET pairs were obtained as 5.4-nm, 6.2-nm, and 3.8-nm, respectively. Figure 1b shows FRET efficiencies of the three FRET pairs as a function of inter-dye distances, based on the above calculation. Even though the emission spectra of Cy3 and Cy7 are almost completely separated, the graph shows that the Cy3-Cy7 pair is a good FRET probe in the range of 2-nm to 5-nm. The well-separated absorption spectra of the new dye trio enabled us to incorporate the ALEX technique, which was not feasible in the previous Cy3-Cy5-Cy5.5 dye trio. To realize the ALEX technique in confocal microscopy ( Figure 1c ), we followed the scheme of Namki Lee et al [9] . Electro-optic modulators were used to alternatively switch a green laser and a red laser. To make easier the colocalization of the excitation lasers, they were coupled into the same single mode fiber. We used three avalanche photodiodes as a fluorescence detector. Details of optics are described in the figure caption. Data acquisition of fluorescence signals were synchronized with the laser switching by using a common trigger signal of a timer/counting board (DAQ PCI-6602, NI, Austin, TX). The whole setup was run by a home-made program. Correction of background, bleedthrough, and direct excitation Before FRET analysis, all data were corrected for background noise, bleedthrough between detection channels, and direct excitation of acceptors as follows. To generalize the following discussion, we use indices to indicate FRET probes and detection channels in the increasing order of emission peaks. So, in this paper, the first, the second, and the third dyes correspond to Cy3, Cy5, and Cy7, respectively. In the discussion of this section, we don't specify which excitation laser is used, because it does not affect the discussion. Thus the following symbols are: , total fluorescence intensity in the i th detection channel after background subtraction , fluorescence intensity of the i th dye detected in the i th detection channel , sum of fluorescence intensities of the i th dye detected in the all three channels. The first data correction step was background subtraction. Next we corrected the bleedthrough between detection channels. By assuming no bleedthrough from the longer wavelength dyes into the shorter wavelength detection channels, we get the following expressions. (1) (2) (3) where l ij is the bleedthrough parameter of the i th dye into the j th detection channel. For example, denotes the amount of Cy3 fluorescence signal detected in the second detection channel in units of Cy3 signal detected in the first detection channel. Specifically, , and can be determined from the ratios of , and when only Cy3 is present. Similarly, is the ratio of when only Cy5 is present. By solving the above equations, we obtained the following equations. (4) (5) (6) Next, we obtained , and by adding back the bleedthrough signals into the proper detection channels as follows. (7) (8) (9) To correctly calculate the FRET efficiency of each FRET pair, we should consider the differences in emission quantum yields of fluorophores, and the detection efficiencies of the detection channels, which can be corrected as follows, a step called the gamma correction [2] , [14] . (10) (11) (12) where is the ratio of to , and is the ratio of to during a conformational change or photobleaching. Because these gamma factors vary depending on dye labeling scheme and optical design, they should be determined case by case. Bleedthrough and gamma correction parameters used in our experiment are summarized in Table 1 . 10.1371/journal.pone.0012270.t001 Table 1 The correction parameters used in this work.
Show full methods section
Fluorophores and setup
Due to their superior brightness, and photostability, cyanine dyes are popularly used in single-molecule FRET experiments [14] . Their photostability can be even further improved by removing ambient oxygen and adding reducing agents [15] . From these considerations, we selected Cy3, Cy5, and Cy7 as fluorophores in this work. The choice is a significant improvement from the previous dye trio–Cy3, Cy5, and Cy5.5 [7] because huge spectral overlap between Cy5 and Cy5.5 can be avoided in the new dye trio ( Figure 1a ). Due to this negligible spectral overlap, data analysis became clearer and more reliable, making it possible in many cases to qualitatively understand molecular motion even without data correction steps. 10.1371/journal.pone.0012270.g001 Figure 1 Dye selection and a confocal setup. (a) Normalized emission (solid lines) and absorption (dash lines) spectra of Cy3 (green), Cy5 (red) and Cy7 (gray). (b) FRET efficiencies of the three FRET pairs as a function of inter-dye distances. R 0 values of Cy3-Cy5 (green), Cy5-Cy7 (red) and Cy3-Cy7 (gray) pairs were calculated as 5.4-nm, 6.2-nm, and 3.8-nm, respectively. (c) A schematic diagram of ALEX three-color confocal setup. The setup was built based on an inverted microscope (TE2000-U, Nikon, Tokyo, Japan) equipped with a three dimensional piezo-stage (LP-100, MadCityLabs, Madison, WI). Two excitation lasers, a diode-pump solid state laser (532-nm, Excelsior-CDRH, Spectra-Physics, Santa Clara, CA) and HeNe laser (633-nm, HRP050, Thorlabs, Newton, NJ), were alternatively switched on and off by using electro-optic modulators (EOM, 350-50, Conoptics, Danbury, CT). To make sure that the two excitation lasers excite the same molecule, they were coupled into a single-mode fiber (460HP, Thorlabs). An oil-immersion objective (UPLSAPO 100×, Olympus, Tokyo, Japan) was used for both the excitation of molecules and the collection of fluorescence signals. The fluorescence signals are measured by using avalanche photo diodes (APD, SPCM-AQRH-14, Perkin Elmer, Wellesley, MA). The identities of other optics are: D1, a dichroic mirror (z532bcm, Chroma, Rockingham, VT); D2, dichroic mirror (z532/633rpc, Chroma); P, pinhole (P75S, Thorlabs); L1 and L2, lens (LAO-90.0-25.0/078, CVI, Irvine, CA); D3, dichroic mirror (640dcxr, Chroma); D4, dichroic mirror (740dcxr, Chroma); F1, bandpass filter (HQ580/60m-2p, Chroma); F2, bandpass filter (HQ680/60m-2p, Chroma); F3, bandpass filter (HQ790/80m, Chroma). Initially we were concerned about a short working range of the Cy3-Cy7 FRET pair. To compare the FRET ranges of the three FRET pairs, a Förster distance, R 0 , for each FRET pair was calculated from the following equation: R 0 6 = 0.529 κ 2 Φ D J(λ)/N A n 4 [16] , where R 0 and λ are in the unit of centimeter, Φ D is the donor quantum yield, J(λ) is the spectral overlap of the donor emission and the acceptor absorption, N A is the Avogadro number, n is the refractive index of the medium, and κ 2 is determined by the relative orientation of the two dyes. By using the quantum yields of Cy3 and Cy5 provided by the GE Health care (16% for Cy3, and 27% for Cy5), assuming the κ 2 is 2/3, and calculating J(λ) from the measurements, Förster distances of Cy3-Cy5, Cy5-Cy7, and Cy3-Cy7 FRET pairs were obtained as 5.4-nm, 6.2-nm, and 3.8-nm, respectively. Figure 1b shows FRET efficiencies of the three FRET pairs as a function of inter-dye distances, based on the above calculation. Even though the emission spectra of Cy3 and Cy7 are almost completely separated, the graph shows that the Cy3-Cy7 pair is a good FRET probe in the range of 2-nm to 5-nm. The well-separated absorption spectra of the new dye trio enabled us to incorporate the ALEX technique, which was not feasible in the previous Cy3-Cy5-Cy5.5 dye trio. To realize the ALEX technique in confocal microscopy ( Figure 1c ), we followed the scheme of Namki Lee et al [9] . Electro-optic modulators were used to alternatively switch a green laser and a red laser. To make easier the colocalization of the excitation lasers, they were coupled into the same single mode fiber. We used three avalanche photodiodes as a fluorescence detector. Details of optics are described in the figure caption. Data acquisition of fluorescence signals were synchronized with the laser switching by using a common trigger signal of a timer/counting board (DAQ PCI-6602, NI, Austin, TX). The whole setup was run by a home-made program. Correction of background, bleedthrough, and direct excitation Before FRET analysis, all data were corrected for background noise, bleedthrough between detection channels, and direct excitation of acceptors as follows. To generalize the following discussion, we use indices to indicate FRET probes and detection channels in the increasing order of emission peaks. So, in this paper, the first, the second, and the third dyes correspond to Cy3, Cy5, and Cy7, respectively. In the discussion of this section, we don't specify which excitation laser is used, because it does not affect the discussion. Thus the following symbols are: , total fluorescence intensity in the i th detection channel after background subtraction , fluorescence intensity of the i th dye detected in the i th detection channel , sum of fluorescence intensities of the i th dye detected in the all three channels. The first data correction step was background subtraction. Next we corrected the bleedthrough between detection channels. By assuming no bleedthrough from the longer wavelength dyes into the shorter wavelength detection channels, we get the following expressions. (1) (2) (3) where l ij is the bleedthrough parameter of the i th dye into the j th detection channel. For example, denotes the amount of Cy3 fluorescence signal detected in the second detection channel in units of Cy3 signal detected in the first detection channel. Specifically, , and can be determined from the ratios of , and when only Cy3 is present. Similarly, is the ratio of when only Cy5 is present. By solving the above equations, we obtained the following equations. (4) (5) (6) Next, we obtained , and by adding back the bleedthrough signals into the proper detection channels as follows. (7) (8) (9) To correctly calculate the FRET efficiency of each FRET pair, we should consider the differences in emission quantum yields of fluorophores, and the detection efficiencies of the detection channels, which can be corrected as follows, a step called the gamma correction [2] , [14] . (10) (11) (12) where is the ratio of to , and is the ratio of to during a conformational change or photobleaching. Because these gamma factors vary depending on dye labeling scheme and optical design, they should be determined case by case. Bleedthrough and gamma correction parameters used in our experiment are summarized in Table 1 . 10.1371/journal.pone.0012270.t001 Table 1 The correction parameters used in this work.
Parameters Confocal setup
TIRF setup 0.13 0.13 ∼0 ∼0 0.11 0.18 HJ: 0.67, Dp: 0.88 HJ: 0.60 HJ: 1.28, Dp: 1.97 HJ: 1.50 The identities of symbols are defined in the text. The gamma correction parameters are for the Holliday junction (HJ), and for DNA duplexes (Dp). In FRET experiments, it is ideal for each laser to excite only one fluorophore, which is a good approximation for green laser excitation as the absorption of Cy5, and Cy7 at 532-nm are just 3% and 2% of their peak values, respectively. However, the absorption of Cy7 at 633-nm is not negligible (13% of its peak value), and thus at red excitation condition is contributed by both FRET from Cy5 and the direct absorption of the excitation laser. Fortunately the direct excitation part can be removed as follows. We assume that the ratio of the direct absorption of Cy7 to the absorption of Cy5 is conserved, and thus the ratio of Cy7 fluorescence due to the direct absorption to the sum of I 2 and I 3 . Because the Cy7 fluorescence when Cy5 is photobleached comes only from the direct excitation of Cy7, we can obtain the portion of the direct excitation of Cy7 in I 2 + I 3 by comparing I 2 + I 3 values before and after Cy5 bleaching. By analyzing intensity time traces of ∼20 molecules, we concluded that 20% of I 2 + I 3 come from the direct excitation of Cy7, a number similar to the ratio of Cy7 absorption to that of Cy5 at 633-nm (19%). From now on, we will use I 3 to denote Cy7 intensity after the subtraction of the direct excitation contribution.
DNA preparation
To test our ALEX single-molecule three-color FRET setup, we used two DNA constructs: a DNA duplex and the Holliday junction. To assemble DNA duplexes, we purchased the following DNA sequences (written from 5′ to 3′) from IDTDNA (Coralville, IA). a : biotin-CCGTA T GTAGCAACAGAGCGGTGGG b 1 : Cy5-CCCACCGCTCTGT T GCTACATACGG b 2 : Cy5-CCCACCGCTCTG T TGCTACATACGG b 3 : Cy5-CCCACCGCTC T GTTGCTACATACGG The bold-faced T in the strand a was internally labeled with Cy7, and those in the strand b 's with Cy3. By annealing the strand a and b 1 , DNA duplex dp1 was made. In the same way, dp2 and dp3 were made by annealing a with b 2 or b 3 , respectively. To construct the Holliday junction, the following DNA sequences (written from 5′ to 3′) were purchased from Bioneer Co. (Daejon, South Korea), and annealed by mixing b (50 µM, 20 µl), h (50 µM, 20 µl), r (45 µM, 20 µl), x (50 µM, 20 µl), and slowly cooling down from 90°C to the room temperature in 10 mM Tris-HCl (pH 8.0) with 50 mM NaCl. b : Cy5-CCCTAGCAAGCCGCTGCTACGG h : Cy3-CCGTAGCAGCGCGAGCGGTGGG r : biotin-CCCACCGCTCGGCTCAACTGGG-Cy7 x : GGGCGGCGACCTCCCAGTTGAGCGCTTGCTAGGG Single-molecule experiments A sample chamber was made between a cleaned quartz slide and a coverslip using double-sided adhesive tape. DNA molecules were immobilized on quartz surface by successive addition of biotinylated BSA (40 ul, 1 mg/ml, Sigma-Aldrich, ST Louis, MO), streptavidin (0.2 mg/ml, 40 ul, Invitrogen, Carlsbad, CA), and DNA in TN buffer (10 mM Tris-HCl, pH 8.0, 50 mM NaCl). Each addition was incubated for 5 minutes, and followed by washing with TN buffer. The concentration of the DNA solution was adjusted to give a good surface density for single-molecule experiments. After checking that fluorescent spots were well separated from one another, we injected 60 µl of imaging buffer (10 mM Tris-HCl (pH8.0) with 0.4% (w/v) glucose (Sigma-Aldrich), 1% (v/v) Trolox (Sigma-Aldrich), 1 mg/ml glucose oxidase (Sigma-Aldrich), 0.04 mg/ml catalase (Roche, Nutley, NJ)), and designated magnesium ions.
Supporting Information Figure S1 The conformational dynamics of the Holliday junction with a different labeling scheme. (a) Dye labeling scheme. (b) Conformational dynamics between two isoforms. (c) Fluorescence intensity time traces of the Holliday junction upon 532-nm excitation (upper graphs), and 633-nm excitation (lower graphs). The experimental condition is the same as in Fig. 3 . (d) FRET efficiency time traces calculated from (c). (0.22 MB PDF) Click here for additional data file. Figure S2 Transition rates of the Holliday junction at 20 °C with 50 mM MgCl2. The dwell-time histograms of isoI (a), and isoII (b) were made from more than 30 molecules with all three dyes, and fitted to single-exponential functions, and their transition times were obtained as 0.22 s, and 0.24 s, respectively. These numbers are little bit larger than the numbers previously reported by McKinney et al. on Nat. Struct. Biol. in 2003 (0.18 s, and 0.16 s, respectively). However, considering that they did experiments at 25 °C, our results are consistent with theirs. (0.04 MB PDF) Click here for additional data file. Figure S3 Photobleaching time of Alexa 488, Cy5 and Cy7. (a) Typical intensity time traces of the Holliday junction labeled with Alexa488 and Cy3. (b) Histogram of Alexa488 photobleaching time. The histogram was fitted to a single-exponential curve, and 43 s of photobleaching time was obtained. (c), and (e) Representative intensity time traces of the Holliday junction labeled with Cy3, Cy5 and Cy7. During 300 s observation time, 64% of molecules showed Cy5 photobleaching first as in (c), and 22% of molecules showed Cy7 photobleaching first as in (e). The rest of molecules didn't show any photobleaching of either Cy5 nor Cy7. (d) Histogram of Cy5 photobleaching time with 157-s decay constant. (f) Histogram of Cy7 photobleaching time with 123-s decay constant. (0.19 MB PDF) Click here for additional data file.
📊 Figures
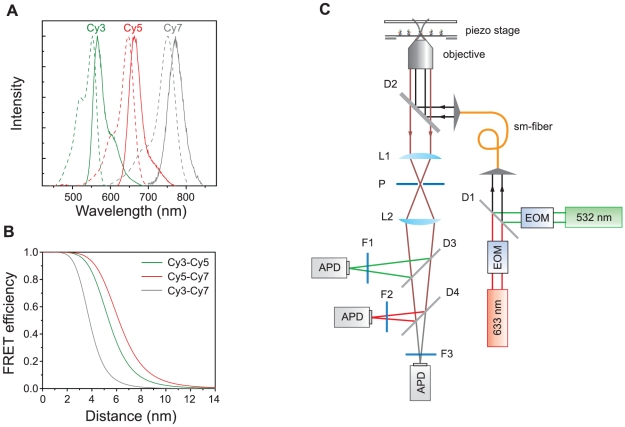
Figure 1
Dye selection and a confocal setup.
(a) Normalized emission (solid lines) and absorption (dash lines) spectra of Cy3 (green), Cy5 (red) and Cy7 (gray). (b) FRET efficiencies of the three FRET pairs as a function of inter-dye distances. ...
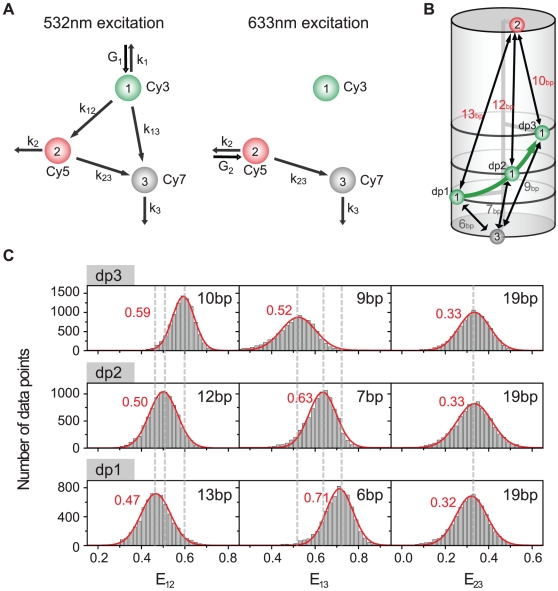
Figure 2
Determination of three FRET efficiencies.
(a) An interaction diagram of three dyes upon 532-nm and 633-nm excitations. The identities of symbols used here are explained in the text. (b) Triply-labeled DNA duplexes. The positions of Cy5 and Cy...
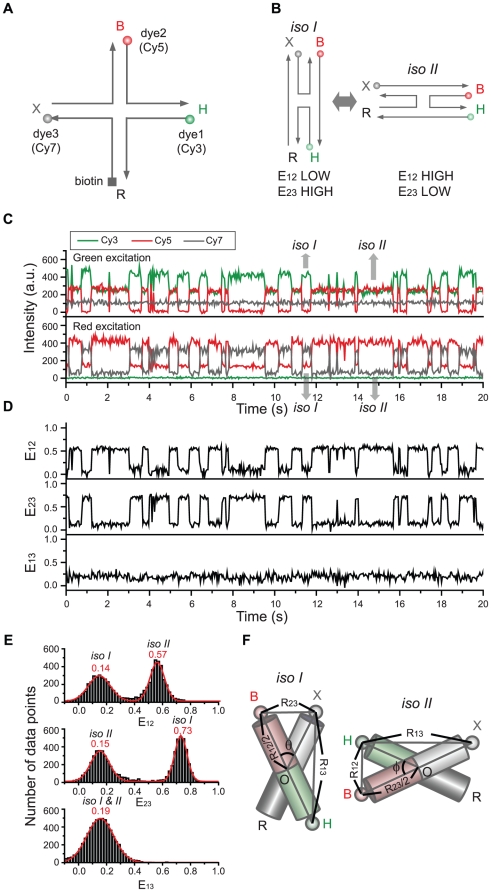
Figure 3
Conformational dynamics of the triply-labeled Holliday junction observed in the confocal setup.
(a) Dye labeling scheme of the Holliday junction. (b) Dynamics of the Holliday junction between two conformers, isoI and isoII. (c) Typical fluorescence intensity time traces of Cy3 (green lines), Cy5...
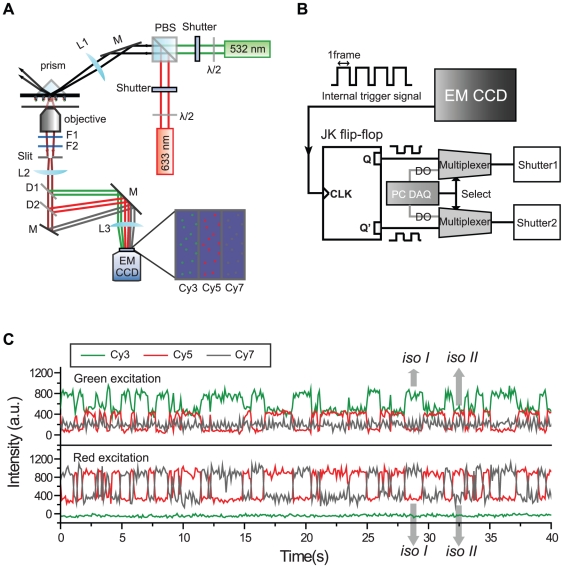
Figure 4
Conformational dynamics of the triply-labeled Holliday junction observed in the TIRF setup.
(a) A schematic diagram of ALEX three-color FRET setup in TIRF microscopy. Then setup was built based on an inverted microscope (IX71, Olympus). For switching purposes, mechanical shutters (LS-3, Unib...
Figure images are served from the NIH/NLM PubMed Central Open Access Subset or Europe PMC; copyright remains with the publishers and authors.
💬 Discussion
0 commentsNo comments yet. Be the first to start a discussion!
Leave a Comment